HTTP request details
Overview
Page request fields apply to the page that is currently selected.General tab
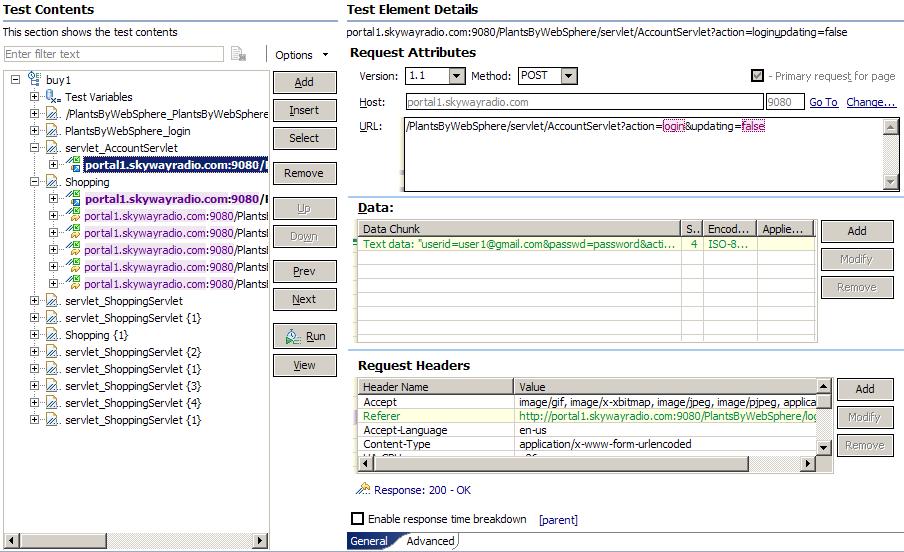
- Version
- Indicates the HTTP version.
- Method
- Indicates the HTTP request method that was used during recording. Typically, you do not change this value unless you are adding a new request to a test. GET, POST, PUT, HEAD, and DELETE are supported.
- Primary request for page
- Displayed for the primary request, and cannot be modified. A page can contain only one primary request.
- Click to set as primary
- Displayed for all secondary requests. Because each page can have
only one primary request, if you select this option, the Primary
request for page option is moved to this request, and
the Click to set as primary option is moved
to the original primary request.
To undo change, select Click to set as primary on the original primary request.
- Host
- Host name for the Web server. Typically, this is the fully qualified domain name. The next box specifies the listener port on the Web server.
- URL
- Path to a resource (such as a page, graphics file, or stylesheet file). When the method is GET, the URL field typically includes query strings that are designated as datapool candidates.
- Data
- Specifies additional content data that might be needed to clarify the request. When the method is POST, the data frequently includes values that are designated as datapool candidates.
- Request Headers
- Lists each request header and its value.
To change the value of a header, click the row, and then click Modify.
To add a new header, click Add.
To delete a header, click Remove.
- Enable response time breakdown
- Enable the collection of response time breakdown data.
You can enable response time breakdown collection at the parent or page level. Not all test elements support response time breakdown data collection.
Advanced tab
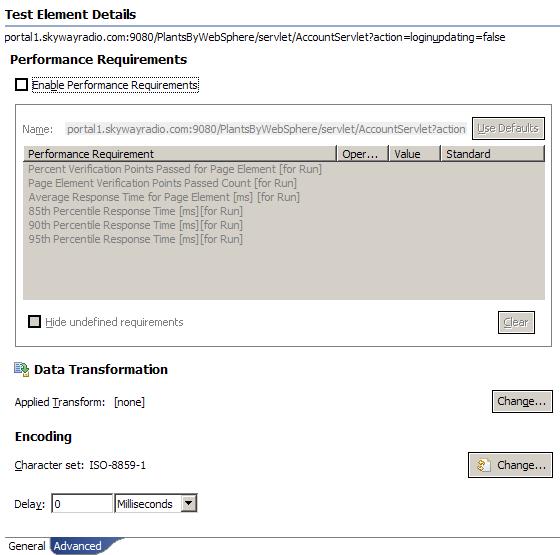
- Enable Performance Requirements
- Enable the use of performance requirements for this test.
- Name
- Name of this set of defined performance requirements. By default, it is the URL of the request. Although you can change the name to improve readability, only the Performance Requirements report uses this name. Other reports use the default name. Click Use Defaults to reset Name to the default value.
- Performance Requirement
- All performance requirements are displayed in the table. Shaded
requirements indicate that they are undefined.
To define a requirement, set an Operator and Value. To apply the defined requirement to multiple requests, select the requests in the test, right-click the requirement row in the table, and click Copy Requirements.
- Operator
- Click this field to display a list of mathematical operators. Select an operator for the performance requirement.
- Value
- Click this field to set a value for the requirement.
- Standard
- Enable this requirement to be processed by the report as a standard requirement. Standard requirements can cause a test to fail. Performance requirements that are not listed as standard do not cause the test to fail.
- Hide Undefined Requirements
- Select to prevent undefined performance requirement candidates from appearing in the table. This hides all shaded rows.
- Clear
- Select one or more requirements and click to remove the definition. The requirement is still available and can be redefined.
- Applied Transform
- Indicates the data transform that is applied to the request. Click Change to select a data transformation to apply to the request.
- Character set
- Indicates the character set to be used for the page request. Click Change to see the valid character sets.
- Delay
- Indicates the programmatically calculated time delay before this request is issued. Delays are statistical emulations of user behavior. You can scale this delay at the test level to make a test play back faster (or slower) than it was recorded.
- Digital Certificates
- Lists details about the certificate stores that the test uses. Click Add to add a certificate store that you want the test to use. HTTP and SOA support digital certificates. Other protocols do not support digital certificates.
- Enable response time breakdown
- Enables collection of response time breakdown data. With response time
breakdown, you can see statistics on any page element. The statistics show
how much time was spent in each part of the system under test. You can use
response time breakdown to identify code problems. You can see which application
on which server is the performance bottleneck, and then drill down further
to determine exactly which package, class, or method is causing the problem.
This option is displayed in multiple test elements. Enabling this option in an element enables it in its children, as well.
For example, enabling monitoring at the test level also enables monitoring at the page and request levels. You can enable monitoring for a specific page; doing so enables monitoring for the requests of that page, but not for other pages or their requests.
HTTP and SOA support response time breakdown. Other protocols do not support response time breakdown.
Related reference