Thread analysis
To analyze the threads, we have to rerun the application with another profiling option.
| Select Run Ć Profile Configurations. |
| For the EntityTester class, in the Monitor tab, select Thread Analysis. |
| Click Edit Options and select Contention analysis. Click Finish. |
| Click Apply, then click Profile. |
| A new entry opens in the Profiling Monitor view (Figure | 7-21). |

Figure 27-21 profiling Monitor with three runs
Double-click Thread Analysis, or click the Open Thread Analysis view icon  . .
|
| The Thread Statistics tab shows the state, running, and waiting time of the threads (Figure | 7-22). |
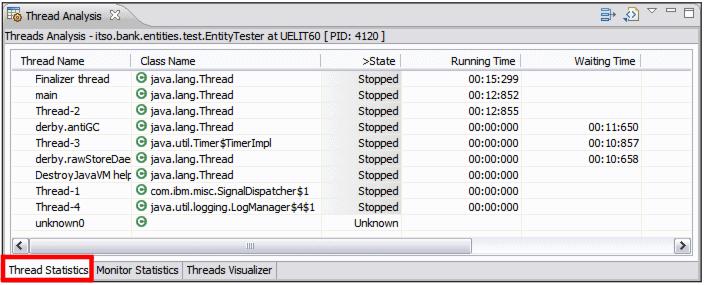
Figure 27-22 Thread Analysis: Thread Statistics
| The Monitor Statistics tab shows the details of a selected thread, including the Java classes involved. |
| The Thread Visualizer tab shows the threads that were active, and the time when they were active (Figure | 7-23). we can see two threads for the Derby database and 5 threads for the application code. |
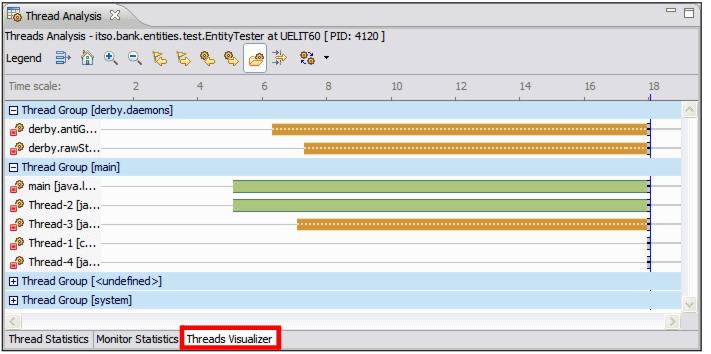
Figure 27-23 Thread Analysis: Visualizer
|
ibm.com/redbooks |