Define NeoLoad Trend Graphs
You can define as many customized graphs as you want from your NeoLoad project. Each graph can display several curves.
- Prerequisite: You need to run a build before being able to add custom graphs.
- To add a custom graph
- Select the job where you want to execute a NeoLoad scenario and select the Statistics tab.
- Click Add new chart.
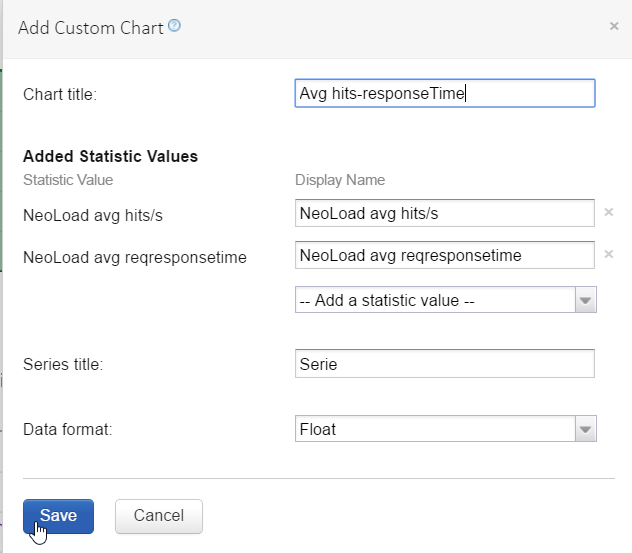
- In the Add Custom Chart screen, enter the information required to define a custom graph:
- Enter a name to identify the graph.
Tip: NeoLoad statistics names are prefixed with "NeoLoad". - In Add a statistic value, select a statistic value for each curve you want to trace in the graph.
- Enter a name to identify the graph.
- Click Save.
