Alerts

Alerts on monitors
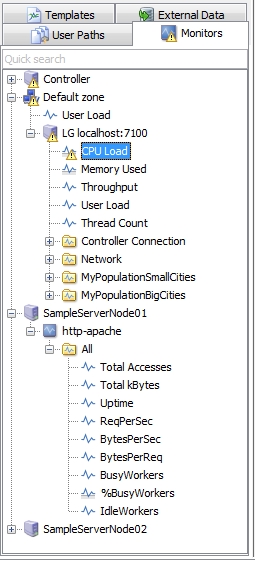
The ![]() icon indicates a performance counter for which one or more alert thresholds have been set.
icon indicates a performance counter for which one or more alert thresholds have been set.
Current and past alerts are shown by an extra notification against the performance counter icon: ![]() for a warning alert,
for a warning alert, ![]() for a critical alert.
for a critical alert.
Alerts are also displayed on graphs as yellow and red zones. The alert thresholds are only shown for the graph curve selected in the legend bar.
To hide or show the alerts and thresholds:
- Right-click, then select Show alert zones or Show thresholds.
You may display a tooltip for the alerts and thresholds:
- Move the mouse pointer over the alert zone or threshold.
Alerts on User User Path elements
Alerts on User Paths elements are displayed in the same way as for monitor performance counters.
When a configuration element is selected, an icon next to each statistic shows the maximum severity reached. The severity is determined by evaluating the results obtained for the element against the associated SLA profile.
Only SLAs of the "Interval-based" family trigger alerts during test runtime when one of their thresholds is exceeded.