WebSphere Lombardi Edition 7.2 > Create reports
Create a third-party report
The following sample shows how to use a third-party tool such as Microsoft Access to create a report.
When querying the Performance Data Warehouse database, you should query the views
Use autotracked data
You can simply enable autotracking, send definitions to the Performance Data Warehouse, run instances of your process, and Lombardi captures data that you can use to run a report like the following sample that compares the duration of each activity in a BPD. That's because autotracking captures entry and exit points for each process component in a BPD.
Use a third-party tool
Because Lombardi stores all performance-related data in the Performance Data Warehouse, you can use third-party tools to query the database and generate reports. The following sample shows how to use Microsoft Access to generate a report from Lombardi data.
In the following sample, our Lombardi Performance Data Warehouse uses a Microsoft SQL Server 2005 database, which we establish a connection to from Microsoft Access 2007. Using MS Access, we'll create a report that shows the average duration for all activities in a particular BPD.
When autotracking is enabled, Lombardi adds a timing interval for each activity in an autotracked BPD. So, if you have autotracking enabled for your BPDs, you can take advantage of the tracked timing intervals using queries and reports.
To start, we create a query in MS Access called CUSTOM_TIMING to
return the following values:
From the following views in the Performance Data Warehouse:
We create the CUSTOM_TIMING query in the MS Access Design view as shown in the following image:
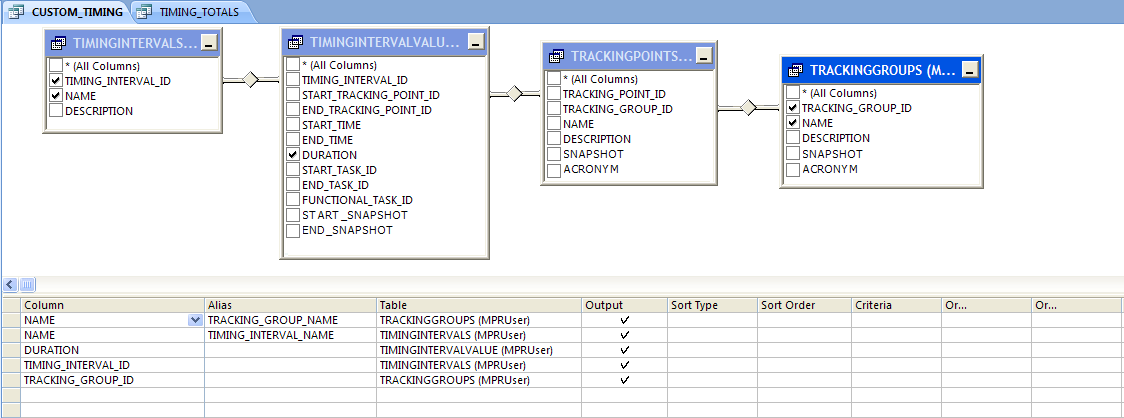
Notice the columns that are used for SQL joins in the preceding Design
view:
- TIMING_INTERVAL_ID in TIMING INTERVALS view to TIMING_ITERVAL_ID in TIMINGINTERVALVALUES view
- START_TRACKING_POINT_ID in TIMINGINTERVALVALUES view to TRACKING_POINT_ID in TRACKINGPOINTS view
- TRACKING_GROUP_ID in TRACKINGPOINTS view to TRACKING_GROUP_ID in TRACKINGGROUPS view
The CUSTOM_TIMING query returns the following rows of data as shown in the MS Access Datasheet view:

The returned columns contain the following data:
- TRACKING_GROUP_NAME: The name assigned to the autotracking group in Lombardi Authoring Environment.
- TIMING_INTERVAL_NAME: Lombardi names each timing interval in an autotracking group as follows: activity_name (bpd_name).
- DURATION: The amount of time that it took the timing interval to complete in milliseconds.
- TIMING_INTERVAL_ID: The ID assigned to the timing interval in the Performance Data Warehouse by Lombardi.
- TRACKING_GROUP_ID: The ID assigned to the tracking group in the Performance Data Warehouse by Lombardi.
Now we create a second query called TIMING_TOTALS to perform the
following functions on the results of the first query:
- Group the data by timing interval name and filter the results to limit them to the BPD named MPR Program Planning; this is possible because Lombardi names the timing intervals: activity_name (bpd_name)
- Add up the total duration times (seconds, minutes, and hours)
- Average the total duration times (seconds, minutes, and hours)
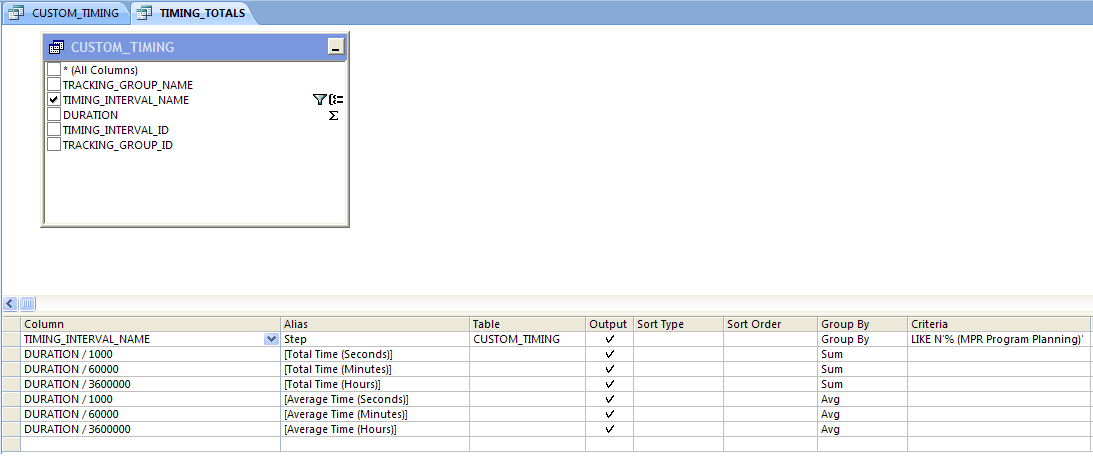
We create the TIMING_TOTALS query in the MS Access Design view as shown in the following image:
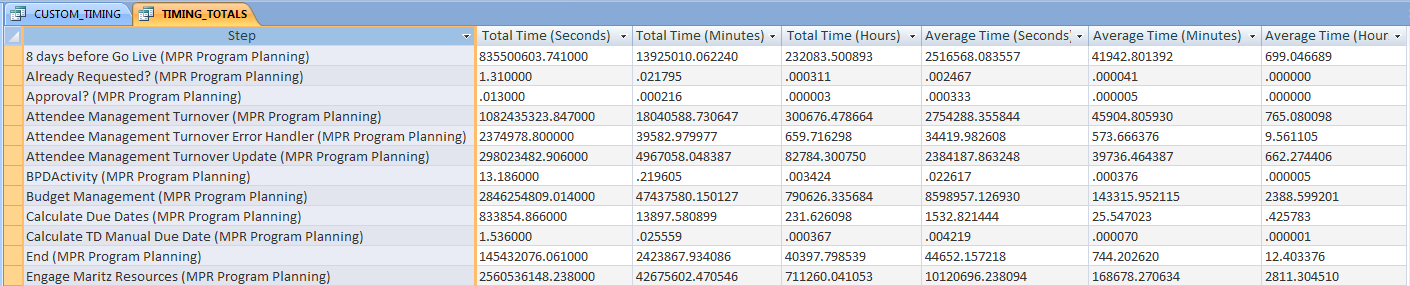
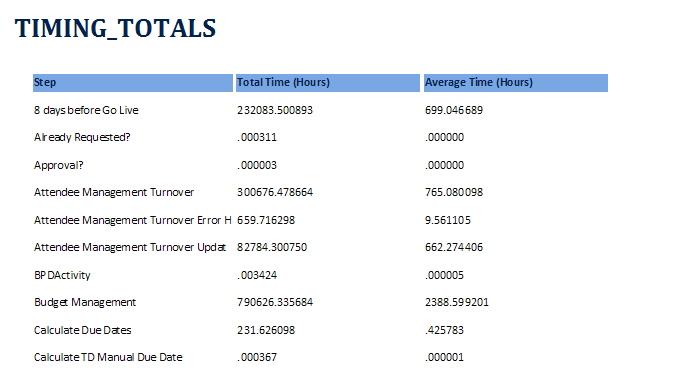
The TIMING_TOTALS query returns the following rows of data as shown in the MS Access Datasheet view:
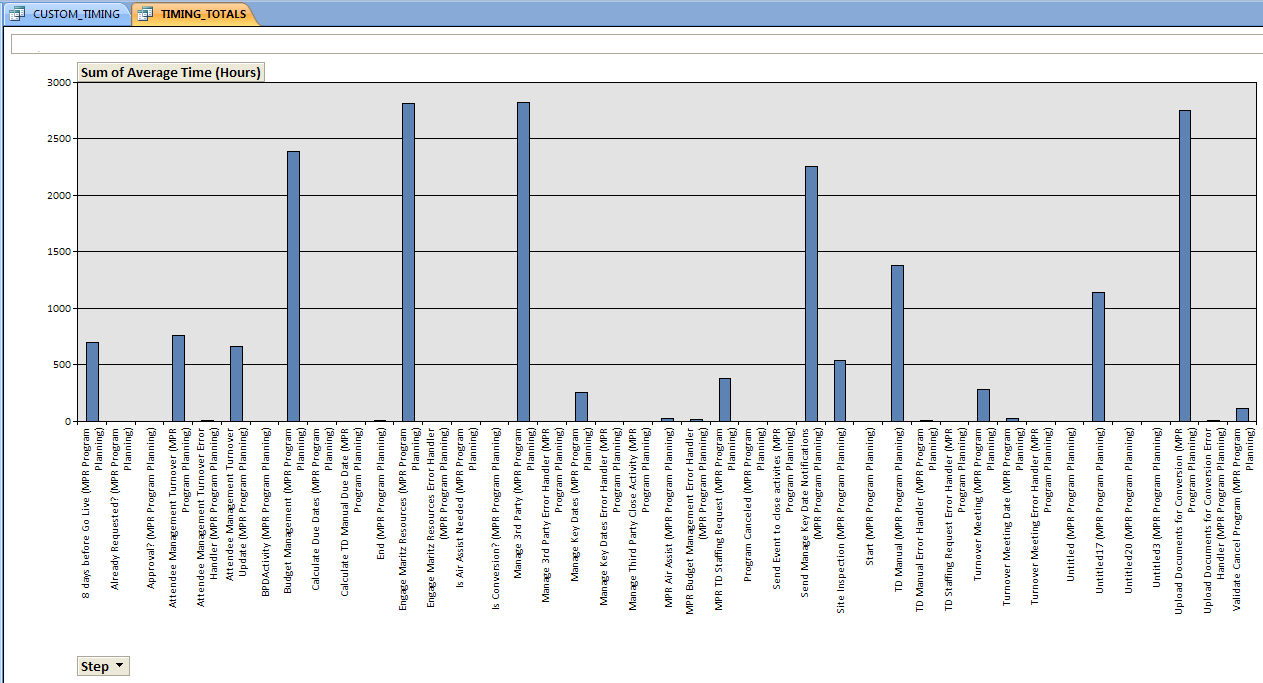
With MS Access, we can switch to the PivotChart view to see these query results in a bar chart :
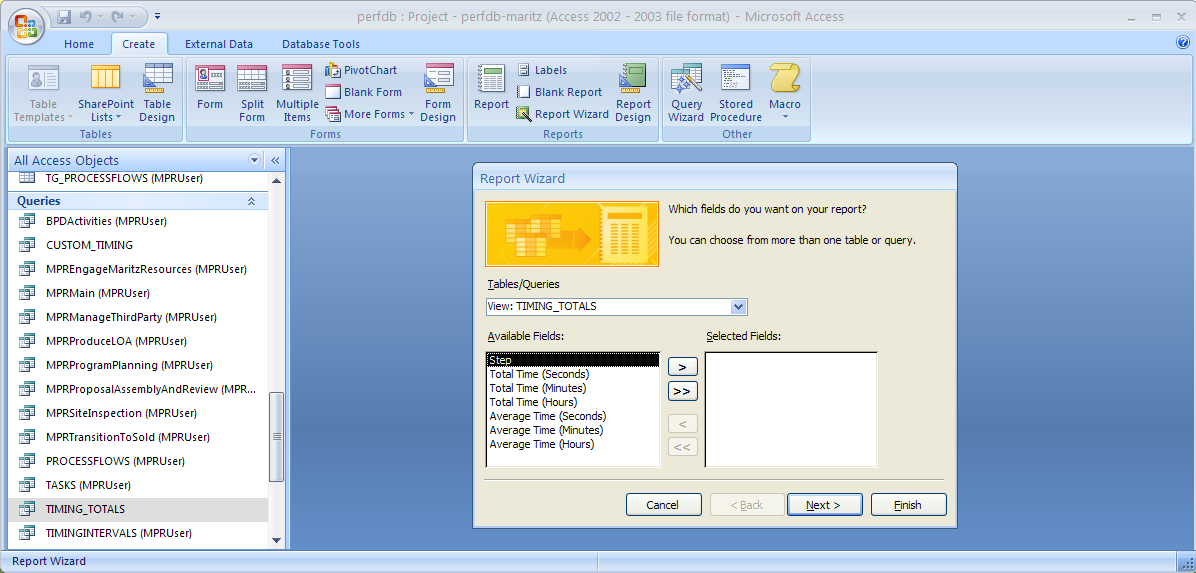
We can also use the Report wizard in MS Access to create a report suitable for printing and distribution. For example, if we click the TIMING_TOTALS query and click Report Wizard in the Create tab, the wizard guides us through report creation :
With the report wizard, we can preview and alter the final report as required:
As the preceding sample illustrates, you can use the third-party tools available in your environment to query the Performance Data Warehouse to analyze and report on your Lombardi business processes. If you create tracking groups to track the variables specific to your processes and you enable autotracking, the data available in the Performance Data Warehouse can provide informative analysis of all your process initiatives.
Parent topic: Create reports