5.4.1 Monitoring eXtreme Scale with the xsadmin utility
WebSphere eXtreme Scale version 7.0 includes a sample xsadmin administration utility. Using this utility, you can monitor the internal state of the eXtreme Scale grid, view diagnostic information, and stop container servers. It also provides a method for parsing and discovering current deployment data, and can be used as a foundation for writing custom utilities.
In this section, we will only cover the basic xsadmin command line options to monitor session data in the grid.
To view the HTTP session statistics in the grid, place data in the grid first. Because we have offloaded session data for our custom portlet to eXtreme Scale, any sessions created in Portal for that portlet will be stored in the grid.
To illustrate how we monitor with xsadmin, we log into Portal Server and load the page containing the custom portlet so that a session is placed in the grid.
| 1. | Locate the xsadmin utility in the WAS_HOME\bin directory. |
| 2. | To display a list of all the grid containers run the following command: |
xsadmin.bat -dmgr -containers
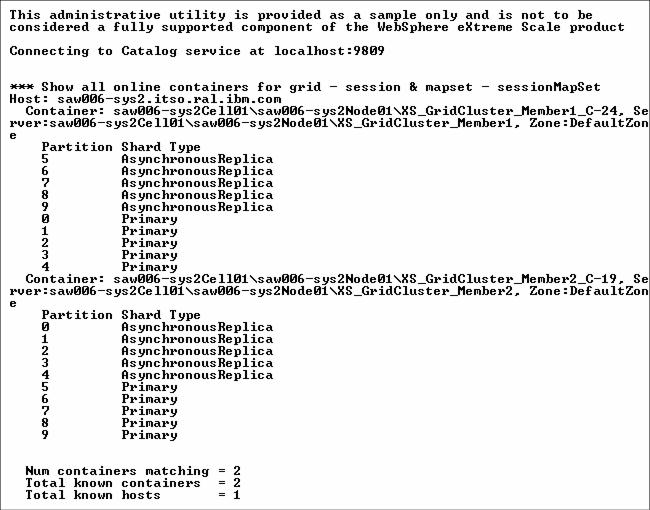
Depending on the grid deployment configuration, we will see a list of containers similar to Figure 5-15.

Figure 5-15 List of containers shown by Xsadmin
|
Tip: The -dmgr option is required when connecting to a catalog server hosted by any WAS process or cluster of processes. Because we have the catalog server hosted in a WAS process for our sample environment, we will use the -dmgr option for all executions of the xsadmin command. |
| 3. | To see the number of entries in all the maps with mapsizes for the grid, run the following command: |
xsadmin.bat -dmgr -g session -mapsizes
Note that session is the objectGridName as specified in the objectGrid.xml and objectGridDeployment.xml files.
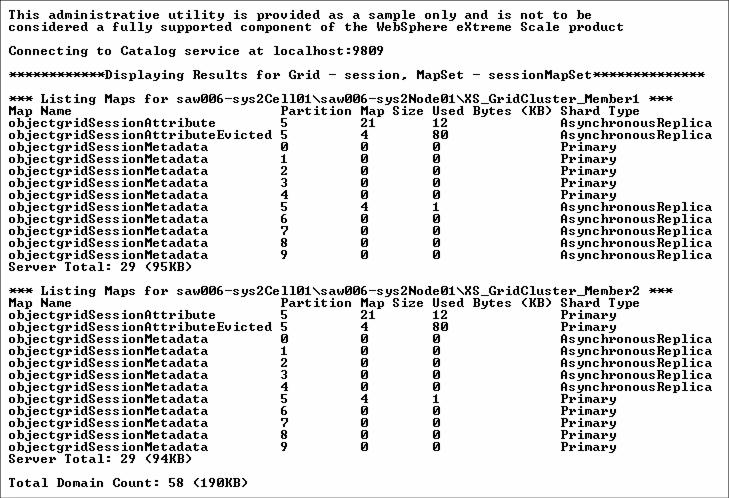
A sample output for this command will look like Figure 5-16.

Figure 5-16 Map entries for a grid shown by xsadmin