5.3.3 IBM J9 JVM internal implementation
The implementation of the IBM J9 Java Virtual Machine is like any other virtual machine for a modern operating system. It consists of a set of executables, a set of native shared objects that provide most of the implementation at runtime, and a set of Java code to map the provided standard Java classes and interfaces to the underlying Java virtual machine code.
Thus, the JVM consists of C/C++ code (most commonly) and Java code that communicates with it. In the JVM Java code, the implementer is faced with a choice of what to implement in Java code and what to implement in C/C++ code. The C/C++ is precompiled, but it carries the risk of misused pointers that can cause a failure. This is the same issue faced by developers who use the Java Native Interface (JNI) to call into C/C++ shared objects from Java, or vice versa.
When implementing an API, a choice is made between having the API as a thin wrapper for a native method implemented in some other language (usually C or C++), or using more elemental Java APIs to build the required functionality. For example, the HTTP functionality implemented by the java.net.URLConnection class can be implemented entirely in Java using the java.net.Socket class, or it can be implemented directly using the underlying host system functionality exposed via a JNI library call.
To produce a JNI-based API, a class must be implemented in Java, an underlying shared object must be implemented using an external language, and this external code calls the operating system APIs, as illustrated in Figure 5-10. Ultimately, the core functionality of the Java socket interface is implemented in the JVM via calls to the host operating system, but there is a variance in where the line is drawn. The tuning of options at the operating system level and the effect they have vary with where this line is drawn.
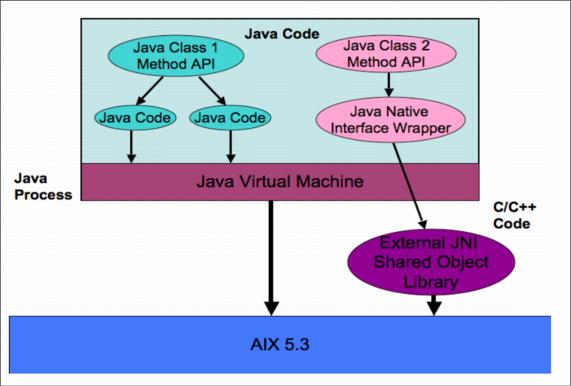
Figure 5-10 JNI and the IBM J9 JVM
In earlier versions of WebSphere Application Server, a great deal of low level external C/C++ code was accessed via JNI and shared objects, most of which was derived from the earlier IBM Component Broker product. Today, most WebSphere Application Server code is pure Java, but that which is not pure Java is informative for understanding how WebSphere Application Server operates on AIX.
Note the distinction here between low level JVM/Java standard library code (which is to be expected for mapping Java sockets, file system, and such code down to the bare operating system calls), and that specific to WebSphere Application Server, which is a Java application.
Using a default installation of WebSphere Application Server, we have a directory of /usr/IBM/WAS/AppServer. Under the java directory, the IBM J9 JVM used by WebSphere Application Server can be found, with a jre/bin directory containing a significant amount of shared objects implementing the JVM functionality itself. Here we find libj9jit23.so for the JIT compilation; libj9gc23.so for the garbage collector; libj9shr23.so for the shared classes feature; and libj9thr23.so for thread management, and libraries containing the code underlying the Java library (including libnet.a for networking support; libnio.a for socket nio; and so on). This is common to all Java applications using this JVM; see Example 5-34.
Example 5-34 Shared objects and libraries listing

# ls -l *.a *.so
-rwxr-xr-x   1 root     system      1968329 06 Oct 2006  libawt.a
-rwxr-xr-x   1 root     system       656910 06 Oct 2006  libcmm.a
-rwxr-xr-x   1 root     system        65145 06 Oct 2006  libdbx_j9.so
-rwxr-xr-x   1 root     system       293731 06 Oct 2006  libdcpr.a
-rwxr-xr-x   1 root     system        29977 06 Oct 2006  libdt_socket.a
-rwxr-xr-x   1 root     system       893132 06 Oct 2006  libfontmanager.a
-rwxr-xr-x   1 root     system       252822 06 Oct 2006  libhprof.a
-rwxr-xr-x   1 root     system       121730 06 Oct 2006  libinstrument.a
-rwxr-xr-x   1 root     system       119209 06 Oct 2006  libiverel23.so
-rwxr-xr-x   1 root     system       132369 06 Oct 2006  libj9bcv23.so
-rwxr-xr-x   1 root     system       527015 06 Oct 2006  libj9dbg23.so
-rwxr-xr-x   1 root     system       213120 06 Oct 2006  libj9dmp23.so
-rwxr-xr-x   1 root     system       224328 06 Oct 2006  libj9dyn23.so
-rwxr-xr-x   1 root     system      1061815 06 Oct 2006  libj9gc23.so
-rwxr-xr-x   1 root     system       144744 06 Oct 2006  libj9gcchk23.so
-rwxr-xr-x   1 root     system        12309 06 Oct 2006  libj9hookable23.so
-rwxr-xr-x   1 root     system      1329718 06 Oct 2006  libj9jextract.so
-rwxr-xr-x   1 root     system      6898716 06 Oct 2006  libj9jit23.so
-rwxr-xr-x   1 root     system       456205 06 Oct 2006  libj9jitd23.so
-rwxr-xr-x   1 root     system       198450 06 Oct 2006  libj9jpi23.so
-rwxr-xr-x   1 root     system       290970 06 Oct 2006  libj9jvmti23.so
-rwxr-xr-x   1 root     system       376447 06 Oct 2006  libj9prt23.so
-rwxr-xr-x   1 root     system        25264 06 Oct 2006  libj9rdbi23.so
-rwxr-xr-x   1 root     system       196690 06 Oct 2006  libj9shr23.so
-rwxr-xr-x   1 root     system        95750 06 Oct 2006  libj9thr23.so
-rwxr-xr-x   1 root     system       113369 06 Oct 2006  libj9trc23.so
-rwxr-xr-x   1 root     system       154247 06 Oct 2006  libj9ute23.so
-rwxr-xr-x   1 root     system      1166348 06 Oct 2006  libj9vm23.so
-rwxr-xr-x   1 root     system       253485 06 Oct 2006  libj9vrb23.so
-rwxr-xr-x   1 root     system        88708 06 Oct 2006  libj9zlib23.so
-rwxr-xr-x   1 root     system         4643 06 Oct 2006  libjaas.a
-rwxr-xr-x   1 root     system       315497 06 Oct 2006  libjava.a
-rwxr-xr-x   1 root     system        31147 06 Oct 2006  libjava_crw_demo.a
-rwxr-xr-x   1 root     system         2750 06 Oct 2006  libjawt.a
-rwxr-xr-x   1 root     system      1250321 06 Oct 2006  libjclscar_23.so
-rwxr-xr-x   1 root     system       378018 06 Oct 2006  libjdwp.a
-rwxr-xr-x   1 root     system       346076 06 Oct 2006  libjjpeg.a
-rwxr-xr-x   1 root     system       178958 06 Oct 2006  libjnichk.so
-rwxr-xr-x   1 root     system       109393 06 Oct 2006  libjpkcs11.so
lrwxrwxrwx   1 root     system           10 06 Oct 2006  libjsig.a -> libjsig.so
-rwxr-xr-x   1 root     system        16925 06 Oct 2006  libjsig.so
-rwxr-xr-x   1 root     system       477446 06 Oct 2006  libjsound.a
-rwxr-xr-x   1 root     system         4407 06 Oct 2006  libmanagement.a
-rwxr-xr-x   1 root     system       179678 06 Oct 2006  libnet.a
-rwxr-xr-x   1 root     system        80491 06 Oct 2006  libnio.a
-rwxr-xr-x   1 root     system         2144 06 Oct 2006  librmi.a
-rwxr-xr-x   1 root     system       114869 06 Oct 2006  libunpack.a
-rwxr-xr-x   1 root     system        12620 06 Oct 2006  libwrappers.a
-rwxr-xr-x   1 root     system       132664 06 Oct 2006  libzip.a

Contrast the list in shown Example 5-34 with the shared objects specific to WebSphere Application Server itself, as shown in Example 5-35. These shared objects can be found, by default, in the /usr/IBM/WAS/AppServer/bin directory.
Example 5-35 Shared objects specific to WebSphere Application Server

# cd /usr/IBM/WAS/AppServer/bin
# ls -l *.so
-rwxr-xr-x   1 root     system         6556 06 Oct 2006  libgetClasses.so
-rwxr-xr-x   1 root     system        48530 06 Oct 2006  libibmaiodbg.so
-rwxr-xr-x   1 root     system        28317 06 Oct 2006  libibmaio.so
-rwxr-xr-x   1 root     system        60175 06 Oct 2006  libNativeFile.so
-rwxr-xr-x   1 root     system        24472 06 Oct 2006  libpmiJvmpiProfiler.so
-rwxr-xr-x   1 root     system        30381 06 Oct 2006  libpmiJvmtiProfiler.so
-rwxr-xr-x   1 root     system        11860 06 Oct 2006  libSelector.so
-rwxr-xr-x   1 root     system        16250 06 Oct 2006  libSystemData.so
-rwxr-xr-x   1 root     system        21720 06 Oct 2006  libUnixRegistryImpl.so
-rwxr-xr-x   1 root     system        68252 06 Oct 2006  libWs60ProcessManagement.so

We will look at these in more detail later, but these implementations are for asynchronous I/O, native security platform security implementation, native platform process management and integration, performance tool integration, and for IIOP/CORBA communications integration. All of these are areas where an appserver implementer might choose for a native implementation to integrate better with the platform, or to achieve performance improvement because of the specific role of the appserver within an enterprise.
To understand more about what is going on under the covers, and to understand how to interpret problems using the IBM Java tools, a JAVADUMP or JAVACORE file can be used. In many ways this is like a Java equivalent of an AIX core file. It contains thread, heap, garbage collection, lock, and stack information.
You can use the administration console or system console to generate a JAVADUMP file from WebSphere Application Server. However, from an AIX command line, you can generate a Java dump file of any running Java process by using kill -QUIT n to send a SIGQUIT signal, where n is the process ID.
The options for JAVADUMP are controlled by the JAVA_DUMP_OPTS environment variable. IBM_JAVACOREDIR controls the location it is written to. For the Java5 JVM used with WebSphere Application Server, the JAVADUMP signal will produce output that is similar to Example 5-36.
Example 5-36 Sample JAVADUMP

NULL
------------------------------------------------------------------------
0SECTION       TITLE subcomponent dump routine
NULL           ===============================
1TISIGINFO     Dump Event "user" (00004000) received
1TIDATETIME    Date:                 2007/12/01 at 14:40:39
1TIFILENAME    Javacore filename:
/usr/IBM/WAS/AppServer/profiles/testwas/javacore.20071201.144039.123064.txt
NULL
------------------------------------------------------------------------
0SECTION       GPINFO subcomponent dump routine
NULL           ================================
2XHOSLEVEL     OS Level         : AIX 5.3
2XHCPUS        Processors -
3XHCPUARCH       Architecture   : ppc64
3XHNUMCPUS       How Many       : 1
NULL
1XHERROR2      Register dump section only produced for SIGSEGV, SIGILL or SIGFPE.
NULL
NULL
------------------------------------------------------------------------
0SECTION       ENVINFO subcomponent dump routine
NULL           =================================
1CIJAVAVERSION J2RE 5.0 IBM J9 2.3 AIX ppc64-64 build j9vmap6423-20060504
1CIVMVERSION   VM build 20060501_06428_BHdSMr
1CIJITVERSION  JIT enabled - 20060428_1800_r8
1CIRUNNINGAS   Running as a standalone JVM
1CICMDLINE     /usr/IBM/WAS/AppServer/java/bin/java -Declipse.security
-Dwas.status.socket=34571 -Dosgi.install.area=/usr/IBM/WAS/AppServer
-Dosgi.configuration.area=/usr/IBM/WAS/AppServer/profiles/testwas/configuration
-Djava.awt.headless=true -Dosgi.framework.extensions=com.ibm.cds
-Xshareclasses:name=webspherev61_%g,groupAccess,nonFatal -Xscmx50M -
...
com.ibm.wsspi.bootstrap.WSPreLauncher -nosplash -application
com.ibm.ws.bootstrap.WSLauncher com.ibm.ws.runtime.WsServer
/usr/IBM/WAS/AppServer/profiles/testwas/config spock44pNode01Cell
spock44pNode02 server1
1CIJAVAHOMEDIR Java Home Dir:   /usr/IBM/WAS/AppServer/java/jre
1CIJAVADLLDIR  Java DLL Dir:    /usr/IBM/WAS/AppServer/java/jre/bin
1CISYSCP       Sys Classpath:
/usr/IBM/WAS/AppServer/java/jre/lib/ext/ibmorb.jar;/usr/IBM/WAS/AppServer
/java/jre/lib/ext/ibmext.jar;/usr/IBM/WAS/AppServer/java/jre/lib/vm.jar;/usr/IB
M/WebSphere/AppServer/java/jre/lib/core.jar;/usr/IBM/WAS/AppServer/java/jre/lib
/charsets.jar;/usr/IBM/WAS/AppServer/java/jre/lib/graphics.jar;/usr/IBM/WebSphe
re/AppServer/java/jre/lib/security.jar;/usr/IBM/WAS/AppServer/java/jre/lib/ibmp
kcs.jar;/usr/IBM/WAS/AppServer/java/jre/lib/ibmorb.jar;/usr/IBM/WAS/AppSe
rver/java/jre/lib/ibmcfw.jar;/usr/IBM/WAS/AppServer/java/jre/lib/ibmorbapi.jar;
/usr/IBM/WAS/AppServer/java/jre/lib/ibmjcefw.jar;/usr/IBM/WAS/AppServer/j
ava/jre/lib/ibmjgssprovider.jar;/usr/IBM/WAS/AppServer/java/jre/lib/ibmjsseprov
ider2.jar;/usr/IBM/WAS/AppServer/java/jre/lib/ibmjaaslm.jar;/usr/IBM/WAS/
AppServer/java/jre/lib/ibmcertpathprovider.jar;/usr/IBM/WAS/AppServer/java/jre/
lib/server.jar;/usr/IBM/WAS/AppServer/java/jre/lib/xml.jar;
1CIUSERARGS    UserArgs:
2CIUSERARG               -Xjcl:jclscar_23
2CIUSERARG
-Dcom.ibm.oti.vm.bootstrap.library.path=/usr/IBM/WAS/AppServer/java/jre/bin
2CIUSERARG
-Dsun.boot.library.path=/usr/IBM/WAS/AppServer/java/jre/bin
2CIUSERARG
-Djava.library.path=/usr/IBM/WAS/AppServer/java/jre/bin:/usr/IBM/WAS/AppS
erver/java/jre/bin/j9vm:/usr/IBM/WAS/AppServer/java/jre/bin:/usr/IBM/WAS/
AppServer/bin::/usr/lib
2CIUSERARG               -Djava.home=/usr/IBM/WAS/AppServer/java/jre
...
Djava.class.path=/usr/IBM/WAS/AppServer/profiles/testwas/properties:/usr/IBM/We
bSphere/AppServer/properties:/usr/IBM/WAS/AppServer/lib/startup.jar:/usr/IBM/We
bSphere/AppServer/lib/bootstrap.jar:/usr/IBM/WAS/AppServer/lib/j2ee.jar:/usr/IB
M/WebSphere/AppServer/lib/lmproxy.jar:/usr/IBM/WAS/AppServer/lib/urlprotocols.j
ar:/usr/IBM/WAS/AppServer/deploytool/itp/batchboot.jar:/usr/IBM/WAS/AppSe
rver/deploytool/itp/batch2.jar:/usr/IBM/WAS/AppServer/java/lib/tools.jar
2CIUSERARG               vfprintf
2CIUSERARG               _port_library 0x09001000A01DAD60
2CIUSERARG               -Xdump
NULL
1CIJVMMI       JVM Monitoring Interface (JVMMI)
NULL           ------------------------
2CIJVMMIOFF    [not available]
NULL
NULL
------------------------------------------------------------------------
0SECTION       MEMINFO subcomponent dump routine
NULL           =================================
1STHEAPFREE    Bytes of Heap Space Free: 247e330
1STHEAPALLOC   Bytes of Heap Space Allocated: 655cc00
NULL
1STSEGTYPE     Internal Memory
NULL           segment          start            alloc            end
type     bytes
1STSEGMENT     00000001104E7870 0000000115AA3450 0000000115AB344C 0000000115AB3450
01000040 10000
...
1STSEGMENT     00000001104E7448 000000011056B810 000000011057B810 000000011057B810
01000040 10000
NULL
1STSEGTYPE     Object Memory
NULL           segment          start            alloc            end
type     bytes
1STSEGMENT     00000001104E7AA8 0700000000000000 070000000655CC00 070000000655CC00
00000009 655cc00
NULL
1STSEGTYPE     Class Memory
NULL           segment          start            alloc            end
type     bytes
1STSEGMENT     00000001160FE678 0000000115E2E890 0000000115E2EB70 0000000115E2EB70
00010040 2e4
...
1STSEGMENT     00000001104E82E8 0700000010000090 07000000130F8C70 07000000131FFFF0
00020104 31fff70
NULL
1STSEGTYPE     JIT Code Cache
NULL           segment          start            alloc            end
type     bytes
1STSEGMENT     000000011051D108 000000011057B9B0 000000011057B9B0 0000000110D7B9B0
00000068 800000
NULL
1STSEGTYPE     JIT Data Cache
NULL           segment          start            alloc            end
type     bytes
1STSEGMENT     000000011056B628 0000000110DB31B0 00000001110804F4 00000001115B31B0
00000048 800000
NULL
1STGCHTYPE     GC History
3STHSTTYPE     14:28:57:601484000 GMT j9mm.53 -   GlobalGC end: workstackoverflow=0
overflowcount=0 weakrefs=17573 soft=2098 phantom=4 finalizers=239 newspace=0/0
oldspace=50488384/106286080 loa=0/0
3STHSTTYPE     14:28:57:601144000 GMT j9mm.61 -   Class unloading end
3STHSTTYPE     14:28:57:593173000 GMT j9mm.66 -   Classloader unload
3STHSTTYPE     14:28:57:592714000 GMT j9mm.66 -   Classloader unload
3STHSTTYPE     14:28:57:592308000 GMT j9mm.60 -   Class unloading start
3STHSTTYPE     14:28:57:592282000 GMT j9mm.57 -   Sweep end
3STHSTTYPE     14:28:57:575557000 GMT j9mm.56 -   Sweep start
3STHSTTYPE     14:28:57:575530000 GMT j9mm.55 -   Mark end
3STHSTTYPE     14:28:57:68626000 GMT j9mm.54 -   Mark start
3STHSTTYPE     14:28:57:68410000 GMT j9mm.52 -   GlobalGC start: weakrefs=17872
soft=2120 phantom=36 finalizers=656 globalcount=34 scavengecount=0
3STHSTTYPE     14:26:01:88564000 GMT j9mm.53 -   GlobalGC end: workstackoverflow=0
overflowcount=0 weakrefs=16865 soft=2021 phantom=4 finalizers=233 newspace=0/0
oldspace=57044640/106286080 loa=0/0
...
3STHSTTYPE     14:20:18:221639000 GMT j9mm.52 -   GlobalGC start: weakrefs=9900
soft=1605 phantom=0 finalizers=151 globalcount=4 scavengecount=0
3STHSTTYPE     14:19:56:798427000 GMT j9mm.53 -   GlobalGC end: workstackoverflow=0
overflowcount=0 weakrefs=8166 soft=1585 phantom=0 finalizers=103 newspace=0/0
oldspace=44678944/52428800 loa=2621440/2621440
NULL
NULL
------------------------------------------------------------------------
0SECTION       LOCKS subcomponent dump routine
NULL           ===============================
NULL
1LKPOOLINFO    Monitor pool info:
2LKPOOLTOTAL     Current total number of monitors: 65
NULL
1LKMONPOOLDUMP Monitor Pool Dump (flat & inflated object-monitors):
2LKMONINUSE      sys_mon_t:0x0000000111CB7BE0 infl_mon_t: 0x0000000111CB7C30:
3LKMONOBJECT
org/eclipse/osgi/framework/eventmgr/EventManager$EventThread@0700000000334740/0700000
000334758: <unowned>
3LKNOTIFYQ            Waiting to be notified:
3LKWAITNOTIFY            "Framework Event Dispatcher" (0x0000000111DAC100)
2LKMONINUSE      sys_mon_t:0x0000000111CB7D90 infl_mon_t: 0x0000000111CB7DE0:
3LKMONOBJECT
org/eclipse/osgi/framework/eventmgr/EventManager$EventThread@0700000000335FD8/0700000
000335FF0: <unowned>
3LKNOTIFYQ            Waiting to be notified:
3LKWAITNOTIFY            "Start Level Event Dispatcher" (0x0000000111D41B00)
...
2LKMONINUSE      sys_mon_t:0x0000000113EE6F40 infl_mon_t: 0x0000000113EE6F90:
3LKMONOBJECT       java/lang/Object@0700000000C9F7E0/0700000000C9F7F8: owner
"server.startup : 0" (0x000000011457EC00), entry count 1
NULL
1LKREGMONDUMP  JVM System Monitor Dump (registered monitors):
2LKREGMON          Thread global lock (0x0000000110012400): <unowned>
2LKREGMON          NLS hash table lock (0x0000000110012490): <unowned>
2LKREGMON          portLibrary_j9sig_sync_monitor lock (0x0000000110012520):
<unowned>
2LKREGMON          portLibrary_j9sig_asynch_reporter_shutdown_monitor lock
(0x00000001100125B0): <unowned>
2LKREGMON          portLibrary_j9sig_async_monitor lock (0x0000000110012640):
<unowned>
2LKREGMON          Hook Interface lock (0x00000001100126D0): <unowned>
2LKREGMON          &(vm->bytecodeTableMutex) lock (0x0000000110012760): <unowned>
2LKREGMON          MM_SublistPool lock (0x00000001100127F0): <unowned>
...
2LKREGMON          MM_GCExtensions::gcStats lock (0x0000000110012D00): <unowned>
2LKREGMON          &vm->verboseStateMutex lock (0x0000000110012D90): <unowned>
2LKREGMON          VM thread list lock (0x0000000110012E20): Flat locked by
"[osthread]" (0x0000000110014D48), entry count 1
2LKREGMON          VM exclusive access lock (0x0000000110012EB0): <unowned>
2LKREGMON          VM Runtime flags Mutex lock (0x0000000110012F40): <unowned>
...
2LKREGMON          VM mem segment list lock (0x0000000110013840): <unowned>
2LKREGMON          FinalizeListManager lock (0x00000001100138D0): <unowned>
2LKREGMON          &(jvmtiData->mutex) lock (0x0000000110013960): <unowned>
2LKREGMON          BCVD verifier lock (0x00000001100139F0): <unowned>
2LKREGMON          Thread public flags mutex lock (0x0000000110013A80): <unowned>
2LKREGMON          &newSem->pfmInfo.sem lock (0x0000000110013B10): <unowned>
...
3LKNOTIFYQ            Waiting to be notified:
3LKWAITNOTIFY            "HAManager.thread.pool : 1" (0x00000001136A8F00)
2LKREGMON          Thread public flags mutex lock (0x000000011204AF60): <unowned>
2LKREGMON          Thread public flags mutex lock (0x000000011204AFF0): <unowned>
2LKREGMON          JVM_RawMonitor lock (0x000000011204B110): <unowned>
...
2LKREGMON          Thread public flags mutex lock (0x0000000115356A50): <unowned>
NULL
NULL
------------------------------------------------------------------------
0SECTION       THREADS subcomponent dump routine
NULL           =================================
NULL
1XMCURTHDINFO  Current Thread Details
NULL           ----------------------
NULL
1XMTHDINFO     All Thread Details
NULL           ------------------
NULL
2XMFULLTHDDUMP Full thread dump J9SE VM (J2RE 5.0 IBM J9 2.3 AIX ppc64-64 build
20060501_06428_BHdSMr, native threads):
3XMTHREADINFO      "P=916005:O=0:CT" (TID:0x00000001104E5500,
sys_thread_t:0x0000000110014868, state:CW, native ID:0x00000000000FB0F9) prio=5
4XESTACKTRACE          at java/lang/Thread.sleep(Native Method)
4XESTACKTRACE          at java/lang/Thread.sleep(Thread.java:923)
4XESTACKTRACE          at com/ibm/ws/runtime/WsServerImpl.main(WsServerImpl.java:479)
4XESTACKTRACE          at com/ibm/ws/runtime/WsServer.main(WsServer.java:59)
4XESTACKTRACE          at sun/reflect/NativeMethodAccessorImpl.invoke0(Native Method)
4XESTACKTRACE          at
sun/reflect/NativeMethodAccessorImpl.invoke(NativeMethodAccessorImpl.java:64)
4XESTACKTRACE          at
sun/reflect/DelegatingMethodAccessorImpl.invoke(DelegatingMethodAccessorImpl.java:43)
4XESTACKTRACE          at java/lang/reflect/Method.invoke(Method.java:615)
4XESTACKTRACE          at
com/ibm/wsspi/bootstrap/WSLauncher.launchMain(WSLauncher.java:183)
4XESTACKTRACE          at com/ibm/wsspi/bootstrap/WSLauncher.main(WSLauncher.java:90)
4XESTACKTRACE          at com/ibm/wsspi/bootstrap/WSLauncher.run(WSLauncher.java:72)
4XESTACKTRACE          at
org/eclipse/core/internal/runtime/PlatformActivator$1.run(PlatformActivator.java:226)
4XESTACKTRACE          at
org/eclipse/core/runtime/adaptor/EclipseStarter.run(EclipseStarter.java:376)
4XESTACKTRACE          at
org/eclipse/core/runtime/adaptor/EclipseStarter.run(EclipseStarter.java:163)
4XESTACKTRACE          at sun/reflect/NativeMethodAccessorImpl.invoke0(Native Method)
4XESTACKTRACE          at
sun/reflect/NativeMethodAccessorImpl.invoke(NativeMethodAccessorImpl.java:64)
4XESTACKTRACE          at
sun/reflect/DelegatingMethodAccessorImpl.invoke(DelegatingMethodAccessorImpl.java:43)
4XESTACKTRACE          at java/lang/reflect/Method.invoke(Method.java:615)
4XESTACKTRACE          at
org/eclipse/core/launcher/Main.invokeFramework(Main.java:334)
4XESTACKTRACE          at org/eclipse/core/launcher/Main.basicRun(Main.java:278)
4XESTACKTRACE          at org/eclipse/core/launcher/Main.run(Main.java:973)
4XESTACKTRACE          at
com/ibm/wsspi/bootstrap/WSPreLauncher.launchEclipse(WSPreLauncher.java:245)
4XESTACKTRACE          at
com/ibm/wsspi/bootstrap/WSPreLauncher.main(WSPreLauncher.java:73)
3XMTHREADINFO      "JIT Compilation Thread" (TID:0x00000001116BC300,
sys_thread_t:0x0000000110015228, state:CW, native ID:0x000000000010C019) prio=11
...
3XMTHREADINFO      "Shared TCPChannel NonBlocking Accept Thread"
(TID:0x0000000115F02C00, sys_thread_t:0x0000000115562648, state:R, native
ID:0x000000000014608D) prio=5
4XESTACKTRACE          at sun/nio/ch/PollArrayWrapper.poll0(Native Method)
4XESTACKTRACE          at sun/nio/ch/PollArrayWrapper.poll(PollArrayWrapper.java:144)
4XESTACKTRACE          at
sun/nio/ch/PollSelectorImpl.doSelect(PollSelectorImpl.java:115)
4XESTACKTRACE          at
sun/nio/ch/SelectorImpl.lockAndDoSelect(SelectorImpl.java:99)
4XESTACKTRACE          at sun/nio/ch/SelectorImpl.select(SelectorImpl.java:110)
4XESTACKTRACE          at
com/ibm/ws/tcp/channel/impl/ChannelSelector.run(ChannelSelector.java:158)
4XESTACKTRACE          at java/lang/Thread.run(Thread.java:797)
NULL
------------------------------------------------------------------------
0SECTION       CLASSES subcomponent dump routine
NULL           =================================
1CLTEXTCLLOS 						Classloader summaries
1CLTEXTCLLSS						2345678:
1=primordial,2=extension,3=shareable,4=middleware,5=system,6=trusted,7=application,8=
delegating
2CLTEXTCLLOADER						p---st-- Loader *System*(0x07000000000094D0)
3CLNMBRLOADEDLIB						Number of loaded libraries 5
3CLNMBRLOADEDCL						Number of loaded classes 3311
2CLTEXTCLLOADER						-x--st-- Loader
sun/misc/Launcher$ExtClassLoader(0x070000000001B220), Parent
*none*(0x0000000000000000)
3CLNMBRLOADEDLIB						Number of loaded libraries 0
3CLNMBRLOADEDCL						Number of loaded classes 85
2CLTEXTCLLOADER						-----ta- Loader
sun/misc/Launcher$AppClassLoader(0x07000000000222D0), Parent
sun/misc/Launcher$ExtClassLoader(0x070000000001B220)
3CLNMBRLOADEDLIB						Number of loaded libraries 0
3CLNMBRLOADEDCL						Number of loaded classes 174
2CLTEXTCLLOADER						-----t-- Loader
org/eclipse/core/launcher/Main$StartupClassLoader(0x070000000006D8E8), Parent
sun/misc/Launcher$AppClassLoader(0x07000000000222D0)
3CLNMBRLOADEDLIB						Number of loaded libraries 0
3CLNMBRLOADEDCL						Number of loaded classes 332
2CLTEXTCLLOADER						-----t-- Loader
org/eclipse/core/runtime/internal/adaptor/ContextFinder(0x0700000000078FE8), Parent
sun/misc/Launcher$AppClassLoader(0x07000000000222D0)
3CLNMBRLOADEDLIB						Number of loaded libraries 0
3CLNMBRLOADEDCL						Number of loaded classes 0
2CLTEXTCLLOADER						-----t-- Loader
org/eclipse/osgi/framework/adaptor/core/CDSBundleClassLoader(0x0700000000336DF8),
Parent sun/misc/Launcher$AppClassLoader(0x07000000000222D0)
3CLNMBRLOADEDLIB						Number of loaded libraries 0
3CLNMBRLOADEDCL						Number of loaded classes 109
2CLTEXTCLLOADER						-----t-- Loader
org/eclipse/osgi/framework/adaptor/core/CDSBundleClassLoader(0x070000000058E650),
Parent sun/misc/Launcher$AppClassLoader(0x07000000000222D0)
3CLNMBRLOADEDLIB						Number of loaded libraries 0
3CLNMBRLOADEDCL						Number of loaded classes 7
2CLTEXTCLLOADER						-----t-- Loader
org/eclipse/osgi/framework/adaptor/core/CDSBundleClassLoader(0x07000000005901E8),
Parent sun/misc/Launcher$AppClassLoader(0x07000000000222D0)
3CLNMBRLOADEDLIB						Number of loaded libraries 0
3CLNMBRLOADEDCL						Number of loaded classes 28
...
1CLTEXTCLLIB   	ClassLoader loaded libraries
2CLTEXTCLLIB  		Loader *System*(0x07000000000094D0)
3CLTEXTLIB   			/usr/IBM/WAS/AppServer/java/jre/bin/java
3CLTEXTLIB   			/usr/IBM/WAS/AppServer/java/jre/bin/jclscar_23
3CLTEXTLIB   			/usr/IBM/WAS/AppServer/java/jre/bin/zip
3CLTEXTLIB   			/usr/IBM/WAS/AppServer/java/jre/bin/net
3CLTEXTLIB   			/usr/IBM/WAS/AppServer/java/jre/bin/nio
2CLTEXTCLLIB  		Loader
org/eclipse/osgi/framework/adaptor/core/CDSBundleClassLoader(0x070000000081F688)
3CLTEXTLIB   			/usr/IBM/WAS/AppServer/bin/Ws60ProcessManagement
3CLTEXTLIB   			/usr/IBM/WAS/AppServer/bin/SystemData
3CLTEXTLIB   			/usr/IBM/WAS/AppServer/bin/getClasses
3CLTEXTLIB   			/usr/IBM/WAS/AppServer/bin/ibmaio
...
2CLTEXTCLLOAD  		Loader
org/eclipse/osgi/framework/adaptor/core/CDSBundleClassLoader(0x07000000010E3E48)
3CLTEXTCLASS   			com/ibm/mqservices/Trace(0x00000001138FE3E8)
3CLTEXTCLASS   			com/ibm/mqservices/CallStackTrace(0x00000001138FF240)
3CLTEXTCLASS   			com/ibm/mq/MQPoolServices(0x00000001138FF4A8)
3CLTEXTCLASS   			com/ibm/mq/MQSimpleConnectionManager$PSAdapter(0x00000001138FF9F8)
3CLTEXTCLASS   			com/ibm/mq/MQEnvironment$1(0x00000001138FFCD8)
3CLTEXTCLASS   			com/ibm/mq/MQPoolServicesEvent(0x00000001138FFF28)
3CLTEXTCLASS   			com/ibm/mq/StoredManagedConnection(0x0000000113863FB0)
3CLTEXTCLASS   			com/ibm/mq/ManagedConnectionStore(0x00000001138647A0)
3CLTEXTCLASS   			com/ibm/mq/PoolScavenger(0x0000000113864CD8)
3CLTEXTCLASS   			com/ibm/mq/MQSimpleConnectionManager(0x000000011379E9F0)
3CLTEXTCLASS   			com/ibm/mq/MQPoolServicesEventListener(0x000000011379F500)
3CLTEXTCLASS   			com/ibm/mq/MQConnectionEventListener(0x000000011379F6B8)
3CLTEXTCLASS   			com/ibm/mq/MQException(0x0000000113861248)
3CLTEXTCLASS   			com/ibm/mq/MQConnectionManager(0x0000000112C72658)
3CLTEXTCLASS   			com/ibm/mq/MQEnvironment(0x000000011379B6E8)
...
2CLTEXTCLLOAD  		Loader sun/reflect/DelegatingClassLoader(0x0700000005F85108)
3CLTEXTCLASS
sun/reflect/GeneratedSerializationConstructorAccessor70(0x0000000115E2E8D0)
NULL
------------------------------------------------------------------------
0SECTION       Javadump End section
NULL           ---------------------- END OF DUMP
-------------------------------------

JAVADUMP creates large files (a significant amount of repeated information has been left out of Example 5-36). However, JAVADUMPs contain helpful pieces of information that promote your understanding of IBM J9 JVM on AIX implementation. Detailed explanations for interpreting a JAVADUMP can be found in the IBM Java Virtual Machine Infocenter documentation:
The first part of the file displays environmental and startup information for the Java part of the process, as shown in Example 5-37. This data tells you the operating system version used, the JVM version, the platform you are running on, and how the JAVADUMP file was generated.
Example 5-37 JAVADUMP: environmental and startup information

NULL
------------------------------------------------------------------------
0SECTION       TITLE subcomponent dump routine
NULL           ===============================
1TISIGINFO     Dump Event "user" (00004000) received
1TIDATETIME    Date:                 2007/12/01 at 14:40:39
1TIFILENAME    Javacore filename:
/usr/IBM/WAS/AppServer/profiles/testwas/javacore.20071201.144039.123064.txt
NULL
------------------------------------------------------------------------
0SECTION       GPINFO subcomponent dump routine
NULL           ================================
2XHOSLEVEL     OS Level         : AIX 5.3
2XHCPUS        Processors -
3XHCPUARCH       Architecture   : ppc64
3XHNUMCPUS       How Many       : 1
NULL
1XHERROR2      Register dump section only produced for SIGSEGV, SIGILL or SIGFPE.
NULL
NULL
------------------------------------------------------------------------
0SECTION       ENVINFO subcomponent dump routine
NULL           =================================
1CIJAVAVERSION J2RE 5.0 IBM J9 2.3 AIX ppc64-64 build j9vmap6423-20060504
1CIVMVERSION   VM build 20060501_06428_BHdSMr
1CIJITVERSION  JIT enabled - 20060428_1800_r8
1CIRUNNINGAS   Running as a standalone JVM

Next, you see the command line and arguments used to start the JVM, as displayed in Example 5-38. This data is useful, particularly with WebSphere Application Server, because the complete environment is often applied by scripts or properties files and this shows what actual values are in use.
Examining the memory, you can see how the JVM works on AIX. You can see the size of the heap and how much of it is being used. Then you can see the AIX 64-bit memory model in use with each of the segments, and what their contents are.
Note the distinction between the heap, the object, the class, and the JIT code cache and JIT data cache memory segments. The JIT code and data segments are used to produce the code that actually runs.
Finally, you can see how the garbage collection is applied and when it is being applied (in this case, with a standard mark and sweep system).
Example 5-38 JAVADUMP: command line and arguments used to start the JVM

0SECTION       MEMINFO subcomponent dump routine
NULL           =================================
1STHEAPFREE    Bytes of Heap Space Free: 247e330
1STHEAPALLOC   Bytes of Heap Space Allocated: 655cc00
NULL
1STSEGTYPE     Internal Memory
NULL           segment          start            alloc            end
type     bytes
1STSEGMENT     00000001104E7870 0000000115AA3450 0000000115AB344C 0000000115AB3450
01000040 10000
1STSEGMENT     0000000111B4B518 0000000115A83410 0000000115A933F4 0000000115A93410
01000040 10000
...
1STSEGMENT     00000001104E7448 000000011056B810 000000011057B810 000000011057B810
01000040 10000
NULL
1STSEGTYPE     Object Memory
NULL           segment          start            alloc            end
type     bytes
1STSEGMENT     00000001104E7AA8 0700000000000000 070000000655CC00 070000000655CC00
00000009 655cc00
NULL
1STSEGTYPE     Class Memory
NULL           segment          start            alloc            end
type     bytes
1STSEGMENT     00000001160FE678 0000000115E2E890 0000000115E2EB70 0000000115E2EB70
00010040 2e4
1STSEGMENT     00000001160FE5E0 00000001161B5470 00000001161B5860 00000001161B6B50
00020040 16e0
...
1STSEGMENT     00000001104E82E8 0700000010000090 07000000130F8C70 07000000131FFFF0
00020104 31fff70
NULL
1STSEGTYPE     JIT Code Cache
NULL           segment          start            alloc            end
type     bytes
1STSEGMENT     000000011051D108 000000011057B9B0 000000011057B9B0 0000000110D7B9B0
00000068 800000
NULL
1STSEGTYPE     JIT Data Cache
NULL           segment          start            alloc            end
type     bytes
1STSEGMENT     000000011056B628 0000000110DB31B0 00000001110804F4 00000001115B31B0
00000048 800000
NULL
1STGCHTYPE     GC History
3STHSTTYPE     14:28:57:601484000 GMT j9mm.53 -   GlobalGC end: workstackoverflow=0
overflowcount=0 weakrefs=17573 soft=2098 phantom=4 finalizers=239 newspace=0/0
oldspace=50488384/106286080 loa=0/0
3STHSTTYPE     14:28:57:601144000 GMT j9mm.61 -   Class unloading end
3STHSTTYPE     14:28:57:593173000 GMT j9mm.66 -   Classloader unload
3STHSTTYPE     14:28:57:592714000 GMT j9mm.66 -   Classloader unload
3STHSTTYPE     14:28:57:592308000 GMT j9mm.60 -   Class unloading start
3STHSTTYPE     14:28:57:592282000 GMT j9mm.57 -   Sweep end
3STHSTTYPE     14:28:57:575557000 GMT j9mm.56 -   Sweep start
3STHSTTYPE     14:28:57:575530000 GMT j9mm.55 -   Mark end
3STHSTTYPE     14:28:57:68626000 GMT j9mm.54 -   Mark start
3STHSTTYPE     14:28:57:68410000 GMT j9mm.52 -   GlobalGC start: weakrefs=17872
soft=2120 phantom=36 finalizers=656 globalcount=34 scavengecount=0
3STHSTTYPE     14:26:01:88564000 GMT j9mm.53 -   GlobalGC end: workstackoverflow=0
overflowcount=0 weakrefs=16865 soft=2021 phantom=4 finalizers=233

Example 5-39 displays the underlying thread synchronization at work and the Java monitors. This is important for identifying when a deadlock has occurred between threads. Note that on a single CPU machine, the internal synchronization is optimized away, although in a virtualized environment the real CPU to virtual CPU mapping means that synchronization code is always present.
In the following data, pay particular attention to the Eclipse/OSGI framework event manager because this is part of the "hidden" infrastructure that underlies WebSphere Application Server.
Also note that there are threads and associated monitors for monitoring ports, strings, JNI code, garbage collection, and native code. However, of particular interest here are the JIT and JVM thread-related monitors.
There are monitors that are used by threads used for profiling and sampling, and others for monitoring JIT queues. This shows the underlying asynchronous model used by the IBM J9 JVM for moving code from its basic byte code format to its "hot" native code implementation by recompiling and reoptimizing it on a background thread and moving it to the native code cache used by the JVM itself.
Example 5-39 JAVADUMP: underlying thread synchronization and Java monitors

NULL
------------------------------------------------------------------------
0SECTION       LOCKS subcomponent dump routine
NULL           ===============================
NULL
1LKPOOLINFO    Monitor pool info:
2LKPOOLTOTAL     Current total number of monitors: 65
NULL
1LKMONPOOLDUMP Monitor Pool Dump (flat & inflated object-monitors):
2LKMONINUSE      sys_mon_t:0x0000000111CB7BE0 infl_mon_t: 0x0000000111CB7C30:
3LKMONOBJECT
org/eclipse/osgi/framework/eventmgr/EventManager$EventThread@0700000000334740/0700000
000334758: <unowned>
3LKNOTIFYQ            Waiting to be notified:
3LKWAITNOTIFY            "Framework Event Dispatcher" (0x0000000111DAC100)
2LKMONINUSE      sys_mon_t:0x0000000111CB7D90 infl_mon_t: 0x0000000111CB7DE0:
3LKMONOBJECT
org/eclipse/osgi/framework/eventmgr/EventManager$EventThread@0700000000335FD8/0700000
000335FF0: <unowned>
3LKNOTIFYQ            Waiting to be notified:
3LKWAITNOTIFY            "Start Level Event Dispatcher" (0x0000000111D41B00)
...
3LKMONOBJECT       java/lang/Object@0700000000C9F7E0/0700000000C9F7F8: owner
"server.startup : 0" (0x000000011457EC00), entry count 1
NULL
1LKREGMONDUMP  JVM System Monitor Dump (registered monitors):
2LKREGMON          Thread global lock (0x0000000110012400): <unowned>
2LKREGMON          NLS hash table lock (0x0000000110012490): <unowned>
2LKREGMON          portLibrary_j9sig_sync_monitor lock (0x0000000110012520):
<unowned>
2LKREGMON          portLibrary_j9sig_asynch_reporter_shutdown_monitor lock
(0x00000001100125B0): <unowned>
2LKREGMON          portLibrary_j9sig_async_monitor lock (0x0000000110012640):
<unowned>
2LKREGMON          Hook Interface lock (0x00000001100126D0): <unowned>
2LKREGMON          &(vm->bytecodeTableMutex) lock (0x0000000110012760): <unowned>
2LKREGMON          MM_SublistPool lock (0x00000001100127F0): <unowned>
2LKREGMON          MM_SublistPool lock (0x0000000110012880): <unowned>
...
2LKREGMON          MM_WorkPackets::inputList lock (0x0000000110012C70): <unowned>
2LKREGMON          MM_GCExtensions::gcStats lock (0x0000000110012D00): <unowned>
2LKREGMON          &vm->verboseStateMutex lock (0x0000000110012D90): <unowned>
2LKREGMON          VM thread list lock (0x0000000110012E20): Flat locked by
"[osthread]" (0x0000000110014D48), entry count 1
2LKREGMON          VM exclusive access lock (0x0000000110012EB0): <unowned>
2LKREGMON          VM Runtime flags Mutex lock (0x0000000110012F40): <unowned>
2LKREGMON          VM Extended method block flags Mutex lock (0x0000000110012FD0):
<unowned>
2LKREGMON          VM bind native lock (0x0000000110013060): <unowned>
2LKREGMON          VM class loader blocks lock (0x00000001100130F0): <unowned>
2LKREGMON          VM class table lock (0x0000000110013180): <unowned>
2LKREGMON          VM string table lock (0x0000000110013210): <unowned>
2LKREGMON          VM segment lock (0x00000001100132A0): <unowned>
2LKREGMON          VM JNI frame lock (0x0000000110013330): <unowned>
...
2LKREGMON          &newSem->pfmInfo.sem lock (0x0000000110013C30): <unowned>
2LKREGMON          JIT-MonitorTableMonitor lock (0x0000000110013CC0): <unowned>
2LKREGMON          JIT-MemoryAllocMonitor lock (0x0000000110013D50): <unowned>
2LKREGMON          JIT-ClassUnloadMonitor lock (0x0000000110013DE0): <unowned>
2LKREGMON          Hook Interface lock (0x0000000110013E70): <unowned>
2LKREGMON          JIT-jitConfig->mutex lock (0x0000000110013F00): <unowned>
2LKREGMON          JIT-AssumptionTableMutex lock (0x0000000110013F90): <unowned>
2LKREGMON          VM mem segment list lock (0x0000000110014020): <unowned>
2LKREGMON          VM mem segment list lock (0x00000001100140B0): <unowned>
2LKREGMON          ActivationTableMutex lock (0x0000000110014140): <unowned>
2LKREGMON          JIT-CompilationQueueMonitor lock (0x00000001100141D0): <unowned>
3LKNOTIFYQ            Waiting to be notified:
3LKWAITNOTIFY            "JIT Compilation Thread" (0x00000001116BC300)
2LKREGMON          JIT-CodeCacheListMutex lock (0x0000000110014260): <unowned>
2LKREGMON          JIT-CodeCacheMonitor-?? lock (0x00000001100142F0): <unowned>
2LKREGMON          Thread public flags mutex lock (0x0000000110014380): <unowned>
2LKREGMON          ValueProfilingMutex lock (0x0000000110014410): <unowned>
...
2LKREGMON          &refreshMutex lock (0x00000001100146E0): <unowned>
2LKREGMON          JIT sampling thread lock (0x0000000110014770): <unowned>
2LKREGMON          management fields lock lock (0x00000001118A4E00): <unowned>
2LKREGMON          &vm->managementData->notificationMonitor lock
(0x00000001118A4E90): <unowned>
2LKREGMON          JIT-InterpreterProfilingMonitor lock (0x00000001118A4F20):
<unowned>
2LKREGMON          JIT-QueueSlotMonitor-0 lock (0x00000001118A4FB0): <unowned>
2LKREGMON          JIT-QueueSlotMonitor-1 lock (0x00000001118A5040): <unowned>
2LKREGMON          JIT-QueueSlotMonitor-2 lock (0x00000001118A50D0): <unowned>
2LKREGMON          JIT-QueueSlotMonitor-3 lock (0x00000001118A5160): <unowned>
2LKREGMON          Thread public flags mutex lock (0x00000001118A51F0): <unowned>
2LKREGMON          JVM_RawMonitor lock (0x00000001118A5280): <unowned>
2LKREGMON          JVM_RawMonitor lock (0x00000001118A5310): <unowned>
2LKREGMON          JVM_RawMonitor lock (0x00000001118A53A0): <unowned>
2LKREGMON          JIT-QueueSlotMonitor-4 lock (0x00000001118A5430): <unowned>
2LKREGMON          JIT-QueueSlotMonitor-5 lock (0x00000001118A54C0): <unowned>

Example 5-40 displays the threads within the JVM and how they are being mapped down to the underlying native platform threads. It also shows the IDs to map to external tool pictures of the thread usage. The relative thread priorities can be useful in identifying thread starvation issues. With each thread, you also have the thread stack information.
Example 5-40 JAVADUMP: thread within the JVM, and mapping to platform threads

1XMTHDINFO     All Thread Details
NULL           ------------------
NULL
2XMFULLTHDDUMP Full thread dump J9SE VM (J2RE 5.0 IBM J9 2.3 AIX ppc64-64 build
20060501_06428_BHdSMr, native threads):
3XMTHREADINFO      "P=916005:O=0:CT" (TID:0x00000001104E5500,
sys_thread_t:0x0000000110014868, state:CW, native ID:0x00000000000FB0F9) prio=5
4XESTACKTRACE          at java/lang/Thread.sleep(Native Method)
4XESTACKTRACE          at java/lang/Thread.sleep(Thread.java:923)
4XESTACKTRACE          at com/ibm/ws/runtime/WsServerImpl.main(WsServerImpl.java:479)
4XESTACKTRACE          at com/ibm/ws/runtime/WsServer.main(WsServer.java:59)
4XESTACKTRACE          at sun/reflect/NativeMethodAccessorImpl.invoke0(Native Method)
4XESTACKTRACE          at
sun/reflect/NativeMethodAccessorImpl.invoke(NativeMethodAccessorImpl.java:64)
4XESTACKTRACE          at
sun/reflect/DelegatingMethodAccessorImpl.invoke(DelegatingMethodAccessorImpl.java:43)
4XESTACKTRACE          at java/lang/reflect/Method.invoke(Method.java:615)
4XESTACKTRACE          at
com/ibm/wsspi/bootstrap/WSLauncher.launchMain(WSLauncher.java:183)
4XESTACKTRACE          at com/ibm/wsspi/bootstrap/WSLauncher.main(WSLauncher.java:90)
4XESTACKTRACE          at com/ibm/wsspi/bootstrap/WSLauncher.run(WSLauncher.java:72)
4XESTACKTRACE          at
org/eclipse/core/internal/runtime/PlatformActivator$1.run(PlatformActivator.java:226)
4XESTACKTRACE          at
org/eclipse/core/runtime/adaptor/EclipseStarter.run(EclipseStarter.java:376)
4XESTACKTRACE          at
org/eclipse/core/runtime/adaptor/EclipseStarter.run(EclipseStarter.java:163)
4XESTACKTRACE          at sun/reflect/NativeMethodAccessorImpl.invoke0(Native Method)
4XESTACKTRACE          at
sun/reflect/NativeMethodAccessorImpl.invoke(NativeMethodAccessorImpl.java:64)
4XESTACKTRACE          at
sun/reflect/DelegatingMethodAccessorImpl.invoke(DelegatingMethodAccessorImpl.java:43)
4XESTACKTRACE          at java/lang/reflect/Method.invoke(Method.java:615)
4XESTACKTRACE          at
org/eclipse/core/launcher/Main.invokeFramework(Main.java:334)
4XESTACKTRACE          at org/eclipse/core/launcher/Main.basicRun(Main.java:278)
4XESTACKTRACE          at org/eclipse/core/launcher/Main.run(Main.java:973)
4XESTACKTRACE          at
com/ibm/wsspi/bootstrap/WSPreLauncher.launchEclipse(WSPreLauncher.java:245)
4XESTACKTRACE          at
com/ibm/wsspi/bootstrap/WSPreLauncher.main(WSPreLauncher.java:73)
3XMTHREADINFO      "JIT Compilation Thread" (TID:0x00000001116BC300,
sys_thread_t:0x0000000110015228, state:CW, native ID:0x000000000010C019) prio=11

Finally, Example 5-41 displays classloader information. Although this is primarily a Java feature, you can observe the IBM shared classes implementation at work with the WebSphere Application Server Eclipse/OSGI implementation by noting what has been loaded by the CDSBundleClassLoader.
Example 5-41 JAVADUMP: classloader information

0SECTION       CLASSES subcomponent dump routine
NULL           =================================
1CLTEXTCLLOS   	Classloader summaries
1CLTEXTCLLSS   		12345678:
1=primordial,2=extension,3=shareable,4=middleware,5=system,6=trusted,7=application,8=
delegating
2CLTEXTCLLOADER		p---st-- Loader *System*(0x07000000000094D0)
3CLNMBRLOADEDLIB		Number of loaded libraries 5
3CLNMBRLOADEDCL			Number of loaded classes 3311
...
1CLTEXTCLLIB   	ClassLoader loaded libraries
2CLTEXTCLLIB  		Loader *System*(0x07000000000094D0)
3CLTEXTLIB   			/usr/IBM/WAS/AppServer/java/jre/bin/java
3CLTEXTLIB   			/usr/IBM/WAS/AppServer/java/jre/bin/jclscar_23
3CLTEXTLIB   			/usr/IBM/WAS/AppServer/java/jre/bin/zip
3CLTEXTLIB   			/usr/IBM/WAS/AppServer/java/jre/bin/net
3CLTEXTLIB   			/usr/IBM/WAS/AppServer/java/jre/bin/nio
2CLTEXTCLLIB  		Loader
org/eclipse/osgi/framework/adaptor/core/CDSBundleClassLoader(0x070000000081F688)
3CLTEXTLIB   			/usr/IBM/WAS/AppServer/bin/Ws60ProcessManagement
3CLTEXTLIB   			/usr/IBM/WAS/AppServer/bin/SystemData
3CLTEXTLIB   			/usr/IBM/WAS/AppServer/bin/getClasses
3CLTEXTLIB   			/usr/IBM/WAS/AppServer/bin/ibmaio
1CLTEXTCLLOD   	ClassLoader loaded classes
2CLTEXTCLLOAD  		Loader *System*(0x07000000000094D0)
3CLTEXTCLASS   			javax/management/remote/rmi/RMIConnectorServer(0x00000001164387C8)
3CLTEXTCLASS   			javax/management/remote/rmi/RMIServer(0x0000000116439AA0)
3CLTEXTCLASS   			javax/management/remote/rmi/RMIServerImpl(0x0000000116439CB8)
3CLTEXTCLASS   			javax/management/remote/rmi/RMIIIOPServerImpl(0x000000011643AB80)
3CLTEXTCLASS   			sun/rmi/server/LoaderHandler$LoaderEntry(0x000000011643AFD0)
3CLTEXTCLASS   			sun/rmi/server/LoaderHandler$LoaderKey(0x000000011643B218)
3CLTEXTCLASS   			sun/rmi/server/LoaderHandler$2(0x000000011643B4B8)
3CLTEXTCLASS   			com/ibm/oti/shared/SharedClassPermissionCollection(0x000000011643B778)
3CLTEXTCLASS   			sun/rmi/server/LoaderHandler$1(0x000000011643BB60)
3CLTEXTCLASS   			javax/management/remote/rmi/_RMIServerImpl_Tie(0x000000011643BED0)
...
2CLTEXTCLLOAD  		Loader
org/eclipse/core/launcher/Main$StartupClassLoader(0x070000000006D8E8)
3CLTEXTCLASS   			org/eclipse/osgi/internal/module/VersionHashMap(0x0000000111F97F00)
3CLTEXTCLASS
org/eclipse/osgi/internal/module/CyclicDependencyHashMap(0x0000000111F98458)
3CLTEXTCLASS   			org/eclipse/osgi/internal/module/GroupingChecker(0x0000000111F98768)
3CLTEXTCLASS   			org/eclipse/osgi/internal/module/ResolverExport(0x0000000111F98E78)
3CLTEXTCLASS   			org/eclipse/osgi/internal/module/ResolverImport(0x0000000111F99498)
3CLTEXTCLASS   			org/eclipse/osgi/internal/module/BundleConstraint(0x0000000111F99C18)
3CLTEXTCLASS   			[Lorg/eclipse/osgi/internal/module/ResolverImport;(0x0000000111F9A200)
3CLTEXTCLASS   			[Lorg/eclipse/osgi/internal/module/ResolverExport;(0x0000000111F9A350)
3CLTEXTCLASS
[Lorg/eclipse/osgi/internal/module/BundleConstraint;(0x0000000111F9A4A0)
3CLTEXTCLASS
[Lorg/eclipse/osgi/internal/module/VersionSupplier;(0x0000000111F9A5F0)
3CLTEXTCLASS   			[Lorg/eclipse/osgi/internal/module/ResolverBundle;(0x0000000111F9A740)
3CLTEXTCLASS   			org/osgi/framework/BundlePermission(0x0000000111F9A8C0)
3CLTEXTCLASS   			org/osgi/framework/BundlePermissionCollection(0x0000000111F9AEF0)
...
3CLTEXTCLASS   			org/osgi/framework/Bundle(0x0000000111B82DD8)
3CLTEXTCLASS
org/eclipse/core/runtime/adaptor/EclipseStarter$InitialBundle(0x0000000111B83200)
3CLTEXTCLASS   			org/eclipse/osgi/framework/log/FrameworkLog(0x0000000111C2EB98)
3CLTEXTCLASS   			org/eclipse/core/runtime/adaptor/EclipseStarter(0x0000000111B68448)
2CLTEXTCLLOAD  		Loader
org/eclipse/core/runtime/internal/adaptor/ContextFinder(0x0700000000078FE8)
2CLTEXTCLLOAD  		Loader
org/eclipse/osgi/framework/adaptor/core/CDSBundleClassLoader(0x0700000000336DF8)
3CLTEXTCLASS
org/eclipse/core/internal/runtime/PlatformURLMetaConnection(0x000000011214E390)
...
3CLTEXTCLASS
sun/reflect/GeneratedSerializationConstructorAccessor70(0x0000000115E2E8D0)
NULL
------------------------------------------------------------------------
0SECTION       Javadump End section
NULL           ---------------------- END OF DUMP
-------------------------------------

Example 5-41 illustrates the mapping between real underlying processors and the virtual CPUs as seen by the operating system image in a virtualized environment. Remember that when the HyperVisor is loaded (always with a POWER5 processor and above), the CPU is always virtualized even if it is to whole CPU values.
The standard configuration for a newer POWER 5 or POWER 6 architecture machine is to run with Symmetric Multi-Threading (SMT) enabled and micropartitioning enabled. With SMT, multiple threads can be run concurrently under many circumstances on a single CPU. With micropartitioning, the CPU can be split into a number of virtual CPUs in portions of 0.1 or 0.01 of the processing power of a real CPU.
The JVM understands these and performs the appropriate optimizations. However, with these choices the processor cache is important because the real processor is split between virtual processors that may be running more than one operating system image concurrently, which incurs a small overhead.
Some applications, such as those running rules engines, are CPU-intensive, so dedicated processor partitions should be used for these. However, for standard Web applications, the overheads are insignificant when overall performance is considered so SMT and micropartitioning should be enabled, with the partitions running uncapped with appropriate entitlements discovered by testing. SMT can get an additional 30 percent performance out of a partition when enabled.
This is discussed here because processor folding optimizations from AIX 5.3 ML03 onward release unused virtual processor cycles back to the HyperVisor, and this can be defeated through misconfiguration and the JVM optimizations can be lost.
For example, adding .1 increments above whole CPU allocations to a partition leads to additional synchronization overheads and the loss of cache locality that counteract any benefit of the extra CPU allocation. (This was also explained earlier in the context of JVM architecture.)