10.5.4 Scenario testing
The scenario was initially configured with the LPAR having just one physical processing unit. In our case, we used the Web SM tool to configure this. Figure 10-16 shows the Web SM add processor resources wizard, and it illustrates the current processing units being set to one. It also shows there were 1.8 processing units available for this LPAR, which we will be adding to this LPAR to increase its processor resources at a later stage.

Figure 10-16 Web SM Add Processor Resources wizard
You can also use the bindprocessor command to show the current processor resources. Figure 10-17 shows the output from the bindprocessor -q command. Processors 0 and 1 represent processor identifiers and are assigned to this LPAR.
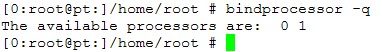
Figure 10-17 The bindprocessor command showing two available processors
After the test passed its ramp-up phase, we began monitoring processor utilization with either topas or lparstat.
The topas command reports selected statistics about the activity on the local system. The program extracts statistics from the system with an interval specified by the monitoring interval in seconds. The output of this command has a cross-partition display. This panel displays metrics similar to the lparstat command for all the AIX partitions it can identify as belonging to the same hardware platform. It actually display more performance metrics than we required.
topas must be restarted if the processing units has changed for an LPAR. It does not recognize changes and will continue to report incorrect performance data.
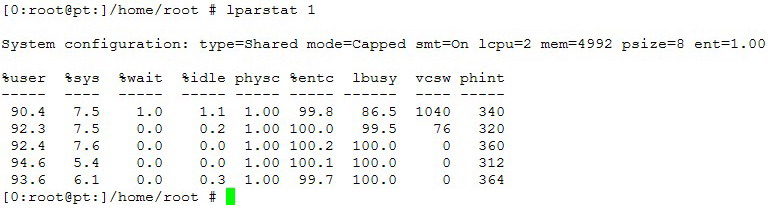
lparstat provides a display of current LPAR-related parameters, as well as utilization statistics for the LPAR. An interval mechanism retrieves numbers of reports at a certain interval. We were only interested in processor capacity, and lparstat is better suited to this task.
lparstat 1 shows the system is constantly under load at around 100%.
The parameter lcpu=2 indicates there are currently two processors assigned to this LPAR. This equates to one processing unit.
After completing the load test, a set of test results were generated, including spreadsheets, charts, and reports for analysis.
Results...
| Average Response Time For All Pages [ms] [for Run] | 66,450.057 |
| Maximum Response Time For All Pages [ms] [for Run] | 273,812 |
| Minimum Response Time For All Pages [ms] [for Run] | 9,625 |
| Percent Page VPs Passed [for Run] | 0 |
| Total Page Attempts [for Run] | 12,730 |
| Total Page Hits [for Run] | 12,180 |
| Total Page VPs Failed [for Run] | 20 |
| Total Page VPs Error [for Run] | 2 |
The metric we were particularly interested in was Average Response Time For All Pages, which showed 66.45 seconds. Also notice there were not many failures, so the test was conducted successfully.
We ran the test again, but with increased processing resource. Figure 10-19 shows the available processing units from Web SM increased from 1 to 2.8, but the virtual processors increased to 4.
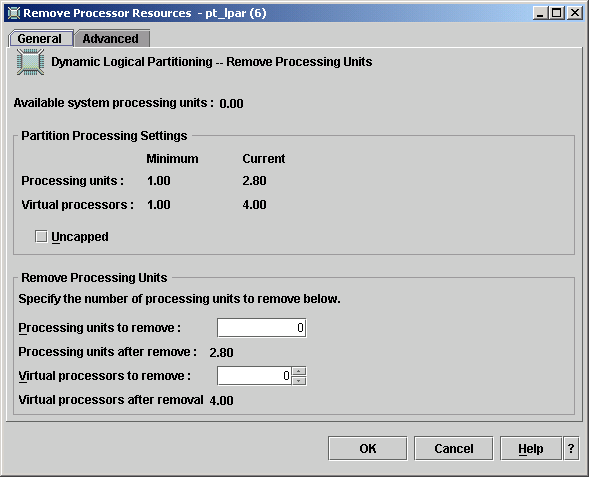
Figure 10-19 Web SM Remove Processor Resources wizard
When the bindprocessor command was invoked it returned eight available processors, as shown in Figure 10-20. This illustrated that 2.8 processing units were being spread across these eight processors.
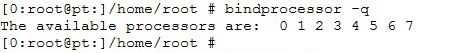
Figure 10-20 The bindprocessor command showing eight available processors
Again, after the load test settled, we were able to monitor processor utilization. Figure 10-21 shows that processor utilization had dropped significantly to around 40%. The lcpu metric now showed eight available processors.
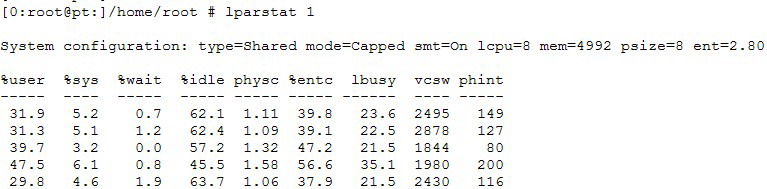
Figure 10-21 lparstat showing CPU utilization for 2.8 processing units
This significant drop in processor utilization resulted in an improved average response time of 53.03 seconds, as shown in Table 10-6. Although the processor utilization dropped more than 50%, we did not see similar improvement with the response time. Obviously, further performance tuning was required. However, we were only interested in demonstrating the effect of dynamically allocating more processor resources to our LPAR and believed we had achieved that.
Table 10-6 Second test - performance summary for Web pages
| Average Response Time For All Pages [ms] [for Run] | 53,034.346 |
| Maximum Response Time For All Pages [ms] [for Run] | 221,766 |
| Minimum Response Time For All Pages [ms] [for Run] | 6,266 |
| Percent Page VPs Passed [for Run] | 0 |
| Total Page Attempts [for Run] | 16,378 |
| Total Page Hits [for Run] | 15,879 |
| Total Page VPs Error [for Run] | 1 |
Figure 10-22 shows a comparison of the page response versus time for the two tests conducted. These charts illustrate that the tests were consistent and repeatable.
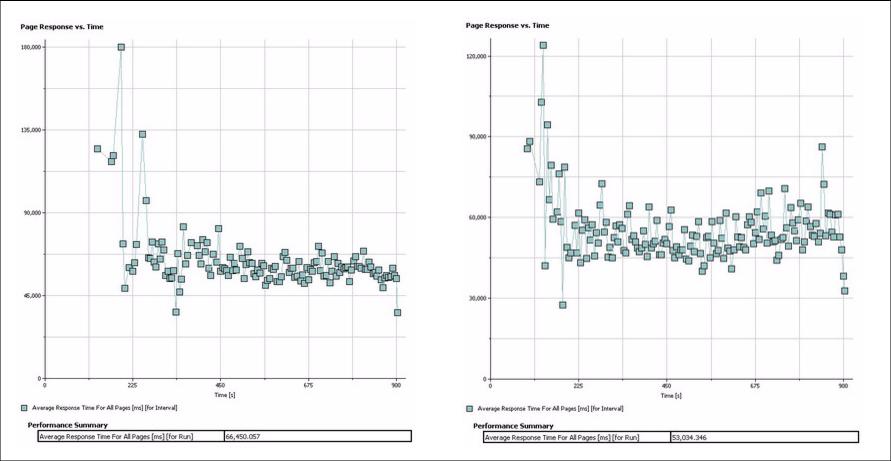
Figure 10-22 Page response time comparison for 1 and 2.8 processing unit tests
Next