|
Reliable Scalable Cluster TechnologyReliable Scalable Cluster Technology (RSCT) plays key role in provisioning for pSeries. You can use some of its functions to make the system more stable. For more information about RSCT and its components, refer to IBM Reliable Scalable Cluster Technology Administration Guide, at the following address: System events generated by the operating system can be monitored by the RSCT Resource Monitoring and Control (RMC) subsystem. For example, you can define an RMC monitor to control the size of the WebSphere filesystem, which is by default /usr/IBM or (if used), the filesystem that holds the WebSphere System and server log files. Under normal operation mode, we consider that this filesystem should never be 100% full. When the size of the filesystem reaches 90%, RMC automatically runs a script that extends the filesystem by the size of one LPAR and creates a notification that can be, for example, an e-mail to the administrator or a monitoring application, as well as an SNMP trap. The basic flow of the monitor creation is as follows:
AIX delivers a comprehensive set of predefined RSCT Events that can be monitored. Use the command lscondition to generate a list of all available conditions. Use the command lsresponse to list the configured responses. Because persistent attributes are generally unchanging, you will usually monitor a dynamic attribute. If none of the dynamic attributes provided by the resource managers contains the value you want to monitor, you can create a sensor that includes a command to be run by RMC to retrieve the value you want to monitor.
Resource Monitoring and Control subsystemThe Resource Monitoring and Control (RMC) subsystem monitors and queries system resources. The RMC daemon manages an RMC session and recovers from communications problems. The RMC subsystem is used by its clients to monitor the state of system resources and to send commands to resource managers. The RMC subsystem acts as a broker between the client processes that use it and the resource manager processes that control resources. A resource manager is a standalone daemon that maps resource and resource class abstractions into calls and commands for one or more specific types of resources. A resource manager contains definitions of all resource classes that the resource manager supports. A resource class definition includes a description of all attributes, actions, and other characteristics of a resource class. These resource classes are accessible and their attributes can be manipulated through IBM Web-based System Manager or through the command line.
Basic configuration of RSCT/RMCRSCT can be configured through the WebSM-based interface or command line interface. Figure 3-33 shows the condition available on node br.itsc.austin.ibm.com, which we opened using the CSM WebSM Cluster Interface.
Figure 3-33 RSCT Monitoring conditions for node br.itsc.austin.ibm.com If you intend to use RSCT monitoring on a cluster level, you can use Distributed Monitoring Access as shown in Figure 3-34.
Figure 3-34 RSCT monitoring conditions for the cluster Events triggered by one of monitors can be checked through WebSM CSM cluster access, as shown in Figure 3-35. However, there are also other options available to manage events.
Figure 3-35 RSCT Monitoring Events for the cluster
Locked conditions and responsesThe following Event Response Resource Manager (ERRM) conditions, responses, and associations are locked and are not intended to be changed. However, you can unlock these resources if changing them is absolutely necessary. Locked conditions:
Locked responses:
Locked associations (condition-response pairs):
Setting up an efficient monitoring systemFollowing these steps will help you to set up an efficient monitoring system:
Use them as they are, customize them to fit your configurations, or use them as templates to create your own.
Customize them to suit your environment and your working schedule. For example, the predefined response Critical notifications is predefined with three actions:
You may modify the response, for example, to log events to a different file when events occur; e-mail you during non-working hours, and add a new action to page you only during working hours. With such a setup, different notification mechanisms can be automatically switched, based on your working schedule.
For example, you can customize the three severity responses (Critical notifications; Warning notifications; and Informational notifications) to take actions in response to events of different severities, and associate the responses to the conditions of respective severities. With only three notification responses, you can be notified of all events with respective notification mechanisms based on their urgencies.
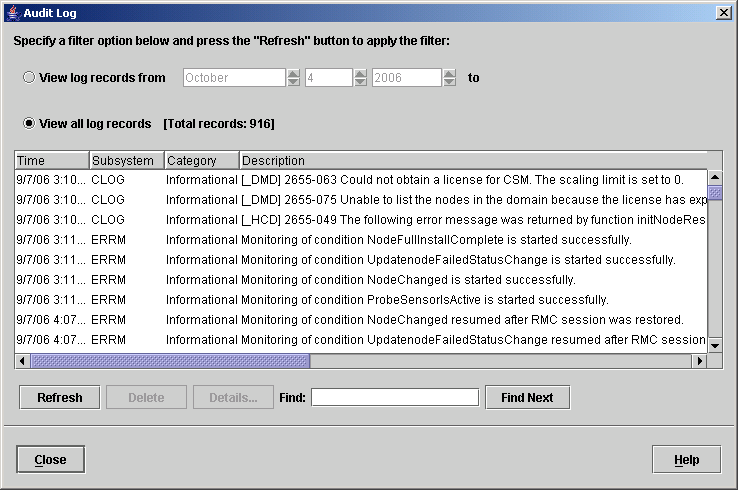
To determine the system status, you may bring up a Web-based System Manager session and view the Events plug-in, or simply use the lsaudrec command from the command line interface to view the audit log, as shown in Example 3-27. Example 3-27 Sample output of command lsaudrec [0:root@MADRID:]/home/root # lsaudrec 10/03/06 16:06:20 ERRM Error Error detected during monitoring for ProbeSensorIsActive on guadalupe.itsc.austin.ibm.com. 10/03/06 16:08:08 ERRM Info Monitoring of condition ProbeSensorIsActive resumed after the Resource Manager recovered from a failure on guadalupe.itsc.austin.ibm.com. The same information can be retrieved using WebSM CSM access, as shown in Figure 3-36.
Figure 3-36 Output of Audit Log from WebSM for the cluster
Setting up monitoring for the WebSphere filesystemIn general we need to perform the following steps to set up an RSCT Monitor:
In this section, we use these steps to demonstrate how to define an RMC monitor to control the size of the WebSphere filesystem. In our case, we assumed that the default filesystem /usr/IBM was used on the installation. We wanted to check the size of the filesystem with a threshold set to 90% filling ratio.
We issued the command mkcondition to create the /usr/IBM space used condition: mkcondition -r "IBM.FileSystem" -e "PercentTotUsed > 90" -d "/usr/IBM 90% full" -s "Name == \"/usr/IBM\"" -S c "/usr/IBM space used" We checked the condition and status by using the lscondition command; Example 3-28 displays the output. Example 3-28 lscondition output for mkcondition #lscondition -a |grep "/usr/IBM" "/usr/IBM space used" "Not monitored" #lscondition "/usr/IBM space used" Displaying condition information:
condition 1: Name = "/usr/IBM space used" MonitorStatus = "Not monitored" ResourceClass = "IBM.FileSystem" EventExpression = "PercentTotUsed > 90" EventDescription = "/usr/IBM 90% full" RearmExpression = "" RearmDescription = "" SelectionString = "Name == \"/usr/IBM\"" Severity = "c" NodeNames = {}
MgtScope = "l" #
We used the mkresponse command to create the response with name "/usr/IBM Filesystem full" that has an action named "E-mail root": mkresponse -n "E-mail root" -s "/usr/sbin/rsct/bin/notifyevent root" -e b "/usr/IBM Filesystem full" We checked the condition and status by using the lsresponse command. Example 3-29 displays the output. Example 3-29 lsresponse output for mkresponse #lsresponse -a Displaying response information: ResponseName "/usr/IBM Filesystem full" #lsresponse "/usr/IBM Filesystem full" Displaying response information:
ResponseName = "/usr/IBM Filesystem full" Action = "E-mail root" DaysOfWeek = 1-7 TimeOfDay = 0000-2400 ActionScript = "/usr/sbin/rsct/bin/notifyevent root" ReturnCode = 0 CheckReturnCode = "n" EventType = "b" StandardOut = "n" EnvironmentVars = "" UndefRes = "n"
We issued the mkcondresp command to link the condition and the response: mkcondresp "/usr/IBM space used" "/usr/IBM Filesystem full" We checked the condition and status by using the lscondresp command. Example 3-30 displays the output. Example 3-30 lscondresp output for mkcondresp #lscondresp Displaying condition with response information: Condition Response State "/usr/IBM space used" "/usr/IBM Filesystem full" "Not active" #lscondresp "/usr/IBM space used" "/usr/IBM Filesystem full" Displaying condition with response information:
condition-response link 1: Condition = "/usr/IBM space used" Response = "/usr/IBM Filesystem full" State = "Not active"
We started monitoring by issuing the startcondresp command: startcondresp "/usr/IBM space used" "/usr/IBM Filesystem full" We verified that the monitor was operational by using the lscondresp command. Example 3-31 displays the output. Example 3-31 lscondresp output for startcondresp #lscondresp Displaying condition with response information: Condition Response State "/usr/IBM space used" "/usr/IBM Filesystem full" "Active" lscondresp "/usr/IBM space used" "/usr/IBM Filesystem full" Displaying condition with response information:
condition-response link 1: Condition = "/usr/IBM space used" Response = "/usr/IBM Filesystem full" State = "Active" In addition, the status of the condition named "/usr/IBM space used" changed from "Not monitored" to "Monitored"; you can verify this by using the lscondition command. The same information can be retrieved using the WebSM CSM access, as shown in Figure 3-37. In addition, you can see that the value for Management Scope is Local Machine. You can create conditions for which the Management Scope is Domain. These conditions will then be applied to the whole domain. Figure 3-37 RMC Condition Status for Node
After the condition threshold was reached as defined, the action was triggered and an e-mail was initiated to the defined user; see Example 3-32. Example 3-32 Sample RCST e-mail for /usr/IBM space used [0:root@uk:]/usr/IBM # mail Mail [5.2 UCB] [AIX 5.X] Type ? for help. "/var/spool/mail/root": 2 messages 2 new >N 1 root Wed Oct 4 17:09 28/723 "/usr/IBM space used" essage 1: From root Wed Oct 4 17:09:31 2006 Date: Wed, 4 Oct 2006 17:09:31 -0500 From: root To: root Subject: /usr/IBM space used
=====================================
Wednesday 10/04/06 17:09:30
Condition Name: /usr/IBM space used Severity: Critical Event Type: Event Expression: PercentTotUsed > 90
Resource Name: /usr/IBM Resource Class: IBM.FileSystem Data Type: CT_INT32 Data Value: 96 Node Name: uk.itsc.austin.ibm.com Node NameList: {uk.itsc.austin.ibm.com}
Resource Type: 0 ===================================== Also note that, as displayed in Figure 3-38, an entry in the RCST Event log was written until the problem was resolved.
Figure 3-38 Sample RCST d-mail for /usr/IBM space used
Setting up more complex monitoring for WebSphere Application ServerYou may want to set up a more complex scenario (for example, to check whether a WebSphere Application Server is still alive by using a scheduled "ping" to the server itself). The following example uses the ApacheBench (AB) simple tool for quickly generating HTTP GET and POST requests. It is part of the Apache HTTP Server and the IBM HTTP Server powered by Apache. It is automatically installed with IBM HTTP server and the executable can be found in <IHS_HOME>\bin\ab. As a very simple example, we use the PingJSP command, delivered with Trade 61, to perform the keep alive ping. Note that most of the basic steps involved are as described in Setting up monitoring for the WebSphere filesystem. However, for this example we need to introduce a sensor because we do not monitor a standard AIX resource like a filesystem.
In this section, we use these steps to demonstrate how to define an RMC monitor to control a WebSphere Application by using a scheduled command to access the HTTP site.
For our example, we created a sample Korn shell script to execute the AB and return the exit code, which should be zero (0) if successful. The file named PingTrade.ksh has been made available to all systems in the /exports/systemfiles/startup directory. Example 3-33 displays this script. Example 3-33 Sample PingTrade.ksh script #!/bin/ksh HOSTTOPING=pl.itsc.austin.ibm.com # /usr/IBM/HTTPServer/bin/ab -S -d -c 5 -n 5 "http://${HOSTTOPING}:9080/trade/PingJsp.jsp" 1>/dev/null 2>/dev/null
RC=$? #Should be zero in case connection was successful echo "Int32=${RC}"
The following sensor attributes can be set by sensor_command: Float32, Float64, Int32,Int64, Quantum, String, Uint32, Uint64. We decided to use the attribute Int32. The returned variable Int32 will be used later to create the conditional evaluation during monitor execution.
We issued the mksensor command to create a sensor named PingTrade with the Korn shell script as the sensor resource: mksensor PingTrade /exports/systemfiles/startup/PingTrade.ksh We checked the sensor and status by using the lssensor command. Example 3-34 displays the output. Example 3-34 Output of lssensor for mksensor #lssensor PingTrade ProbeSensor ErrorLogSensor #lssensor PingTrade Name = PingTrade ActivePeerDomain = Command = /exports/systemfiles/startup/PingTrade.ksh ConfigChanged = 0 ControlFlags = 0 Description = ErrorExitValue = 1 ExitValue = 0 Float32 = 0 Float64 = 0 Int32 = 0 Int64 = 0 NodeNameList = {uk.itsc.austin.ibm.com}
RefreshInterval = 60 SD = [,0,0,0,0,0,0] SavedData = String = Uint32 = 0 Uint64 = 0 UserName = root
We issued the following command to create the "/PTNode Trade alive" condition: mkcondition -r IBM.Sensor -e "Int32 != 0" -d "Trade keep alive Ping" "PTNode Trade alive" The response condition is set to fire if the value for Int32 is not equal to zero (0). We checked the condition and status by using the lscondition command. Example 3-35 displays the output. Example 3-35 lscondition output for mkcondition on sensor #lscondition "PTNode Trade alive" Displaying condition information:
condition 1: Name = "PTNode Trade alive" MonitorStatus = "Not monitored" ResourceClass = "IBM.Sensor" EventExpression = "Int32 != 0" EventDescription = "Trade keep alive Ping" RearmExpression = "" RearmDescription = "" SelectionString = "" Severity = "i" NodeNames = {}
MgtScope = "l" #lscondition -a |grep "PTNode" "PTNode Trade alive" "Not monitored"
We used the mkresponse command to create the response "PTNode Trade alive" that has an action named "E-mail root" associated with it: mkresponse -n "E-mail root" -s "/usr/sbin/rsct/bin/notifyevent root" -e b "PTNode Trade alive"
We issued the mkcondresp command to link the condition and the response: mkcondresp "PTNode Trade alive" "PTNode Trade alive"
We started monitoring by issuing the startcondresp command: startcondresp "PTNode Trade alive" "PTNode Trade alive" We verified that the monitor was operational by using the lsaudrec command. Example 3-36 shows that monitoring of the condition has been started. Example 3-36 Check execution using command lsaudrec for sensor # lsaudrec 10/05/06 16:55:40 ERRM Info Monitoring of condition PTNode Trade alive is started successfully.
After the condition was met, an e-mail was initiated to the defined user (as shown in Example 3-32). An entry in the RCST Event log (as shown in Figure 3-38) was written until the problem was resolved. In addition, you can check the Current Attribute Settings of the sensor by using the lssensor command, as shown in Figure 3-37. Example 3-37 Changed status of sensor after triggered event #lssensor PingTrade Name = PingTrade ActivePeerDomain = Command = /exports/systemfiles/startup/PingTrade.ksh ConfigChanged = 0 ControlFlags = 0 Description = ErrorExitValue = 1 ExitValue = 0 Float32 = 0 Float64 = 0 Int32 = 79 Int64 = 0 NodeNameList = {uk.itsc.austin.ibm.com}
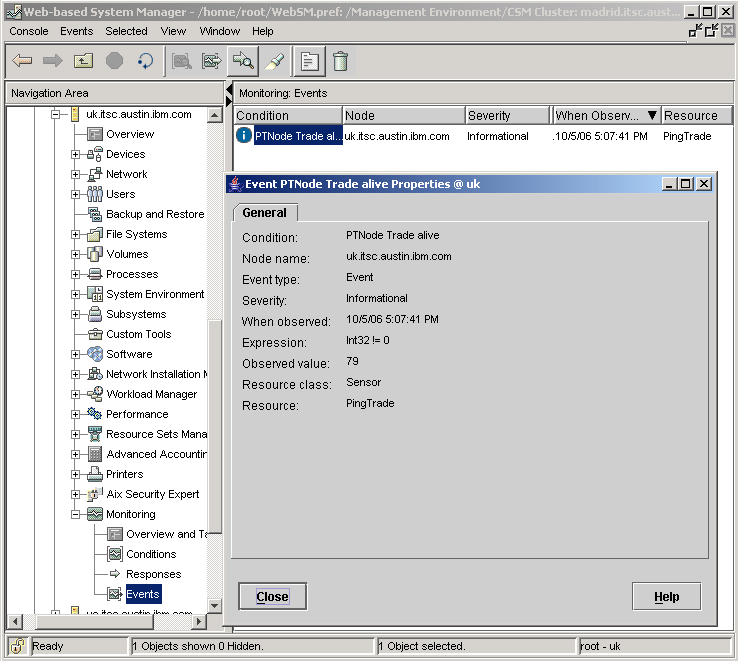
RefreshInterval = 60 The value for the Sensor Environment Variable Int32 was now set to 79, based on the return code of the Ping shell script. The Response Condition was set to fire if the value for Int32 was not equal to zero (0). Subsequently, the Response Event was triggered and recorded as shown in Figure 3-39. A more complex implementation would be to add more steps to the response which perform more realistic operations on the node, rather than having a simple e-mail action triggered.
Figure 3-39 WebCSM Event View for PingTrade
Summary of CSM/RSCT monitoring possibilitiesAs shown, CSM RCT monitoring can be used to define conditions to monitor in the cell and responses to execute when the condition is true. This is especially significant when considering the capability to change LPAR resources using event-triggered scripts. Note the following considerations when monitoring in a CSM cell:
A monitor can be created to archive any system, WebSphere, or user-defined application log files from each appserver node to the management server when they reach a certain size. This effectively creates a ring log system.
If an application makes heavy use of a file system, or if you want to protect against core dumps consuming disk space, you can create a monitor to clean up the file system when it reaches a certain utilization threshold.
You can create a monitor that uses the command dping. The dping command pings the specified servers. This command can be used to retrieve node status before CSM is fully installed, or when you suspect a problem with RMC and its heartbeating.
You can create monitors to monitor the status of critical processes in the cell. Conditions such as a process terminating or using extraneous memory can be remedied with a preconfigured response.
Many business applications require logging for audit purposes. The CSM audit log can be used by a user-defined business application as a centralized logging facility. Because it is designed to be efficient and is available on all CSM-managed appserver nodes in the cell, it is a powerful alternative to custom application log development.
The CSM monitoring infrastructure can be used as an event framework for deployed applications in the cell. Conditions can be defined that, when true, will execute a change request:
For example, consider these possibilities:
After the threshold is reached, it would trigger a script that would initiate a dynamic LPAR change request to the HMC to add more memory to the LPAR.
After the threshold is reached it would trigger a script that would initiate a dynamic LPAR change request to the HMC to add more processor capacity to the LPAR.
After the threshold is reached, it would trigger a script that would initiate a dynamic LPAR change request to the HMC to remove processor capacity from the LPAR. These are only high level examples to demonstrate the power of RSCT monitoring and dynamic LPAR operation. |