Server Debugging
Debugging a Tivoli Directory Integrator server means that every AssemblyLine started on a Tivoli Directory Integrator server will automatically establish a debug session with the Configuration Editor as if it were started in step mode.
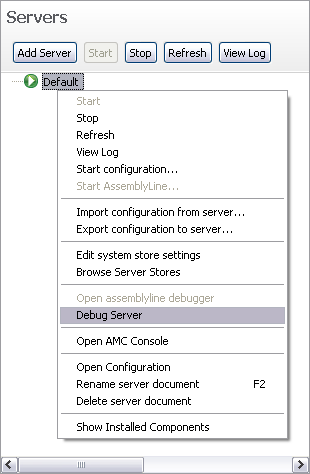
Server debugging is activated by selecting Debug Server from the drop-down menu on a server in the Servers view. When us choose this option, the CE will connect to the server and set a Java property pointing to the CE for debugging.
Debug Server option

Selecting Debug Server brings up a new window where the AssemblyLines appear as they are started on the server. This is different from actively starting an AssemblyLine in the CE. When starting a debug session from the CE, it will have its own window and will not appear in this server debug window.

Each AssemblyLine started by another CE or component on the targeted server will have its own stepper panel inside this window. See section The stepper and debugger for a description of the stepper panel.
Parent topic: Run and debug AssemblyLines