IBM BPM, V8.0.1, All platforms > Authoring services in Integration Designer > Services and service-related functions > Access external services with adapters > Configure and using adapters > IBM WebSphere Adapters > Enterprise Content Management > Administer the adapter module > Monitoring performance
Viewing performance statistics
You can view adapter performance data through the graphical monitoring tool, Tivoli Performance Viewer. Tivoli Performance Viewer is integrated with the Process Administrative Console in IBM BPM or WebSphere Enterprise Service Bus.
Configure Performance Monitoring Infrastructure for your adapter.
Procedure
- In the administrative console, expand Monitoring and Tuning, expand Performance Viewer, then select Current Activity.
- In the list of servers, click the name of your server.
- Under your server name, expand Performance Modules.
- Click WBIStatsRootGroup.
- Click ResourceAdapter and the name of your adapter module.
- If there is more than one process, select the check boxes for the processes whose statistics you want to view.
Results
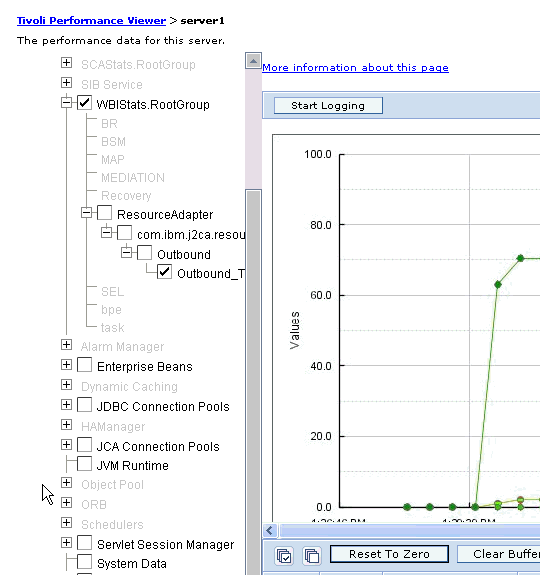
The statistics are displayed in the right panel. You can click View Graph to view a graph of the data, or View Table to see the statistics in a table format.The following figure shows adapter performance statistics.
Figure 1. Adapter performance statistics, using graph view

Monitoring performance using Performance Monitoring Infrastructure
Previous topic: Configure Performance Monitoring Infrastructure