IBM BPM, V8.0.1, All platforms > Authoring services in Integration Designer > Developing monitor models > Create monitor models > Defining monitor details models > Generate a global monitoring context > Generate a global monitoring context when no common source metric exists
Example of a global monitoring context
Suppose that you are monitoring a number of processes that are part of an overall loan processing scenario. Each process is from a different source (for example, an IBM BPM application or a WebSphere Message Broker flow). Each step in the process has an associated monitoring context, and you can view the metrics for each monitoring context in separate widgets on the dashboard. But you might find it more valuable to group these disparate processes into one global monitoring context so that you can view all metrics of the overall loan processing scenario in a single dashboard widget.
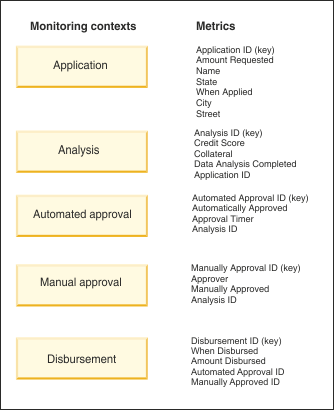
The loan processing scenario consists of five disparate processes. Each of these processes has a monitoring context and a set of metrics associated with it, as shown in Figure 1. These processes are monitored separately, but you now want to group them so that you can see the end-to-end flow of loan processing.
Figure 1. The five monitoring contexts and associated metrics that are part of the loan processing scenario
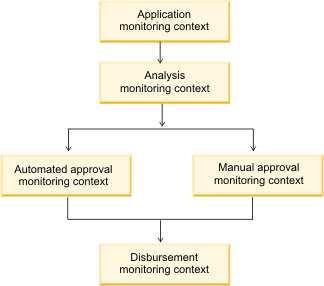
As shown in Figure 2, the loan processing begins with the application process. The next step is analysis, which leads to an automated approval or a manual approval. The final step is disbursement.
Figure 2. The processes, from various sources, that make up the Loan Processing example
To be able to monitor the entire loan processing scenario, you use the Global Monitoring Context wizard to create a global monitoring context. The existing monitoring contexts ( Application, Analysis, Automated Approval, Manual Approval, and Disbursement) are used as the source for building the global monitoring context.
Creating the Loan Processing global monitoring context
This section provides an overview of the Global Monitoring Context wizard and shows how you would create the Loan Processing global monitoring context.
- Create a global monitoring context
The first step in generating the global monitoring context is to name the context. In this example, the name is Loan Processing.
You then indicate whether you want instances of the individual monitoring contexts ( Application, Analysis, Automated Approval, Manual Approval, and Disbursement) to be displayed on the dashboard. You can choose to hide instances of the individual monitoring contexts and, instead, view metrics for instances of the Global Monitoring Context only. In this example, metrics for Loan Processing will be displayed on the dashboard, but metrics for the individual monitoring contexts that make up Loan Processing will not be displayed.
- Map monitoring contexts to milestones
After you name the global monitoring context, you create milestones and indicate which monitoring contexts are associated with each milestone.
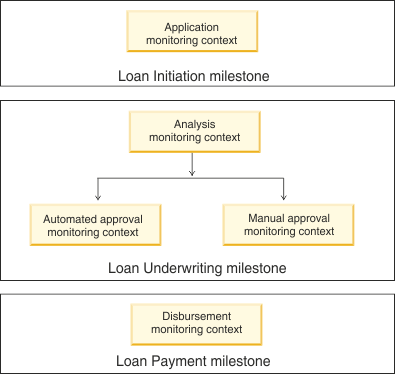
In the loan application example, three milestones are set up to further group the source monitoring contexts, as shown in Figure 3:
Figure 3. The three milestones of the Loan Processing global monitoring context
When you create milestones, you also provide targets for the Average Elapsed Time and Count key performance indicators (KPIs). Average Elapsed Time measures how long, on average, instances spend at a milestone, and Count measures the number of instances that are at the milestone at a specific time. The KPI is increased when an instance enters the specific milestone and decreased when an instance exits the specific milestone. If the average time or count is higher than these target values, the milestone is highlighted on the dashboard so that it can be analyzed. Default values are provided.
- Map Metrics in Monitoring Contexts for Correlation
Because the monitoring contexts in this scenario do not contain a common metric, you must provide a way to link the monitoring contexts. To do so, you select one metric from each monitoring context to link it to the next monitoring context, creating a chain of monitoring contexts.
For each pair in the chain, you select the first monitoring context, which is known as the source monitoring context. In this example, the Application monitoring context is the first step in the Loan Processing scenario. You select one of the metrics from this monitoring context, which is used by the Global Monitoring Context wizard to link the source monitoring context to the second, or target, monitoring context. You also select the metric to be used to map the two monitoring contexts.
In the example, you select the Application monitoring context as the source monitoring context. The first time you select a source monitoring context, the key metric associated with the monitoring context is selected, by default, as the source metric. As shown in Figure 1, Application ID is the key metric for the Application monitoring context, and it is selected, by default, as the source metric.
You then select Analysis as the target monitoring context. By default, its key metric, Analysis ID, is selected as the target metric.
Both monitoring contexts have a metric named Application ID, which is used to identify the loan application. You use this metric to map the source and target monitoring contexts.
Figure 4. The first pair of source and target monitoring contexts
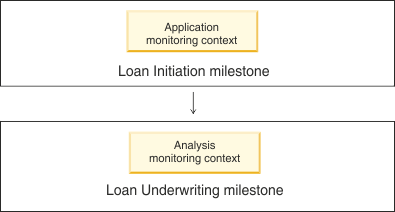
After you establish the first pair of source and target monitoring contexts, the Mapped Source and Target Metrics table is populated with the choices:
Mapped Source and Target Metrics table after the first set of monitoring contexts is specified Source Context Source Metric Target Context Target Metric Mapping Key Application Application ID Analysis Analysis ID Application ID Because the two monitoring contexts you mapped are in different milestones, the linking between milestones is also established, as shown in the Mapped Milestones table:
Mapped Milestones table after the first set of monitoring contexts is specified From To Mapping Type Loan Initiation Loan Underwriting One to One The Mapping Type column indicates how instances of the From milestone flow to instances of the To milestone. The choices are One to One, One to Many, or Many to One. In this example, one instance of the Loan Initiation milestone flows to one instance of the Loan Underwriting milestone.
You continue to map the monitoring contexts. The target monitoring context from the first pair (Analysis) becomes the source monitoring context for the next pair.
Figure 5. The second pair of source and target monitoring contexts
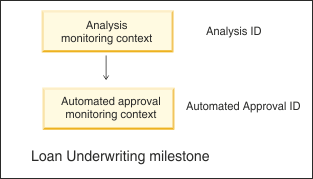
Mapped Source and Target Metrics table after the second set of monitoring contexts is specified Source Context Source Metric Target Context Target Metric Mapping Key Application Application ID Analysis Analysis ID Application ID Analysis Analysis ID Automated Approval Automated Approval ID Analysis ID Because both the source and target monitoring context are in the same milestone, the Mapped Milestones table is not updated.
You continue linking source and target monitoring contexts until the entire Loan Processing scenario is mapped.
Tip: A monitoring context that starts a milestone ( Disbursement, for example) cannot have a metric mapping in which the calling monitoring context (for example, Automatic Approval) is in the same milestone. Similarly, a monitoring context that ends a milestone ( Automatic Approval, for example) cannot call another monitoring context in the same milestone.
In the case in which two possible paths exist ( Automatic Approval to Disbursement or Manual Approval to Disbursement), the milestone is considered completed when either of the paths is completed.
Before you complete the mapping, you can preview the milestone mapping. For this example, the preview is shown in Figure 6:
Figure 6. Preview of milestone mapping

- Add Metrics
The final step in the global monitoring context generation is to specify one or more metrics to be displayed on the dashboard. The metrics associated with each of the monitoring contexts are displayed.
For example, you might want to show all metrics from the Application monitoring context ( Application ID, Name, Amount Requested, and so on) but only the Credit Score metric from the Analysis monitoring context.
Viewing the Loan Processing global monitoring context
After you complete the wizard, you can view the new global monitoring context, Loan Processing, in the Monitor Model editor. You see all the source monitoring contexts and other elements of the global monitoring context, and you can author reports for the global monitoring context.
Viewing the generated dashboards for the Loan Processing global monitoring context
The Loan Processing Instances tab of the generated dashboard displays the metrics that were promoted to the global monitoring context. As you click an instance of the monitoring context, a diagram for that instance is displayed:
Figure 7. Diagram of the Loan
Processing global monitoring context on the dashboard
Notice that this diagram is similar to the one that you previewed before finishing the generation of the global monitoring context. The name and value of the mapping metric for this global monitoring context instance are shown before the milestone, and its elapsed time metric is shown after the milestone. If the KPI values are outside the range that you set when you created the milestone, you see an At Risk or Overdue indicator.
The diagram also shows the progress of the global monitoring context instance through the milestones. In Figure 7, for example, the first milestone has been completed and the second milestone is currently in process.
If you authored any reports for Loan Processing, the reports are displayed on the Loan Processing Reports tab.
The Milestone KPIs tab shows information about the Average Elapsed Time and Count KPIs.
The Milestone Diagrams tab provides a diagram that shows KPI values that aggregate values across all instances of the Loan Processing global monitoring context, such as the average elapsed time at each milestone across all loans and the count of the number of loans currently at a particular milestone.
Generate a global monitoring context when no common source metric exists
Related tasks:
Use the Global Monitoring Context wizard