Testing
- Create a test project
- Performance testing tips
- Record HTTP tests
- Remove temporary files
- Allow recorded pages to load completely
- Record with IP addresses
- Configure Internet Explorer for recording from a secure web site
- Record an HTTP test
- Split an HTTP test during recording
- Returning a browser to its initial state if recording is interrupted
- Create HTTP tests manually
- Record Adobe Flex content
- Record Microsoft Silverlight applications
- Change HTTP test generation preferences
- Configure the workbench for NTLMv2 authentication
- Record SAP tests
- Record Citrix tests
- Record service tests
- Record socket and TN3270 tests
- Digital certificates overview
- Kerberos overview
- Annotating a test during recording
- Record sensitive session data
- Split a test during recording
- Generating a new test from a recorded session
- Putting test assets under source control
- Organize test assets by type
- Copy test assets with dependencies
- Copy projects
- Edit tests
- Edit HTTP tests
- Redirection support for HTTP tests
- HTTP test editor overview
- Specify the number of allowable URL redirects during test runs
- Cutting and pasting in tests
- Defining performance requirements in tests
- Add an authentication folder
- Verify expected behavior
- Specify the expected page title
- Specify the expected response code
- Specify the expected response size
- Specify the expected content
- Specify the expected content for multiple requests
- Specify error-handling behavior
- How loops affect the state of virtual users
- Split a test
- Split a test page
- Merging test pages
- Disable and enable secondary HTTP requests
- Reusing tests on different hosts: Server connection variables
- Converting tests to use SSL connections
- View a test in the Protocol Data view
- Test Siebel applications
- Prerequisites for Siebel testing
- Differences between Siebel tests and HTTP tests
- Correlating a request value with a built-in Siebel variable
- Edit SAP tests
- SAP test editor overview
- Verify expected behavior
- Add an SAP verification point
- Specify an expected screen title
- Verify response times
- Add elements to an SAP test
- Add an SAP set, SAP get, or SAP call element
- Add an SAP sequence element
- Add a batch input transaction
- Split an SAP test
- View GUI data in the SAP Protocol Data view
- Edit Citrix tests
- Citrix test editor overview
- Citrix synchronization overview
- Verify application behavior
- Enable Citrix window verification points
- Enable Citrix image synchronization verification points
- Specify window verification point criteria
- Measuring response times
- Add elements to a Citrix test
- Edit a mouse action
- View a mouse sequence
- Edit a keyboard action
- Edit a text input
- Synchronize tests with screen areas
- Manually adding an image synchronization
- Add values to an image synchronization
- Use custom code with a Citrix test
- Edit service tests
- Web service test editor overview
- Verify application behavior
- Add equal verification points
- Add contain verification points
- Add Xpath query verification points
- Add attachment verification points
- Add XSD verification points
- Add elements to a service test
- Add a service request
- Update a service response from the service
- Manually adding a response element
- Edit WSDL security profiles
- WSDL security editor overview
- Create security profiles for WSDL files
- Use a security policy
- Implementing a custom security algorithm
- Add WS-Addressing to a security configuration
- Test asynchronous services
- Asynchronous service testing overview
- Create an asynchronous request structure
- Add an asynchronous callback to a service request
- Create a reliable messaging call structure
- Edit socket tests
- Socket API test editor overview
- Add elements to a socket performance test
- Add a socket close
- Add a socket send
- Add a socket receive element
- Verify application behavior
- Verify received content
- Verify received message size
- Verify received data with custom Java code
- Merging socket send and receive elements
- Change multiple socket send and receive elements
- Split a socket test
- Use custom code to specify an end policy
- Use custom code to manipulate data
- Edit Kerberos tests
- Add test elements
- Add a comment
- Add a transaction to a test
- Add conditional logic
- Synchronize users in tests
- Add a loop to a test
- Search within tests
- Locating specific types of test elements
- Search and replacing text in tests
- Disable portions of a test
- Specify error-handling behavior
- Running test elements in random order
- Rename test assets
- Delete test assets
- Debugging custom code for tests and compound tests
- Provide tests with variable data (datapools)
- Datapool overview
- Create a datapool associated with a test
- Create a datapool in the workspace
- How datapool options affect values that a virtual user retrieves
- Import a CSV file into a datapool
- Enable a test to use a datapool
- Associate a test value with a datapool column
- View datapool candidates when you open a test
- Edit a datapool
- Encrypted datapools overview
- Encrypting datapools
- Remove encryption from datapools
- Change passwords on encrypted datapools
- Import to encrypted datapools
- Export from encrypted datapools
- Use a digital certificate store with a datapool
- Navigating between a datapool and a test
- About test variables
- Declaring and assigning test variables
- Initializing variables from the command line
- Initializing variables from Rational Quality Manager
- Correlating response and request data
- Data correlation overview
- View data correlation
- Data correlation rules overview
- Create data correlation rule sets
- Create a reference using data correlation rules
- Create a substitution with data correlation rules
- Assigning sequential numbers to users
- Example: Linking references to substitutions with rules
- Example: Linking substitutions to references with rules
- Example: Linking substitutions to built-in data sources with rules
- Recorrelating data with rules
- Record tests with data correlation rules
- Generate data correlation rules in the test editor
- Generating rules while you edit
- Saving manual data correlation in a rule set file
- View data correlation rule usage
- Test data sources overview
- Correlating a request value with test data
- Substituting request content with file contents
- View references
- Create a reference or field reference
- Select a reference in a response
- Correlating multiple fields in a test
- Guidelines for adjusting data correlation
- Find data correlation errors
- Disable data correlation
- Recorrelating test data
- Data transformation
- View binary data
- Transforming binary data in tests
- Transforming binary data in specific requests
- Transforming binary data automatically
- View or transforming GWT encoded data
- Transforming GraniteDS or BlazeDS data
- Transforming SAP Web DynPro XML to ASCII
- Create custom data transformations
- Use custom data transformations
- Compound tests
- Emulating workloads while performance testing
- Schedule overview
- Create a schedule
- Set the user load
- Think time overview
- Set think time behavior in schedules
- Limiting think times in schedules
- Limiting think times in tests
- User group overview
- Add a user group
- Adjusting user groups
- Emulating slower network traffic (HTTP)
- Running long duration tests (SAP and Citrix)
- Running a user group at a remote location
- Work with agents
- Checking status of agents
- Configure ports for agents
- Manage logs in deployment directory
- Configure the high resolution timer
- Add a test
- Add must run tests
- Assigning variables
- Defining performance requirements in schedules
- Repeating tests
- Delaying virtual users or actions
- Running tests at a set rate
- Running tests in random order
- Add a transaction to a schedule
- Synchronize users
- Emulating network traffic from multiple hosts
- Configure IP aliases for a remote Windows location
- Configure IP aliases for a remote Linux location
- Configure IP aliases for a remote AIX location
- Enable virtual users to use IP aliases
- Monitoring resource data while running a performance test schedule
- Enable resource monitoring
- Enable resource monitoring on Windows Vista, Windows 7, and Windows Server 2008
- Add sources for resource monitoring data
- Add Apache HTTP Server sources
- Add Apache Tomcat sources
- Add IBM DB2 sources
- Add IBM Tivoli Monitoring sources
- Add IBM WebSphere Performance Monitoring Infrastructure sources
- Add Java Virtual Machine sources
- Add JBoss Application Server sources
- Add Microsoft Windows Performance Monitor sources
- Add Oracle Database sources
- Add Oracle WebLogic Server sources
- Add SAP NetWeaver sources
- Add Simple Network Management Protocol sources
- Add UNIX rstatd sources
- Monitoring response time breakdown
- Enable response time breakdown collection
- Enable response time breakdown collection on Windows Vista, Windows 7, and Windows Server 2008
- Set logging levels
- Enable response time breakdown collection for specific page elements
- Filtering POJO packages, methods, and classes
- Set log and statistic levels
- Set the statistics displayed during a run
- Set the data that the test log collects
- Set the problem determination level
- Running schedules with performance testing
- Running a schedule or test
- Adjusting delays in HTTP tests
- Configure HTTP client delays
- Overriding the HTTP connection timeout value
- Playing back HTTP tests faster than the recorded rate
- Set a launch configuration
- Running a configured schedule
- Configure multiple host names for a location
- Automating tests
- Running a test from the command line
- Export report counters automatically
- Controlling caches size
- Increasing memory allocation
- Controlling execution of reports from Eclipse viewer
- Change the number of virtual users during a run
- Releasing virtual users from synchronization points
- Change the stage duration during a run
- Change the problem determination level during a run
- Interrupting a run
- Controlling execution of reports from web browser
- Change number of virtual users during a run
- Change the stage duration during a run
- Releasing virtual users from synchronization points
- Change log level during a run
- Stopping test runs
- Debugging HTTP tests
- HTTP debugging overview
- Watching a virtual user during a test run
- Watching a virtual user during a schedule run
- Replaying a virtual user after a run completes
- View the playback summary of a virtual user
- Inspecting HTTP test logs in the Protocol Data view
- Manage HTTP information in the Protocol Data view
- Debugging Citrix tests
- Enable the Citrix monitoring panel
- Debugging tests with the Citrix monitoring panel
- Set Citrix breakpoints
- Evaluating results
- RPT logs
- View reports after a run
- Access reports remotely
- Switching between reports
- Evaluating results in the Eclipse viewer
- Comparing results within and among runs
- Comparing schedule stages
- View stage results in real time
- Generating functional test reports
- Customize reports
- Set custom and conditional report colors
- Change the default appearance of reports
- Customize the appearance of report graphs
- Change the report displayed during a run
- Change information in a report
- Filtering results
- Evaluating results for a specific time range
- Create a custom report
- Correcting time offset
- View resource monitoring data
- Add resource counters to reports
- Navigating to resource monitoring in reports
- Filtering resource counters
- Import resource monitoring data
- View response time breakdown
- Choose page elements to view
- Interpreting response time breakdown statistics
- View page element responses
- View page response time contributions
- View different types of statistics
- Navigating to resource monitoring data from response time breakdown
- Import response time breakdown data
- Imposing constraints while importing response time breakdown data
- Export data from runs
- Create executive summaries
- Export reports to HTML format
- Export results to a CSV file
- Export report counters to a CSV file
- Export report metadata to a .view file
- Evaluating results in the web browser
- Comparing run results
- Comparing schedule stages
- Customize reports
- Set custom and conditional report colors
- Manage counters in a graph
- Filtering report results
- Evaluating results for a specific time range
- Create custom web reports
- Export test results
- Create executive summaries of reports
- Export report counters to a CSV file
- Export reports to HTML format
- Export charts as images
- Test log overview
- View test logs
- View errors while running tests
- Export test logs
- Export event log
- Export event console output
- View adjustments to page response times
- Disable adjustments to page response times
- Simulating services with stubs
- Send service requests with the generic service client
- Generic service client overview
- Create transport protocol configurations
- Create an HTTP transport configuration
- Configure the workbench for NTLMv2 authentication
- Create a JMS transport configuration
- Create a WebSphere MQ transport configuration
- Create Microsoft .NET transport configurations
- Create SSL configurations
- Edit WSDL security profiles
- WSDL security editor overview
- Create security profiles for WSDL files
- Use a security policy
- Implementing a custom security algorithm
- Add WS-Addressing to a security configuration
- Send service requests with WSDL files
- Send HTTP endpoint requests
- Send a JMS endpoint request
- Send a WebSphere MQ endpoint request
- Test all operations in a WSDL file
- View message content
- Synchronize a remote WSDL file
- Add static XML headers to a service request
- Open file attachments
Create a test project
Tests created, and assets associated with the test, reside in a test project. You can create the project separately, or you can simply record a test, which automatically creates a project named testproj.
- Select...
-
File | New | Project | project_type
- Type a name for the project.
Do not use a project name containing spaces. The only allowed characters in the Project Name field are [a-z], [A-Z], [0-9], "-", "_", and "."
- Select: Use default location.
- Optional: Click Next and select the folders to create in the new project.
These folders organize your files by asset (Tests, Schedules, Results, and so on).
- Click Finish.
Performance testing tips
| Number of computers | Have at least two computers. Play back schedules on an agent computer separate from the workbench computer. |
| Number of virtual users (vusers) at remote locations | Do not overload the remote agent computer. If you exceed the number of vusers that the remote computer can run, the performance measurements of the server will be skewed. For a computer with a 1 GHz processor and 1 GB of RAM, do not exceed 1000 concurrent vusers. |
| TCP/IP ports | On computers with Microsoft Windows, the typical limit for TCP/IP ports is 5000. To observe port use, run netstat -a. If the largest number you see is 5000, then you need to increase the number. To increase it, open the registry, go to HKEY_LOCAL_MACHINE/SYSTEM/CurrentControlSet/Services/Tcpip/Parameters, create a new dWord named MaxUserPort, and set its value up to 65000. Restart the computer. |
| Open file limit for Linux | Computers that are running Linux need a per-process open file limit higher than 1024. As root, enter ulimit -n 30000 (or higher) before starting Agent Controller. |
| Looping within tests | If you are stress testing a server, your test typically contains a loop. Your connection behavior differs depending upon whether the loop is set at the schedule level or at the test level. Setting a loop at the test, rather than the schedule, level gives you a performance advantage, because the connections are reused during the looping process. |
| Logging levels | After the test is stable, for maximum performance, reduce the test log level and problem determination log level and sample a small number of users. Increase the statistics sample interval to 30 or 60 seconds for long-running tests. |
| Workbench heap size | The JVM heap size on the workbench is based on the available physical memory. Do not run the workbench on a computer with less than 768 MB of physical memory. The maximum workbench heap size depends on your JVM. To increase workbench heap size, set -Xmx in the RPT_HOME/eclipse.ini For Windows, if the physical memory is 3 GB or more, maximum heap size must not exceed 1200 MB. For Linux, the maximum heap size is approximately 3000 MB. If the workbench is sluggish or fails to start after increase the heap size, reset the heap size to the default by removing the VMARGS=-Xmx line from the eclipse.ini file. |
| Location (agent) heap size | To access maximum heap, after one successful test of any size, search for a location (agent) attribute called RPT_DEFAULT_MEMORY_SIZE. If you cannot find this attribute, you can specify a maximum heap by creating a new attribute: RPT_VMARGS=-Xmx1500m (for example, max heap 1.5 GB). |
| Disk space | Verify that there is sufficient free disk space on the workbench and agent computers. Also, verify that there is sufficient free disk space on the drive containing the system temporary directory. |
| Record length | If you record for a relatively long time, test generation also takes a long time. If test generation is taking a relatively long time, try shorter recording scenarios. |
Record HTTP tests
When you record a test, the test creation wizard...
- records your interactions with a web-based application
- generates a test from the recording
- opens the test for editing
I have found that Firefox is a reliable browser for recording tests, but Internet Explorer and other browsers should work also.
Remove temporary files
To ensure the recording accurately captures HTTP traffic, remove temporary files from the web browser's cache before you record a test.
From Internet Explorer...
-
Tools | Options | General | Delete | Delete Browsing History | Delete | OK
From the Mozilla FireFox...
-
Tools | Options | Advanced tab | Network tab | Clear Now | OK
Allow recorded pages to load completely
When recording, wait for each page to load completely. This wait does not affect performance results, because you can remove extra think time when you play back the test.
Record with IP addresses
When recording, you can enter the IP address of the website to connect to instead of entering the host name. When you play back the test, however, make sure that the IP address can resolve to a host name. Typically, this resolution occurs via a reverse DNS lookup. While recording a test in Internet Explorer, if you use localhost in the URL, Internet Explorer does not route the traffic through Rational Performance Tester Agent. The test will not contain any recorded data. You must use a host name or IP address to record the traffic.
To resolve the IP address, map each IP address to a host name in...
-
C:\windows\system32\drivers\etc\hosts
If an address cannot be resolved, your test shows a slower connection time. This time might be delayed by as much as 8 seconds, depending on the network configuration of the computer.
Configure Internet Explorer for recording from a secure web site
You can suppress the security warning that Internet Explorer displays when you are recording from a secure web site.
Performance Tester uses a proxy recording program that intercepts all traffic between the browser and the web server. During recording at a secure web site (with a web address that starts with https://), by default you see a security warning before every action and must confirm your acceptance of a security risk to continue.
If you do nothing, this warning is displayed with every browser action, and you must repeatedly click Yes to continue. Performing the following procedure installs the recorder certificate on the local host as a trusted authority and thereby disables warnings from Internet Explorer during recording at secure web sites. This procedure does not affect other browsers that record from secure web sites.they will display warnings before every action.
To disable security warnings when using Internet Explorer to record from a secure web site:
- During test recording, the first time the warning is displayed, click View Certificate.
- In the Certificate window, click Install Certificate.
- In the Certificate Import Wizard window, click Next.
- On the second page of the wizard, click Next.
- On the last page of the wizard, click Finish.
- In the Root Certificate Store confirmation window, click Yes.
- In the window that reports that the import was successful, click OK.
- In the Certificate window, click OK.
- In the Security Alert window, click OK.
Record an HTTP test
The following recorders are available for recording HTTP traffic from a browser:
| SOCKS proxy recorder | Use when no proxy connections are required. |
| HTTP proxy recorder | Use when proxy connections are required to connect to the network or when the client program does not support SOCKS. |
| Socket recorder | Use for low-level network traffic when the client does not support proxies. |
Because SSL relays traffic between the client and the server, the client might require the proxy recorder to authenticate itself as the server, and the server might require the proxy recorder to authenticate as the client. If the client program requires an authenticated server, you must either...
- Have access to the server certificate keystore and provide it to the proxy recorder
- Configure the client to accept the default certificate from the proxy recorder instead of the certificate from the actual server
To record an HTTP performance test with a browser:
- In the Performance Test perspective, on the toolbar, click the New Test From Recording icon
 or click...
-
File | New | Test From Recording
- In the New Test From Recording wizard, click Create a test from a new recording, select HTTP Test, and click Next.
If you are recording sensitive data, click Recording encryption level and select the encryption level to record.
- On the Select Location page, select the project and folder to create the test in, type a name for the test, and click Next.
If necessary, create a performance test project or folder...
-
Create the parent folder

- On the Select Client Application page, select the web browser to use.
The type of application defines the recorder that can be used. The following client application types are supported for recording a service test:
Microsoft Internet Explorer Records traffic sent and received with Internet Explorer. Mozilla Firefox Records traffic sent and received with Firefox. Google Chrome Records traffic sent and received with Chrome. Apple Safari Records traffic sent and received with Safari. Opera Records traffic sent and received with Opera. Managed Application Starts a browser not in the list. Unmanaged Application Records HTTP traffic from one or multiple client programs that use a proxy. Manually start the client programs, and the proxy recorder records all traffic that is sent and received through the specified network port. - Depending on your selection in step 4, take one of the following necessary steps: On the Recorder Settings page, depending on the browser that you selected, specify these details:
- If you selected a browser, specify the recording method.
- To record HTTP or SOCKS traffic through a proxy, click either...
-
Record traffic with the proxy recorder
To record low-level network traffic for applications where a proxy cannot be used, click...
-
Record traffic with the socket recorder
Use this option primarily when you are not using Mozilla Firefox or Microsoft Internet Explorer.
When using proxy recording, you can filter out HTTP or HTTPS requests to a specific endpoints so that any requests to those endpoints are not recorded.
- If the server requires client SSL authentication, provide the client certificate keystore for the proxy recorder to be authenticated by the server as though the proxy recorder were the client. Select the check box The server requires a specific client certificate. Specify the file name and password of the server certificate keystore. If multiple certificates are required, click Multiple certificates, and click Add to specify a certificate keystore file name and password for each host name and port.
- If you selected Mozilla Firefox, you can choose to use a temporary Firefox profile.
This starts Firefox without any bookmarks, plug-ins, or toolbars that might be associated with your usual profile. Select the Use an alternate Firefox profile check box, and then select Use a temporary Firefox profile. This option is also use if you need a prompt to download a server certificate interactively when recording.
- If you clicked Record traffic with the proxy recorder, click Advanced to specify whether to use an HTTP or SOCKS proxy recorder to review and edit network connection settings that the browser uses or to specify advanced SSL authentication settings. If you clicked Record traffic with the socket recorder, specify advanced SSL authentication settings.
- To record HTTP or SOCKS traffic through a proxy, click either...
- If you selected Managed Application...
- On the Recording Method page, click a recorder to record HTTP traffic and click Next.
- On the Managed Application Options page, for Program path, click Browse to select the program. If necessary, specify the Working directory, and in the Arguments field, type the command-line arguments that the program requires. Click Next.
- If the program requires user input from a command line interface, select the Open console for user input check box. Click Next.
- Depending on the recording method that you selected, complete one of the following steps:
- On the Proxy Recorder Settings page, specify whether to use an HTTP or SOCKS proxy recorder to review and edit network connection settings that the browser uses or to specify advanced SSL authentication settings.
- On the Socket I/O Recorder Secured Settings page, specify advanced SSL authentication settings.
- If you selected Unmanaged Application, on the Proxy Recorder Settings page, specify whether to use an HTTP or SOCKS proxy recorder to review and edit network connection settings that the browser uses or to specify advanced SSL authentication settings.
- If you selected a browser, specify the recording method.
- Click Finish. A progress window opens while your browser starts.
- In the browser address field, type the address of the web-based application to test, and activate the link.
If you enter the address of a secure website (one that starts with https:), your browser might display a security alert. Depending on the security certificate for the site, you might be required to accept a security risk to proceed with the recording. If you do not get prompted to access a certificate, and instead just get SSL error, you may need to use a temporary profile.
- Complete the user tasks to test. While you are recording, follow these guidelines:
- Wait for each page to load completely. This wait does not affect performance results, because you can remove extra waiting time (think time) when you play back the test.
- Do not change any browser preferences.
You can use the Recorder Test Annotations toolbar to add comments, record synchronizations, or take screen captures during the recording.
- To change the page name, click the Change page name icon
 .
.
In the resulting test, the page element in the test editor uses the new name; however, the original name is preserved in the Page Title Verification Point area so that page title verification points still work correctly.
- To add a comment to the recorded test, click the Insert comment icon
 .
.
You are prompted for a comment.
- To add a screen capture to the recorded test, click the Capture screen icon
 .
.
Screen and window captures make your tests easier to read and help you visualize the recorded test. You can change the settings for screen captures and add a comment to the image.
- To manually add a synchronization point to the recording, click the Insert synchronization icon
 .
.
- To manually add a transaction folder to the recording, click the Start Transaction icon
 and Stop Transaction icons
  to start and stop the transaction.
Transactions can be nested.
- To insert a split point into the recorded test, click the Split point icon
 icon.
icon.
With split points, you can generate multiple tests from a single recording, which you can replay in a different order with a schedule.
- To filter packets that display during recording sessions, click the Filter packets
 icon.
icon.
You can specify the filter criteria for the following elements:
- SAP packet type
- SAP packet attribute
- Socket packet type
- Socket packet attribute
- Packet type
- Proxy connection IDs
- Citrix events
- A group of conditions
- Remote host
You can add and remove packet filters as needed.
- After finishing the user tasks in the browser, stop the recorder. You can stop the browser by closing the client program or by clicking the Stop icon
 in the Recording Control view.
A progress window opens while the test is generated. After the test is complete, the Recording Control view displays the Test generation completed message, the test navigator lists your test, and the test opens in the test editor.
Split an HTTP test during recording
You can insert split points when you record a test. With split points, you can generate multiple tests from a single recording that you can replay in a different order with a schedule. You can also create a schedule containing all of the tests that are generated from the split points.
During the recording process, you can select the option to create a schedule for the tests that are generated from the split points. The schedule will contain these attributes:
- One user
- One user group for the local computer
- All of the tests from the recording, in serial order
- One stage: Run until finished
- Recorded think times, with the maximum think time set to 2 seconds
- Statistics:
- Statistics log level: All
- Statistics sample interval: 5 Seconds
- Only store All Hosts statistics
- Test Log:
- Show errors and failures: All
- Also show warnings: All
- And also show all other types: All
- Problem Determination log level: Warning
To insert split points when you record a test:
- Start recording the test. The Recorder Test Annotations toolbar opens near the top of the screen.
- To insert a split point into the recorded test, click the Split point icon .
The Insert Split Point window is displayed.
- Click Test name, and then type a name for this section of the test.
You are naming the previous section of the test, not the upcoming section of the test.
Repeat this step between recorded user actions as needed to split tests.
- Click Test name, and then type a name for this section of the test.
- Close the client program to stop the recording. The Generate HTTP Test window is displayed.
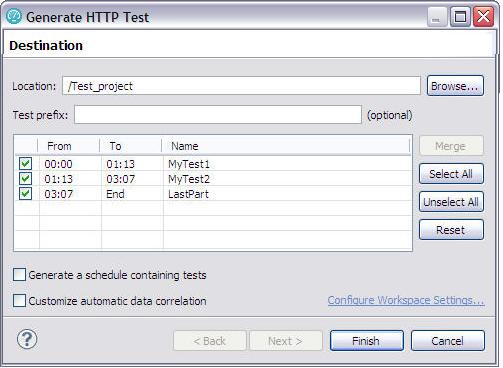
- Type a Test prefix for all the tests in the schedule.
- To create a schedule for the tests...
-
Generate a schedule containing tests
When you select this option, you can modify the name of the schedule.
- To choose automatic data correlation or rule-based data correlation.
-
Customize automatic data correlation
If you select this option and choose rule-based data correlation, you can specify which data correlation rule sets to use.
- Click Finish.
The Test Generation window displays the status of generating the tests and schedule and the data correlation. You can view the test generation log from this window.
- When test generation is complete, you can select the test to open and then click Open Selected Tests, or you can click Close to finish this process.
The schedule and tests are generated using the names that you specified in the wizard.
Returning a browser to its initial state if recording is interrupted
Browser options are changed during recording and are reset after recording is complete. If you interrupt recording, the browser stays in its changed state, and you may receive The page cannot be displayed messages. To fix this, reset the browser to its initial state.
- Right-click the Internet Explorer icon, and select Properties.
- On the Connections page, click LAN Settings.
- If you do not use a proxy, in the Local Area Network (LAN) Settings window, clear...
-
Use a proxy server for your LAN
- If you use a proxy:
In the Local Area Network (LAN) Settings window, select...
-
Use a proxy server for your LAN
...and then click Advanced.
In the Proxy settings window:
- Add the proxy address and port number to the HTTP and the Secure fields.
- Remove the proxy address and port number from the Socks field.
- In the Proxy Settings window, click OK.
- If you do not use a proxy, in the Local Area Network (LAN) Settings window, clear...
- In the Local Area Network (LAN) Settings window, click OK.
- In the Internet Properties window, click OK.
Create HTTP tests manually
Create an empty test
You can create an empty template for a test that you plan to write manually.
- In the Test Navigator, right-click a project and click...
-
New | Other | New | Test | Test Assets | New Test | Next
- In the Enter, create, or select the parent folder field, click the test project in which to store the test.
- In the Name field, type a name for the test, and then click Next.
- Optionally, in the Test Attributes window, type a description for the test, and then click Next.
- In the Protocol and Features window, select HTTP Protocol, and then click Next.
- In the HTTP Extension window, enter the name of the host, and set the options for the test.
- In the New test summary window, inspect your selections, and then click Finish.
- Confirm to open the editor.
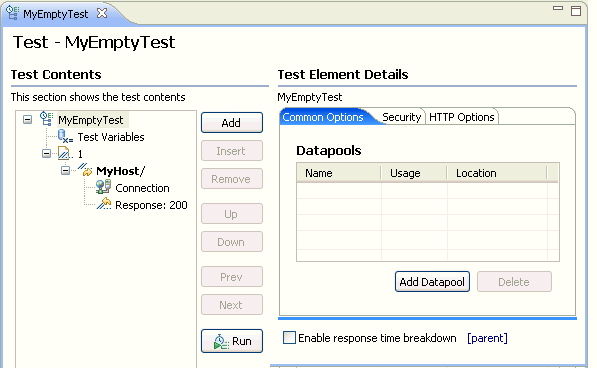
A test template opens for you to edit. The following figure shows HTTP test template with the default options (one page, one request per page, and a response for the request).
Add templates for new elements
You can add a template for a new test element that you plan to write by hand.
To add a template for a page, page request, or basic authentication block to a test:
- Open the test. If you are writing a test completely by hand, you can create an empty test.
- Click the parent or sibling element.
- Click Add or Insert. The editor enforces the test hierarchy: tests contain pages, pages contain requests, and requests contain authentication blocks.
- Add adds the template to the bottom of the selected element: a page is added to the bottom of the test, a request is added to the bottom of the selected page, and an authentication block is added to the end of the selected page request.
- Insert inserts the template at the point of the cursor: a page is inserted before the selected page, a page request is inserted before the selected request, and an authentication block is inserted at the top of the selected page request.
- Select one of the following options. The options displayed depend on the element that you select.
Option Description HTTP Page Adds a page to the test. HTTP Request Adds a request to the test. Basic Authentication Adds an authentication block to a request. A folder named Authentication is added, and the Test Element Details area displays the User id, Password, and Realm fields. Custom Code Adds a block of custom code to the test. Delay Adds a delay to the test. Loop Runs part of the test a specific number of times. In addition to setting the number of iterations, you can control the rate of iterations and randomly vary the delay between iterations. Condition Adds a conditional block to the test. In most cases, a conditional block issues HTTP requests depending on the value of a reference or field reference. The reference or field reference must exist in the test and precede the conditional block. Transaction Enables you to view performance data about the transactions that you have added. In the Test Element Details area, give the transaction a meaningful name. This is useful in the Transactions report, which lists transactions by name. Random Selector Enables you to run test elements in random order. Comment Adds a comment that appears in the Test Element Details area and in the actual test.
Add a header
You can add a standard header or a custom header to a request or response.
- Open the test.
- In the test hierarchy, click a request (to add a request header) or the Response Data folder for a request (to add a response header).
- In the Test Element Details area, locate the Request Headers table, and then click Add. The Add/Edit Headers window opens.
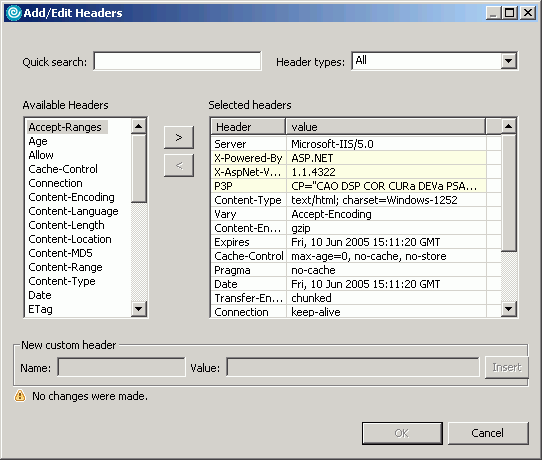
- To add a standard header:
- In the Available Headers list, locate the header to add and click it. Use the Quick search field (start typing the name of a header) and Header types list (select the type of header you are looking for) to quickly locate a header in the Available Headers list.
- Click the right angle bracket (>). The selected header moves into the Selected headers list and your cursor is placed in the value column.
- Type the value for the header.
- To add a custom header:
- In the Header types list, select Custom.
- At the bottom of the window, in the New custom header area, type the header information in the Name field and the Value field, and then click Insert. The custom header is added to the Selected headers list.
- When you have finished adding headers, click OK.
Edit header contents
You can modify the contents of the headers that are contained in requests and responses.
- Open the test.
- In the test hierarchy, click a request (to edit a request header) or the Response Data folder for a request (to edit a response header).
- In the Test Element Details area, locate the Request Headers table, and double-click the cell containing a value to edit. An ellipsis button is displayed in the Value column.
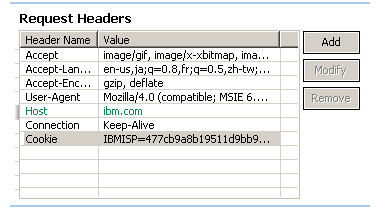
- Click Modify.
- In the Edit Header window, edit the header value as desired. You can create a reference or field reference in the header value.
- Click Table View to return to the Request Headers table.
Record Adobe Flex content
You can record an HTTP session containing traffic to and from a .swf Adobe Flex application.
The Adobe Flash plugin must be installed in your web browser to run flex applications (.swf files) and to record the HTTP session.
Adobe Flex technology allows communication through XML, SOAP, or AMF. AMF is compressed binary data that must transformed into XML to be used in an HTTP performance test.
- Record the HTTP. By default, Rational Performance Tester transforms the AMF format in to the XML format.
After the transformation, the XML data is generated in the test with "amf" prefixes in the names...
- <amf3Property amfName="zipcode" amfType="amf3String" zipcode="94103"/>
The generated XML can be used for data correlation. Only the amfValue attributes or attirbutes without the amf prefix can be used for data correlation.
Do not modify or use data correlation on any XML attributes that start with the amf prefix except for amfValue. If these attributes are modified, the replay of the test will cause errors.
Record Microsoft Silverlight applications
To test the performance of an application that was developed by using Microsoft Silverlight, you can record the application.
Rational Performance Tester supports Microsoft Silverlight 5. Microsoft Silverlight communicates with the server in the Windows Communication Foundation (WCF) Binary format. After recording the Microsoft Silverlight application, you can transform the format to XML for better readability and to apply data correlation.
- Record the HTTP application
Change HTTP test generation preferences
- Click...
-
Window | Preferences | Test | Test Generation | HTTP Test Generation
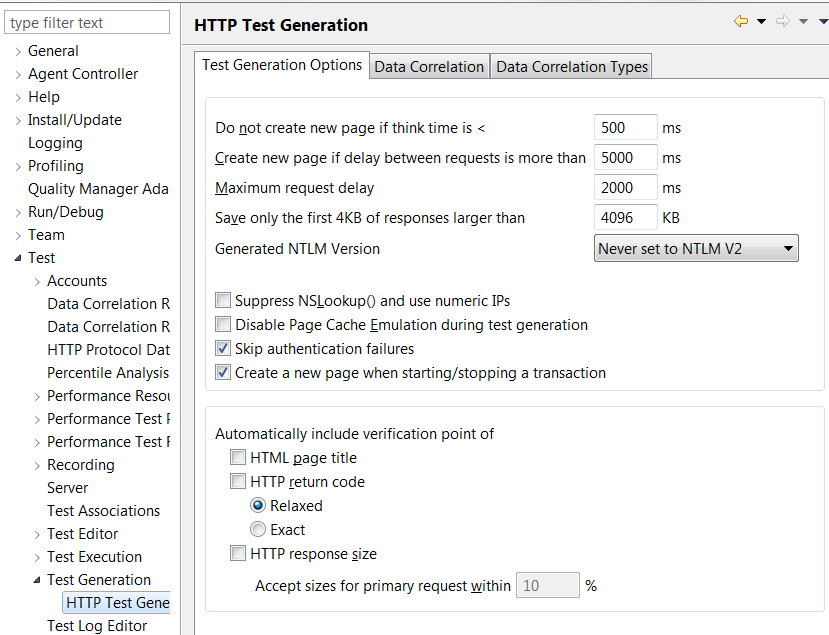
- Select the preference to change.
- Do not generate a new page if think time is less than
- Enter the shortest time, in milliseconds, that the generator uses as a delay to emulate user think time for an HTTP page. If your tests contain fewer pages than expected, try a shorter interval.
- Generate a new page if delay between requests is greater than
- Enter the longest delay, in milliseconds, that the generator allows between page requests. If this time is exceeded, a new page is generated. If your tests contain more pages than expected, try a longer interval.
- Maximum request delay
- Enter the longest delay, in milliseconds, that the generator allows before truncating HTTP requests. The requests are truncated on the generated test. The recorded test still contains the original values, and you can get them back by generating a new test.
- Save only the first 4KB of responses larger than
- Enter the limit of response data, in KB, that the generator saves. If a response is larger than the specified limit, only the first 4 KB of data is saved.
- Suppress NSLookup() and use numeric IPs
- Select this option to shorten test generation time. The disadvantage is that IP addresses in a test are less user-friendly than web page format (www.example.com).
- Disable Page Cache Emulation during test generation
- Disable page cache emulation. When page cache emulation is enabled, caching information in server response headers is honored. Additionally, requests are not submitted to the server for content that is confirmed by the client as fresh in the local cache. Page cache emulation is enabled by default.
- Use Legacy Test Generator
- Select this option if you have been instructed to use the legacy HTTP test generator.
- Automatically include verification point of
- Click to specify the types of verification points to be automatically included. If a check box for a verification point is selected, the code and edit controls for this type of verification point are generated in all tests. Verification points can also be enabled or disabled within specific tests.
- Relaxed
- Response codes that are in the same category (for example, 200, 201, 203, 209) are considered equivalent. An error is reported if the response code is not in the same category.
- Exact
- An error is reported if the response code does not match the recorded value exactly.
- Accept sizes for primary request within
- If you are automatically generating response size verification points, click to specify the acceptable size range for primary requests. No error is reported if a response is within the specified percentage above or below the expected size. By default, for primary requests, HTTP response size verification points use range matching.
The data correlation preferences are as follows:
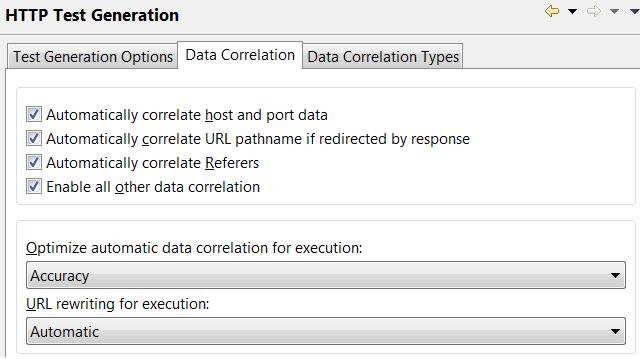
- Automatically correlate host and port data
- By default, host and port data is correlated automatically. If tests in a previous release have significant manual correlations, or you are using proxies, the migration of the replace-host functionality feature is likely to fail during playback. In this situation, clear the check box. When you reopen your tests, they will not have the automatic correlation feature in them.
- Automatically correlate URL pathname if redirected by response
- Specifies whether URL path names are correlated if they are redirected by a selected response code. If a check box for a response code is selected, the test generator performs correlations for that response code. This option applies only to responses that are redirects, with a status code between 300 and 399.
- Automatically correlate Referers
- By default, the Referer field in an HTTP request header is correlated automatically. Clear the check box if you plan to correlate Referers manually. If you run tests against servers that do not require a Referer field, clearing this check box reduces the number of correlations performed when the test runs, and can increase user throughput.
- Enable all other data correlation
- By default, request and response data is correlated automatically. Clear the check box to disable automatic data correlation of request and response data. Consider clearing the check box if you create your own data correlation rules in the rules editor.
- Optimize automatic data correlation for execution
- Specifies the characteristic that tests are automated for.
- With the Accuracy setting (the default), many references with an identical session ID value are created and the value of each session ID is substituted from the nearest previous reference.
- To make a test run faster by reducing the number of references that are created during automatic data correlation, change the optimization to Efficiency. For example, consider a test where a session ID, which is assigned when a user logs in, is included in every subsequent request in the test. With the Efficiency setting, all session IDs are substituted from a single previous reference. The downside of this setting is that it can result in incorrect correlations. For example, a request containing the Joe Smith string might be incorrectly correlated with a request containing the Joe Brown string.
- URL rewriting for execution
- Specifies how web addresses (URLs) are rewritten during test execution.
When correlating data, the test generator replaces part of a URL request string with a value that the server returned in response to a previous request.
- Automatic (default): The test generator automatically determines when rewriting the entire URL during substitution will facilitate test execution.
- On: Select to rewrite URLs in every instance of data correlation. This produces larger tests that take longer to run. Try this setting if your tests fail unexpectedly.
- Off: Select to manually correlate the instances where URL rewriting is needed. This setting might cause execution errors.
To turn data correlation off entirely or to set whether names are automatically generated for data correlation references, click...
-
Window | Preferences | Test | Test Generation | HTTP Test Generation | Data Correlation tab
The data correlation type preferences are as follows:
- Data Correlation Types
- Specify when to generate data correlation constructs. With the Automatic setting, the test generator creates the required constructs where needed. If the test does not contain the required constructs, change the setting to On, which will always perform data correlation. If tests do not require a specific construct, select Off, which has the additional benefit of improving performance on subsequent test generation.
- For Jazz Foundation Services, On and Automatic enable data correlation for Jazz applications that use REST storage or query APIs from Jazz Foundation Services. An example of such an application is Rational Requirements Composer. Although data correlation does not typically apply to browser-based Jazz web clients, it may be useful for other HTTP client-server applications that use REST services and the Atom Publishing Protocol for updating web resources.
- For Jazz Web Applications, On and Automatic enable data correlation for Jazz web applications that use the Jazz Foundation web UI framework Examples of these web applications are the web interfaces for Rational Quality Manager and Rational Team Concert. Data correlation can also be useful for other web applications that contain javascript that employs JSON for client-server data exchange. This is a common practice with DOJO- and AJAX-based applications.
- After changing a setting, click Apply.
Configure the workbench for NTLMv2 authentication
NTLMv2 authentication requires access to a set of third-party libraries. You must prepare an environment with these libraries to use NTLMv2 authentication, set the class path of the Java. JRE that Eclipse uses, and set the class path of the virtual machine that the Agent Controller uses.
Before testing SOAP-based services that use security algorithms, obtain and install a third-party library file. By default, the HTTP test generation does not enable NTLMv2 authentication, even if it was part of the recording. To automatically enable the correct NTLM version from the recording, set the NTLM V2 setting to Automatic in the HTTP Test Generation preferences.
To configure the workbench to enable NTLMv2 authentication
- Download the archive from...
-
http://jcifs.samba.org/src/jcifs-1.3.17.zip
- Unarchive the zip file and copy the JAR file to:
-
C:\\IBM\IBMIMShared\plugins\com.ibm.rational.test.lt.provider_<version>
- To automatically enable the correct NTLM version from the recording, In the workbench, click...
-
Window | Preferences | Test | HTTP Test Generation | NTLM v2 | Automatic
When a test was recorded with NTLMv2, the NTLM V2 setting is selected in the test editor, under NTLM Authentication.
Digital certificates overview
The digital certificates feature enables you to run tests against servers that use SSL for applications that require client-side digital certificates to authenticate users.
A digital certificate is a file that binds a public cryptographic key with an identity (a user or an organization). Trusted certificate authorities issue digital certificates, which are then used to authenticate users and organizations for access to websites, email servers, and other secure systems. A certificate store is an archive file containing almost any number of digital certificates, possibly certificates that are issued from different certificate authorities.
To use digital certificates in tests:
- Create a digital certificate store.
- Record a test that requires used a digital certificate.
- Associate a digital certificate with a test for playback.
- Optionally, you can associate the digital certificates in one or more digital certificate stores with a datapool.
Create a certificate store by running the supplied KeyTool command-line program. The program creates a certificate store containing digital certificates.
Record a test that requires using a digital certificate. Specify the certificate and password that to use, and then begin recording the test. Browse the website as you typically would to record a test.
After you have finished recording, open the test for editing. On the Common Options page, under Digital Certificates, click Add. Type the name of the certificate store that you created previously; then select the certificate to use. Save the test. When you run this test, the digital certificate from the certificate store is submitted to the server.
To use a certificate store with a datapool, open the test for editing. On the Common Options page, click Add Datapool. Create a datapool with two columns containing a list of the certificates in the certificate store and a list of passphrases for the certificates. Select Fetch only once per user. Save the datapool. On the Common Options page, under Digital Certificates, click Add. Select the certificate store that you created previously from the Certificate Store column. Insert a Certificate Name for the digital certificate. Highlight this name, and then select Substitute from datapool. Choose the datapool added previously, and then choose the column with the certificate name. Repeat this process to substitute passphrases from the datapool column containing passphrases. Save the test. Add the test to a schedule. When you run this schedule, the certificates from the certificate store are submitted to the server.
Digital certificate creation overview
To use digital certificates to run tests against applications that require client-side digital certificates to authenticate users, work with the appropriate server administrators to determine the types of certificates that you need to create.
In cryptography, a public key certificate is a document that uses a digital signature to bind a public key with a physical identity. These certificates are often referred to generically as digital certificates or client digital certificates. The most common standard for digital certificates is the X.509 standard.
In public key cryptography, each certificate has two associated keys: a public key and a private key. The public key is incorporated into the X.509 certificate and is always available with the certificate itself. The private key is always kept private (meaning, it is never transmitted). For ease of portability, the two keys (and the certificate) can be included in one, encrypted and passphrase-protected, format known as PKCS#12.
In order to verify the authenticity of a certificate, it is digitally signed by another certificate, known as a Certificate Authority (CA). This CA certificate may be one created (and kept secure) by a company hosting a secure application, or it could be created by a company such as Verisign.
When a web application requires digital certificates, an administrator typically creates digital certificates for each authorized user. The administrator digitally signs each certificate using the system CA certificate. These certificates, along with the public and private keys, are distributed to users. Often these keys will be distributed in the PKCS#12 format. Users then import these certificates into their web browsers. When the browser is challenged by the server, it will produce its certificate.
When importing certificates for web applications, select the check box that indicates that the keys be exportable. With this indication, the certificate can be exported to a PKCS#12 formatted file for later use by other programs.
Do not use certificates that are assigned to actual users for performance testing purposes. Use test certificates that do not correspond to actual users.
There are four types of certificates that can be used in testing:
- Self-signed certificates
- Signed certificates
- Certificate authority (CA) certificates
- Unsigned certificates (rarely used)
Self-signed certificates are used when no entity needs to vouch for the authenticity of the certificate. These are the simplest certificates to create and use. Typically, however, a signed certificate is used to represent a particular user.
Signed certificates are used when a certificate needs to be created for and issued to one, and only one, user. Signed certificates are signed by a certificate authority (CA).
Certificate authority (CA) certificates are self-signed certificates used to sign (certify) certificates.
Unsigned certificates are certificates that are neither signed by a CA nor self-signed. Most web applications do not use unsigned certificates.
When you create a self-signed or signed certificate (including CA certificates) you can specify a subject. The subject of a certificate is the set of attributes of an X.500 Distinguished Name that is encoded in the certificate. The subject enables the recipient of a certificate to see information about the owner of the certificate. The subject describes the certificate owner, but is not necessarily unique. Think of subjects as entries in a telephone book; there can be multiple entries for Patel Agrawal, but each entry refers to a different person.
The subject can contain many different types of identifying data. Typically, the subject includes the following:
| Attribute | Example |
|---|---|
| COMMON NAME (CN) | CN=Patel Agrawal |
| ORGANIZATION (O) | O=IBM Corporation |
| ORGANIZATIONAL UNIT (OU) | OU=IBM Software Group |
| COUNTRY (C) | C=IN |
| LOCALITY (L) | L=Bangalore |
| STATE or PROVINCE (ST) | ST=Kanataka |
| E-MAIL ADDRESS (emailAddress) | emailAddress=agrawal@abc.ibm.com |
This information can be typed as one string, using forward slashes to separate the data.
For example, the above subject would be typed as follows:
/CN=Patel Agrawal/O=IBM Corporation/OU=IBM Software Group/C=IN/L=Bangalore/ST=Karnataka/emailAddress=agrawal@abc.ibm.com
Create a digital certificate with OpenSSL
You can use the OpenSSL program to create digital certificates for use with tests.
OpenSSL is available from the OpenSSL Project at http://www.openssl.org/.
- Create a certificate authority (CA).
For the purposes of testing, this CA takes the place of a recognized CA on the Internet, such as VeriSign. Use this CA to digitally sign each certificate that you plan to use for testing.
- Create a certificate request (CSR) file.
The "subject" (-subj) describes the user of the certificate. Enter dummy values as shown. The following command line sets the password for the certificate to abcdefg.
openssl req \ -passout pass:abcdefg \ -subj "/C=US/ST=IL/L=Chicago/O=IBM Corporation/OU=IBM Software Group/CN=Rational Performance Tester CA/emailAddress=rpt@abc.ibm.com" \ -new | waipio.ca.cert.csr - Create a key file, waipio.ca.key, to store the private key.
This removes the password protection from the certificate request file so that you do not have to type the password every time you sign a certificate. Because the password protection has been removed, use the certificate request file for testing purposes only.
openssl rsa -passin pass:abcdefg \ -in privkey.pem \ -out waipio.ca.key - Create an X.509 digital certificate from the certificate request.
The following command line creates a certificate signed with the CA private key. The certificate is valid for 365 days.
openssl x509 \ -in waipio.ca.cert.csr \ -out waipio.ca.cert \ -req \ -signkey waipio.ca.key \ -days 365 - Create a PKCS#12-encoded file containing the certificate and private key.
The following command line sets the password on the P12 file to default. Rational Performance Tester uses password of default for all PKCS#12 files by default.
openssl pkcs12 \
        -passout pass:default  \
        -export  \
        -nokeys  \
        -cacerts  \
        -in waipio.ca.cert  \
        -out waipio.ca.cert.p12  \
        -inkey waipio.ca.key
You now have a CA certificate (waipio.ca.cert), which can be installed into the web server under test and a private key file (waipio.ca.key) that you can use to sign user certificates.
- Create a certificate request (CSR) file.
- Create a digital certificate for a user.
- Create a CSR file for the user. Set the initial password to abc. Optionally, provide an appropriate subject.
openssl req \ -passout pass:abc \ -subj "/C=US/ST=IL/L=Chicago/O=IBM Corporation/OU=IBM Software Group/CN=John Smith/emailAddress=smith@abc.ibm.com" \ -new | johnsmith.cert.csr - Create a private key file without a password.
openssl rsa \ -passin pass:abc \ -in privkey.pem \ -out johnsmith.key - Create a new X.509 certificate for the new user, digitally sign it using the user's private key, and certify it using the CA private key.
The following command line creates a certificate which is valid for 365 days.
openssl x509 \ -req \ -in johnsmith.cert.csr \ -out johnsmith.cert \ -signkey johnsmith.key \ -CA waipio.ca.cert \ -CAkey waipio.ca.key \ -CAcreateserial \ -days 365 - Optional: Create a DER-encoded version of the public key. This file contains only the public key, not the private key. Because it does not contain the private key, it can be shared, and does not need to be password protected.
openssl x509 \ -in johnsmith.cert \ -out johnsmith.cert.der \ -outform DER - Create a PKCS#12-encoded file.
The following command line sets the password on the P12 file to default.
openssl pkcs12  \
        -passout pass:default  \
        -export  \
        -in johnsmith.cert  \
        -out johnsmith.cert.p12  \
        -inkey johnsmith.key
Repeat this step to create as many digital certificates as needed for testing. Keep the key files secure, and delete them when they are no longer needed. Do not delete the CA private key file. You need the CA private key file to sign certificates.
- Create a CSR file for the user. Set the initial password to abc. Optionally, provide an appropriate subject.
Now you can install the CA certificate (waipio.ca.cert) into WebSphere. Optionally, create a user certificate specifically for your web server, and install it into WebSphere.
You can use user certificates individually to record tests. To use the user certificates (johnsmith.cert.p12) during test editing and playback, compress them in ZIP format to a file with the .rcs extension. This creates a digital certificate store. To learn more digital certificate stores, You can also import user certificates into your web browser to interactively test them in your environment.
Create a digital certificate store
The KeyTool command-line program enables you to create a Rational Certificate Store (RCS) file containing digital certificates for use with tests. A Rational Certificate Store (RCS) file is a compressed archive file containing one or more PKCS#12 certificates. You can also use the KeyTool program to remove certificates from a certificate store.
- Type the following command:
java -cp rpt_home/plugins/com.ibm.rational.test.lt.kernel_version.jar com.ibm.rational.test.lt.kernel.dc.KeyTool  \
     --store=file  \
     --passphrase=certificate-passphrase  \
     --add  \
     --remove  \
     --generate  \
     --cert=certificate-name  \
     --subject=subject-name  \
     --ca-store=store  \
     --ca-cert=ca-certificate-name  \
     --ca-passphrase=ca-certificate-passphrase  \
     --sign  \
     --self-sign  \
     --algorithm=algorithm {RSA | DSA}  \
     --list
If a value contains spaces, enclose the value in quotation marks.
Option Description --store Required if adding or removing a certificate. The file name of the Rational Certificate Store (RCS) file. If the specified certificate store does not have the RCS extension, this extension will be added. --passphrase Optional. The passphrase to place on the generated certificate. The default passphrase is default. --add Optional. Adds the certificate to the certificate store. Used with --generate, this generates a certificate and adds it to the certificate store. --remove Optional. Removes the certificate from the certificate store. This option cannot be used with the --add or --generate options. --generate Optional. Generates a certificate. Used with --add, this generates a certificate and adds it to the certificate store. --cert Required. The name of the certificate file to add, remove, or generate. If you are creating a certificate, the file name will be given the P12 extension. --subject Optional. The X.500 Distinguished Name for the certificate. If no subject is specified, a default subject will be provided. --ca-store Required if signing a certificate. The file name of the Rational Certificate Store (RCS) file from which to retrieve the CA certificate. --ca-cert Required if signing a certificate. The name of the CA certificate file to use to sign another certificate. --ca-passphrase Required if signing a certificate. The passphrase for the CA certificate. --sign Optional. Signs the generated certificate using the specified CA certificate. This option cannot be used with --self-sign. --self-sign Optional. Self-sign the generated certificate. This option cannot be used with --sign. --algorithm Optional. This determines the encryption algorithm to use. The default is RSA. The options are RSA or DSA. --list Optional. This prints the names of all certificates in a certificate store to standard output. This list can be used to create a datapool. - Use KeyTool to create and add as many digital certificates as you want. To create a datapool of the names of certificates in the certificate store, run KeyTool again with the --list option. This writes a list of names that can then be imported to a datapool.
You now have a digital certificate store that you can use with tests. Because the KeyTool program has many options, you might want to create an alias or script file to use to invoke KeyTool.
You do not have to use the KeyTool command-line program to create a certificate store. It is possible to use existing PKCS#12 certificates with RPT. PKCS#12 certificates can be exported from a web browser. PKCS#12 certificates encode the private key within the certificate by means of a password.
Do not use certificates associated with real users. Certificates associated with real users contain private keys that should not become known by or available to anyone other than the owner of the certificate. An intruder who gained access to the certificate store would have access to the private keys of all certificates in the store. For this reason, you must create, or have created for you, certificates that are signed by the correct certificate authority (CA) but that are not associated with real users.
Record a test with digital certificates
The test creation wizard starts when you record a test. This wizard combines these actions: recording a session with a web application, generating a test from the recording, and opening the test in the test editor. You can record a test from Internet Explorer (the default for the Windows operating system) or from another browser.
You must use a PKCS#12 digital certificate when recording performance tests.
- Click File | New | Test from Recording.
- In the Create New Test from Recording window, select...
-
Create Test from New Recording | RPT HTTP Recording | Next
- In the list of projects, click the one in which to store this test and related files. The
 icon identifies projects that are suitable for containing tests. Tests stored in other projects will not run.
If you have not yet created a project, the Project Name field displays a default name of testproj, which you can change.
- In the Test file name field, type a name for the test, and click Next. The standard Navigator and the Java. Package Explorer use this name, with extensions. You will also see this name in the Test Navigator.
- In the Enter Client Digital Certificate window enable Use Client Digital Certificate, and then type or browse to the Path to the digital certificate file to use.
- Type the Pass Phrase, or password, for the digital certificate, and then click Finish.
A progress window opens while your browser starts.
The Java JRE that the workbench uses must support the level of encryption required by the digital certificate that you select. For example, you cannot use a digital certificate that requires 256-bit encryption with a JRE that supports only 128-bit encryption. By default, the workbench is configured with restricted or limited strength ciphers. To use less restricted encryption algorithms, you must download and apply the unlimited jurisdiction policy files (local_policy.jar and US_export_policy.jar). You can download unlimited jurisdiction policy files from http://www.ibm.com/developerworks/java/jdk/security/60/. Click on "IBM SDK Policy files," and then log in to developerWorks . Download and extract unrestricted.zip, the 1.4.2+ version of the unlimited jurisdiction policy files. Before installing these policy files, back up the existing policy files in case you want to restore the original files later. Then overwrite the files in RPT_HOME/jdk/jre/lib/security/ directory with the unlimited jurisdiction policy files. By default, this directory is C://IBM/SDP/jdk/jre/lib/security/.
- In the address box for your browser, type the address of the web-based application to test and activate the link.
- Perform the user tasks to test. While you are recording, follow these guidelines:
- Wait for each page to load completely. Waiting will not affect performance results, because you can remove extra "waiting time" (think time) when you play back the test.
- Do not change browser preferences.
- After finishing performing the user tasks, stop recording. To stop recording, close your browser or click on the right side of the Recorder Control view bar. A progress window opens while the test is generated.
On completion, the Recorder Control view displays the message Test generation completed, the Test Navigator lists your test, and the test opens for you to inspect or edit.
Playing back a test with a digital certificate
After you have created a digital certificate store and recorded a test using a digital certificate, you must associate a digital certificate with the test for playback.
You need to have recorded a test using a digital certificate, and you need a digital certificate store file containing one or more PKCS#12 certificates.
To associate a digital certificate with a test for playback:
- Open the test for editing.
- On the Common Options page, under Digital Certificates, click Add.
- Select or type the name of the certificate store file that you created previously. You must type or select the file name. You cannot browse to locate the file. The certificate store must be a Rational Certificate Store (RCS) file. A Rational Certificate Store file is a compressed archive file containing one or more PKCS#12 certificates.
- Select the digital certificate to use, and then click Select.
- When prompted to place the digital certificate in a datapool, click No.
If you add multiple certificates to the Digital Certificates list on the Common Options page, the first certificate that satisfies the request from the server (in the order by which the certificates were entered) will be used during playback.
- Save the test.
When you run this test, the digital certificate from the certificate store will be submitted to the server.
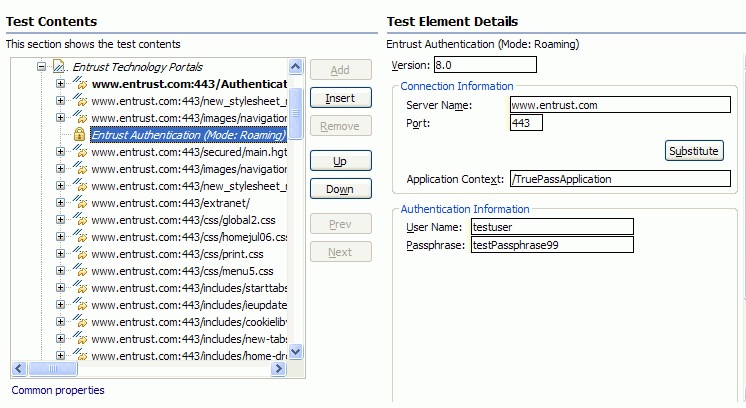
Entrust TruePass authentication overview
Entrust provides digital identity and encryption technologies to governments and private industry. With Entrust TruePass software users can authenticate with secure web applications without installing a digital certificate in their browsers. This makes it convenient for use in kiosks and other public user environments.
You can now run tests against servers that require Entrust TruePass authentication. Roaming mode with TruePass applet version 7.0 and later are supported. Local mode, and versions of the TruePass applet prior to 7.0, are not supported. Recording tests with Entrust TruePass applications works just as regular HTTP recording does.
The Entrust TruePass Authentication object is displayed in the test editor for tests that you record with Entrust TruePass applications. The Version field displays the recorded version number of the Entrust TruePass applet. The Server Name and Port are correlated fields. Click Substitute to use the Data Sources view to change the server or port number for playback. The Application Context displays where the Entrust application is mapped to in the application server. The User Name and Passphrase fields can be substituted with values from a datapool.
Kerberos overview
You can run HTTP tests against servers that use the Kerberos protocol for authentication.
Introduction
Kerberos is a security authentication protocol that requires users and services to provide proof of identity.
Kerberos is supported only for HTTP tests on Rational Performance Tester.
Supported environments
Kerberos is supported on HTTP for web servers running Internet Information Server (IIS) or WebSphere with the Simple and Protected GSS-API Negotiation Mechanism (SPNEGO) trust association interceptor (TAI). Additionally, the Key Distribution Center (KDC) must be part of the Windows Domain Controller Active Directory. Internet Explorer, Mozilla Firefox, Opera, Apple Safari, and Google Chrome browsers are supported for recording tests. Kerberos is not supported on other protocols, environments, or browsers. For example, a KDC running on Linux is not supported.
Tips
For best results when you record tests that use Kerberos authentication, specify the host by name, not by numeric IP address. Also, note that user information is case-sensitive. Specify user information using the exact logon name from the user account in Active Directory. The User logon name field in the properties for the user in Active Directory displays the correct user name in the correct case. To the right of the user name the realm or domain name is displayed in the correct case. For example:
- User ID: kerberostester
- Password: secret
- Realm: ABC.IBM.COM
User logon names of the form ABC\kerberostester are not supported.
Troubleshooting
Kerberos authentication is a complex process. If you encounter problems when you attempt to record and play back tests that use Kerberos authentication, change the problem determination log level toAll and run the tests again with only one virtual user. To learn more about the problem determination log, see the help topic on changing the problem determination level. After running a test, the CommonBaseEvents00.log file on the agent computer contains information that can help you determine why Kerberos authentication failed.
Terms
- Active Directory
- Active Directory is an implementation of Lightweight Directory Access Protocol directory services created by Microsoft for use primarily in Windows environments. The main purpose of Active Directory is to provide central authentication and authorization services for Windows computers. With Active Directory, administrators can assign policies, deploy software, and apply critical updates to an organization.
- Directory service
- A directory service is a software application or set of applications that store and organize information about the users and resources of a computer network.
- Generic Security Services Application Program Interface (GSS-API)
- The GSS-API enables programs to access security services. The GSS-API alone does not provide any security. Instead, security service providers provide GSS-API implementations, typically in the form of libraries that are installed with their security software. Sensitive application messages can be wrapped, or encrypted, by the GSS-API to provide secure communication between client and server. Typical protections that GSS-API wrapping provides include confidentiality (secrecy) and integrity (authenticity). The GSS-API can also provide local authentication about the identity of a remote user or remote host.
- Key Distribution Center (KDC)
- The authentication server in a Kerberos environment is called the Key Distribution Center.
- Lightweight Directory Access Protocol (LDAP)
- LDAP is an application protocol for querying and modifying directory services running over TCP/IP. An LDAP directory tree typically reflects political, geographic, or organizational boundaries. LDAP deployments typically use Domain Name System (DNS) names for structuring the highest levels of the hierarchy. LDAP entries can represent many different types of objects including people, organizational units, printers, documents, or groups of people.
- Simple and Protected GSS-API Negotiation Mechanism (SPNEGO)
- SPNEGO is used when a client application attempts to authenticate to a remote server, but the authentication protocols supported by the remote server are unknown. SNPEGO is a standard GSS-API pseudo-mechanism. The pseudo-mechanism uses a protocol to determine which common GSS-API mechanisms are available, then SPNEGO selects one GSS-API mechanism to use for all future security operations.
- Trust Association Interceptor (TAI)
- The TAI is a mechanism that establishes a secure connection between WebSphere and other application software.
Record Kerberos applications with Internet Explorer
You must configure your browser before you attempt to record Kerberos applications.
The client computer must be a member of the domain for which single sign-on (SSO) has been defined.
To configure Internet Explorer to use Simple and Protected GSS-API Negotiation Mechanism (SPNEGO):
- Log on to Windows with a user ID for the domain for which SSO has been defined.
- Start Internet Explorer.
- Click Tools | Options.
- Click the Security tab.
- Define the site to authenticate to using Integrated Windows Authentication. Depending on your enterprise policy, you define the site in either the Local intranet zone or the Trusted sites zone.
- To define the site in the Local intranet zone, select Local intranet. The instructions that follow assume that you are defining the site in the Local intranet zone.
- To define the site in the Trusted sites zone, select Trusted sites. In the Security Settings for the Trusted sites, click Automatic logon with current username and password, not Automatic logon only in Intranet zone.
- Click Sites.
- Click Advanced.
- Type the URL for the hostname for which you want to enable SSO. For example, type...
-
http://abc.ibm.com.
- Click Add.
- Click OK.
- Click OK again.
- Click the Advanced tab.
- Scroll down to Security, and select Enable Integrated Windows Authentication (requires restart). This option is not available on Internet Explorer 5.5. Integrated Windows Authentication is always enabled on Internet Explorer 5.5.
- Click OK.
- Restart Internet Explorer.
Record Kerberos applications with Mozilla Firefox
You must configure your browser before recording Kerberos applications.
The client computer must be a member of the domain for which single sign-on (SSO) has been defined.
To configure Mozilla Firefox to use Simple and Protected GSS-API Negotiation Mechanism (SPNEGO):
- Start Mozilla Firefox.
- In the location bar, type about:config.
- In the Filter field, type network.n.
- Double-click the network.negotiate-auth.trusted-uris preference. The network.negotiate-auth.trusted-uris preference lists the sites that are permitted to engage in SPNEGO authentication with the browser.
- In the Enter string value window, type a comma-delimited list of URLs of trusted domains.
- Click OK.
- Optional: If the application under test uses the advanced Kerberos feature called Credential Delegation, double-click the network.negotiate-auth.delegation-uris preference. Type a comma-delimited list of URLs of trusted domains. The network.negotiate-auth.delegation-uris preference lists the sites to which the browser may delegate user authentication.
Generating tests that use Kerberos
You must supply your Kerberos user name and password when generating tests that use Kerberos. The test generation process attempts to detect if Kerberos was used when a test was recorded. If the test generation process detects that Kerberos was used when a test was recorded, you are prompted for the Kerberos credentials. The test generation process might not differentiate between Kerberos authentication and NT LAN Manager (NTLM) authentication. In that case, you are prompted for the authentication type and credentials.
- In the Kerberos window, type in the Kerberos Realm name field the Kerberos realm name usedd during recording. If the test generation process cannot determine which type of authentication was used, the Authorization window is displayed, not the Kerberos window. In that case, click the Kerberos radio button before typing the Kerberos realm name.
- In the User name field, type the user name usedd during recording.
- In the Password field, type the password usedd during recording.
The test generation process creates a Kerberos configuration file. The file is krb5.ini and it is stored in the root of the project workspace. This file is required to play back Kerberos tests. Typically, you need to ensure that the workbench computer used to record the test is in the same Kerberos realm as the agent computers used to play back the test. Advanced users and security administrators can edit this file with a text editor to tailor it to a specific test environment.
Annotating a test during recording
You can add comments, add transactions, or change a page name while you record a test. The advantage of adding these elements during (rather than after) recording is that you can place the annotations in the test exactly where you want. In addition, because annotations are part of the recorded test, they are regenerated when you regenerate the test. You can also insert split points into a test during record.
- Start recording the test. The Recorder Test Annotations toolbar opens near the top of the screen.
- Click the appropriate icon.
You can use the Recorder Test Annotations toolbar to add comments, record synchronizations, or take screen captures during the recording.
- To add a comment to the recorded test, click the Insert comment icon .
You are prompted for a comment.
- To add a screen capture to the recorded test, click the Capture screen icon .
Screen and window captures make your tests easier to read and help you visualize the recorded test. You can change the settings for screen captures and add a comment to the image.
- To manually add a synchronization point to the recording, click the Insert synchronization icon .
- To manually add a transaction folder to the recording, click the Start Transaction icon and Stop Transaction icon to start and stop the transaction.
Transactions can be nested.
- To insert a split point into the recorded test, click the Split point icon . With split points, you can generate multiple tests from a single recording, which you can replay in a different order with a schedule.
- When recording an HTTP test, to change the page name, click the Change
page name icon .
In the resulting test, the page element in the test editor uses the new name, however the original name is preserved in the Page
Title Verification Point area so that page title verification points still work correctly.
- To add a comment to the recorded test, click the Insert comment icon
- Close the client program to stop the recording.
- If you inserted a split point during the recording, on the Destination page, in the Test Generation wizard, specify the location for the split test or merge the split recordings together.
The test is generated with the comments, transactions, and page names that you added.
Record sensitive session data
You can keep recording session (.recsession) files to view the contents of a recording or to regenerate tests. However, if a recorded test contains sensitive information, you can choose to obfuscate, or encrypt, text strings in the recsession file.
To protect test data in a recording session file:
- In the Performance Test perspective, click the New Test from Recording toolbar button or click...
-
File | New | Test from Recording
- In the New Test from Recording window, select Create a Test from a New Recording, and select the type of test to create.
- In Recording encryption level, select one of these options:
- Obfuscated: This setting hides text strings to prevent viewing the raw data in recsession files with a text editor outside of the workbench. You can still use recsession file to generate tests and to view recording information.
- Passphrase: This setting uses an AES-128-bit algorithm to encrypt text strings in the recsession files. The encryption strength depends on the length of the passphrase. The recording session file is unrecoverable if the passphrase is lost.
- On the Select Location page, select the project and folder locations to contain the new test, type a name for the test, and click Next.
- If you selected Passphrase, on the Passphrase Protection page, type the passphrase twice in Passphrase and Confirm passphrase. For solid protection, make the passphrase longer than 24 characters if using English words or at least 12 random characters.
- Click Next, and continue the recording session for the type of test that you selected.
Split a test during recording
You can insert split points when you record a test. Split points allow you to generate multiple tests from a single recording that you can replay in a different order with a schedule. To split a test during recording:
- Start recording the test. The Recorder Test Annotations toolbar opens near the top of the screen.
- To insert a split point into the recorded test, click the Split point button. . The Insert Split Point window is displayed.
- Type a name for this section of the test and click OK. You are naming the previous section of the test, not the upcoming section of the test. Repeat this step between recorded user actions as needed to split tests.
- After finishing performing the user tasks in the client program, stop the recorder. You can do this by closing the client program or by clicking the Stop button in the Recorder Control view. If you changed the network settings of the client program as described in step 8, you can revert them
to the default settings before closing the program. The Generate Service Test wizard opens.
- On the Destination page, specify the location for the split test or merge the split recordings together:
- In Location, click Browse to specify the folder where the split tests are generated.
- Type a Test prefix that will be appended to the name of each split test. Leave blank if you do not want the split test names to have a prefix.
- In the split test list, mark the split tests to generate. Click Select All to generate all split tests or Unselect All to clear the list.
- To merge several split tests into a single test, multi-select the tests to merge by holding the Shift key and click the Merge button.
- Click Finish.
The tests are generated using the test names that you specified.
Generating a new test from a recorded session
You can generate a new test from a recorded session. For example, if you accidentally damage a test during editing, or if you want to change a test preference, you can regenerate the test instead of re-recording it. If split points were inserted in the recording, you can choose to generate a single test without split points.
To regenerate a complete test from a recording containing split points:
- In the test navigator, select the .recsession file of the test recording to regenerate.
- Right-click, and then select Generate Test. The Generation Test wizard is displayed.
- If the .recsession file is compatible with multiple test types, select the type of test to generate and click Next. For example, select HTTP Test to generate an HTTP performance test.
- On the Select Location page, select the project and folder where you want to create the test, type a name for the test, and click Next. If necessary, click Create the parent folder to create a new performance test project or a folder
- If the .recsession file contains split points, on the Options page, select Generate test without split points if you want to regenerate the test as a single test.
- Click Finish.
The test is regenerated and opened in the test editor.
Putting test assets under source control
Use version-control software, such as Rational ClearCase or Rational Team Concert, to put test assets under source control.
If you use version-control software, such as Rational ClearCase or Rational Team Concert, put the following assets under source control to share them with the members of your team that use the same source-control product. Put the different project assets in separate folders under the main project.
| Asset | File name extension | Comments |
|---|---|---|
| Projects | .project | This enables the project to be seen and imported by another user. |
| Schedules | .testsuite | |
| Tests | .testsuite | |
| Custom code | .java | Put any custom code that you have written for a test under source control. Put this code under the src folder for the project; for example, in src\custom. This code must be versioned as a single logical unit with the test that includes it (that is, the code and the test should be versioned together). |
| Datapools | .datapool | |
| Locations | .location | |
| Results | .trc*xmi | Results assets, which are not visible in the Test Navigator, contain the data used to create reports and should
be under source control. To see these assets, start the Navigator view, and perform the check out and check in operations from this view.
Store the results in a separate results folder, which you can specify when running a schedule or test. |
Follow these guidelines:
- Turn off the Eclipse prompt that is displayed every time you create a file, asking if you want to add it to source control. To do so, click...
-
Window | Preferences | Team | ClearCase SCM Adapter preferences page | Do Nothing
- During a session, keep schedules and tests checked out for easy editing. When you exit Eclipse, you are prompted to check them back in.
- Put test logs (files with the .execution file name extension) under source control, in the results folder.
- Do not put the class path file under source control.
Organize test assets by type
By clicking an icon, you can view your test assets in a logical order, in separate folders for tests, schedules, results, locations, and datapools. In the Test Navigator view, you can click Show Java Content to see custom code that you created, click Show Missing Resources to view unresolved references, and click Show File Extenstions to view file extensions of test assets.
- On the Test Navigator toolbar, click the Show
the logical test navigator
 icon. To see the Test Navigator view, click...
-
Windows | Show view \ Test Navigator
- Your assets are now grouped logically. To see them, open the appropriate folder.
In the Logical view, only if the asset is available the appropriate folder is displayed. For example, if the Results folder is displayed only after you have executed a test.
Copy test assets with dependencies
You can export test assets, and then import them into another project or workspace without losing any dependencies. Test assets include projects, schedules, and tests. You can export and import test assets to collaborate with other testers.
If you plan to export assets with dependencies, make sure that you have migrated the test assets to the current version of the product before you start to export.
When you copy a test with dependencies, any datapools or custom code referred to by the test are also copied. When you copy a schedule with dependencies, any locations or tests referred to by the schedule are also copied. When you copy results, any schedules or tests referred to by the results are copied.
- In the Test Navigator view, right-click the test assets to export, and then click Export. You can export projects, schedules, tests, and test results with dependencies.
- In the Export window, expand the Test folder, and then click Test Assets with Dependencies. You can export test assets with dependencies if the test assets were created in the current version of the product. You cannot export test assets with dependencies if the test assets were created in a previous version of the product and the assets have not been migrated to the current version of the product.
- Click Next.
- Specify the path and name of the archive file into which you want to export the selected test assets.
- Click Finish. The assets are exported to the archive file. You are prompted if the total size of the test assets is larger than 4 GB, or if any individual test asset file is larger than 4 GB. To copy test asset files that are larger than 4 GB, copy the files manually.
- If the target workspace is on a different computer, transfer the archive file to a location that is accessible to that computer.
- In the Test Navigator view, select the test project into which you want to import the test assets. The target project must have the same name as the source project. Optionally, you can import test assets with dependencies into a workspace where no projects exist. If you import test assets with dependencies into a workspace where no projects exist, the Import wizard creates projects based on information from the archive file. To import test assets into a project with a different name, you must first import the test assets into a project with the same name, and then manually move the assets into the project with the different name.
- Click File | Import.
- In the Import window, expand the Test folder, and then click Test Assets with Dependencies.
- Click Next.
- In the Import with dependencies window, click Browse, and then select the archive file. The test assets are displayed in the File contents list.
- Click Finish to import the test assets with dependencies from the archive file into the target project. If a file that you are attempting to import already exists in the target workspace, you will be prompted to choose whether to overwrite the file. You can also choose to overwrite all files that already exist in the target workspace, or not to overwrite any files that already exist in the workspace. If you choose to overwrite all files that already exist in the target workspace, you will be prompted again if the import process encounters a .classpath or .project file in the source archive file.
Copy projects
You can export a test project from a workspace and import it into another workspace.
The following instructions describe an older method of copying a test project. The following instructions are included to show an alternate way to copy a test project.
If you export test assets to an archive file and then import them to another project, ensure that both project names are the same. Otherwise, you might not be able to locate your imported test assets.
- Start Rational Performance Tester, and select the source workspace.
- Export the test project to an archive file. Datapools can be located either in the same project as the tests that use them or in different projects. Be sure to export all the datapools that the exported tests require.
- If the target workspace is on a different computer, transfer the archive file to a location that is accessible to that computer.
- Start RPT, and select the target workspace.
- Click File | Import. Expand the General folder, and click the Existing Projects into Workspace icon; then click Next.
- Click Select archive file, and then click Browse to select the archive file. Click Finish to import the source project from the archive file into the target workspace.
- Optional: If the imported project contains custom code or tests that have been run, you might need to change the Java. build path. The following examples are cases that might require a change to the Java build path:
- The Java build path was manually changed in the project from which it was exported. In this case, the same changes need to be made in the imported project. While importing, you are asked whether to overwrite the class path file, which stores the Java build path for project. Answering Yes reduces the likelihood that the build path will need to be changed.
- The project was imported onto a different computer with a different Java installation configuration. In this case, missing libraries must be removed from the build path.
- The project was imported into a workspace on a different disk drive. When you are asked whether to replace the class path file, answering No reduces the likelihood that the build path will need to be changed.
For instructions on changing the build path, see the Java Build Path page.
If you encounter errors after importing a test project or when using an existing workspace with a new version of the product, you might need to delete .java files from the src folder in the workspace:
- Click...
-
Window | Open Perspective | Resource
- In the Navigator window, expand the test project folder, and locate the src folder.
- Delete all .java files in the src folder, except for those that contain custom code.
- Return to your test perspective: Click...
-
Window | Open Perspective | Performance Test
Edit tests
After recording a test, edit it to include datapools (to provide variable data rather than the data that you recorded), verification points (to confirm that the test runs as expected), and data correlation (to ensure that returned data is appropriate for the corresponding request). You can also add protocol-specific elements to a test. When you edit a test, the modified items appear in italic type. The italic type changes to regular type after you save the test.
Edit HTTP tests
After recording a test, edit it to include variable data (rather than the data that you recorded), verification points (to confirm that the test runs as expected), transactions, conditional processing, and custom code.
Redirection support for HTTP tests
When you run HTTP tests, redirect requests are followed automatically, which supports common usage patterns, such as load balancing.
HTTP redirect responses are responses to requests with status codes in the 300 family, which indicate that the requested content is found at a different location. Redirect responses include HTTP status codes such as 301 Moved Permanently and 302 Found. Some HTTP applications redirect clients to a specific URL, but the ultimate response to the client request can be handled by one of several servers to balance the load that each server handles. For example, a request that is sent to...
-
http://www.example.com/
...might be redirected to...
-
http://www-1.example.com
...or...
-
http://www-2.example.com
...depending on traffic and load conditions.
Both expected redirect and unexpected redirect responses are supported when you run tests. Expected redirect responses occur when you record tests. Unexpected redirect responses are received from the server when you run tests, but the responses are not present in the recorded test.
Expected redirect responses are handled by automatic data correlation. To automatically correlate host names and port numbers, click...
-
Window | Preferences | Test | Test Generation | HTTP Test Generation | Data Correlation
... and then select...
-
Automatically correlate URL pathname if redirected by response check box
This option is selected by default.
Unexpected redirect requests are followed until an HTTP status code that is not a redirect response, such as 200 OK, is returned by the server, or until the maximum number of redirect responses has been reached. By default, the maximum number of redirect responses to follow is 10. When a 200 OK response is received, references that use the data in the final response are created.
Server access configurations are updated dynamically for unexpected redirect responses. For example, for a Config_1 server access configuration, where the host is abc.example.com and the port is 80, if a request that uses that configuration is redirected to port 8080 on the xyz.example.com host, all subsequent requests in the test that use the same configuration use port 8080 on the xyz.example.com host.
Verification points in a request are applied to the final destination. You can set a ResponseCode verification point in a request so that an unexpected redirection can be handled appropriately. If you set an exact ResponseCode verification point, it fails when a redirection occurs. A relaxed verification point also fails if the status codes in the 300 family are not part of the relaxed code list.
HTTP test editor overview
With the test editor, you can inspect or customize a test that you recorded.
The test editor lists the HTTP pages for a test, by title. The following example shows the visitIBM test, which was generated from a recording of these tester actions: type...
-
http://www.ibm.com...
...under Shop for select Software, stop recording.

Test Contents displays the hierarchy of the HTTP pages for the test.
Test Element Details displays common options and specific information about the HTTP protocol. The HTTP options apply to every page an HTTP test.
The Test Variables are listed at the top of the Test Contents area. These variables, which are the host names and ports in the test, are automatically created when the test is generated. Click a variable name to see where it is used in the test. By changing these variables, you can share or reuse the test for different configurations and web hosts. User-defined variables are also listed at the top of the Test Contents area.
When you expand a test page, you see a list of the requests for the page, in separate folders, with names that are full web addresses minus the initial http://. The following example shows the expanded first page of the visitIBM test with the page selected in the Test Contents area. In this example, the settings displayed in the Test Element Details apply to the selected page.
The primary request, listed in bold, is the basis of the page title. The primary request can be the web address that the tester typed into the browser, a hyperlink that was clicked, or a web address to which the tester was redirected from another page request. In the example, the primary request shows that the tester was redirected to www.ibm.com/us/ from the initial page request (www.ibm.com). If the primary request does not return a page title, the test generator creates a unique name for it from the first node of the web address.
Requests highlighted in yellow contain...
| Datapool candidate | Values the test generator determines is likely to be substituted for by values in a datapool column. For example, usernames, passwords, or search text. |
| Correlated data | Response data, and subsequent request data, the generator determine needs to be associated. For example if profile information is returned after user vuser1 logs on, the test generator automatically correlates the vuser1 with the a name, address, and phone number. If we replace vuser1 in the recorded test with the user ids in a datapool, because the test correlates the data, each virtual user is assigned the proper name, address, and phone number. |
To see an illustration of color coding in performance tests, click...
-
Window | Preferences | Test | Test Editor | Colors and Fonts tab

When you expand a request, you see the Response data for the request. As shown in the following example, requests can also contain Connection data. Because the response is selected in the Test Contents area, the Test Element Details area displays the response data for this request.

The Response data inside each request shows the data that the web server returned to the browser based on that request. Collectively, the requests listed inside a page are responsible for everything that was returned by the web server for that page.
Select multiple responses to display a table under Test Element Details that shows the following elements for the selected responses:
- Response code
- Response reason
- Response size
- Binary indicator
- Parent request
- Content verification point
- Response code verification point
- Response size verification point
Click Add to add child elements to the selected test element. Alternatively, you can right-click a test element and select an action from a menu. The choices that you see depend on what you have selected. For example, after you select a test, you can add a new page, a block of custom code, or an IF condition. After you select a page, you can add a request or an IF condition.
The Insert push button works similarly. Use it to insert a sibling element before the selected element.
The Remove, Up, Down push buttons, and some Add choices (HTTP Page, HTTP Request, Basic Authentication) are primarily for use with tests that you write by hand; these actions or choices are likely to break a generated test.
A portion of the test editor can occasionally be obscured.
To see the obscured area, move the cursor over one of the blue lines
until it changes to  , and drag up or down while holding the left mouse
button.
, and drag up or down while holding the left mouse
button.
To resize the Test Editor window, do one of the following:
- Click Ctrl+Alt+> or Ctrl+Alt+< to enlarge or reduce the window.
- Hover at the left side of the Test Element Details area.
When you see a vertical blue line, right click the line and select a size ratio from the menu.

Specify the number of allowable URL redirects during test runs
When you run a test in a load-sharing environment, an unexpected redirection loop might occur during HTTP processing. An unexpected redirect response occurs when an HTTP request that normally returns a specific document redirects the browser to another location.
When the system detects an infinite loop of redirects, the infinite loop is broken, an error verdict for the request is issued, and the following message is displayed:
Infinite redirection loop detected getting URL n. If this is expected and understood, increase RPT_VMARGS rptMaxRedirection parameter. Redirected history (from the first URL to the current one).
The default number of redirects is set at 10; however, edit the maximum number of redirects by updating the RPT_VMARGS argument in the .DrptMaxRedirection setting.
To modify the number of allowable redirects before an error is reported, complete these steps on each agent computer.
- In the Test Navigator, expand the project until you find
the agent computer at the deployment location to change. Agent computers are represented by the
 icon.
icon.
- Right-click the agent computer, and then click Open.
- Under Property Groups, click General Properties, and then click Add.
- In the New Property window complete these steps:
- In the Property Name field, type RPT_VMARGS.
- In the Operator field, confirm that the operator is =.
- In the Property Value field, type .DrptMaxRedirection=n, where n is the maximum number of redirects that can occur before the error message is displayed, and then click OK.
- Only one RPT_VMARGS argument is allowed for each agent computer location. If multiple RPT_VMARGS style properties are required, you must separate-Dname=Value with a space. For example...
-
-DrptMaxRedirection=15 -DanotherProperty=Value
The following New Property window sets the maximum number of redirects to 15:
Cutting and pasting in tests
You can cut, copy, and paste in HTTP tests.
The test editor supports the standard cutting, pasting, and copying of test elements by using the Edit menu or keyboard shortcuts. Test elements include HTTP pages, HTTP page elements, and requests. If you cut a test element, that element is not actually removed from the test until you next cut or paste. If you copy a test element, that element is not actually copied until you next paste. For this reason, do not close the test from which you copy a test element until you have pasted the test element into another test. If you copy a test element from a test, and then close the test, nothing is pasted when you attempt to paste the test element. When you cut an element, it becomes unavailable (gray) and is displayed in italics. When you paste an element, it is displayed in italics until you save the test.
Cutting and pasting can break correlations between test elements. For example, it is possible to cut a test element containing a reference that a later portion of the test requires. When you cut, copy, or paste HTTP test elements, you are not warned of potential data correlation problems. You must ensure that the editing operation does not cause a data correlation error.
Defining performance requirements in tests
You can define performance requirements for elements in a test. These requirements specify acceptable thresholds of performance and validate service level agreements.
You can set performance requirements on protocol-specific test elements, on schedule elements, on data created by custom code, and on collected resource usage data. You define a performance requirement as standard or supplemental. A standard performance requirement is a requirement that you determine is significant enough to cause the entire run to be declared a failure if it fails. A supplemental performance requirement, although important, is not significant enough to cause the run to fail. For example, a supplemental performance requirement might be a request from development to validate a very specific data item provided by WebSphere PMI monitoring.
To define a performance requirement for the elements in a test:
- In the Test Navigator, browse to the test and double-click it. The test opens.
- In the Test Contents area, select the page or the request that will have the requirement. You can select multiple pages or multiple requests.
- In the Test Element Details area, click the Advanced tab, and select...
-
Enable Performance Requirements
A table of performance requirements that apply to the page or to the request is displayed.
- Click the performance requirement to define, and add a definition, as follows:
Option Description Name You can change the name of a performance requirement to improve readability. However, changing a requirement name causes a mismatch between the Performance Requirements report, which uses the changed name, and the other reports, which use the default name. Therefore, when you change a requirement name, be sure to keep track of the original name. Operator Select an operator. Value Type a value. Standard Select to make the requirement standard. A standard requirement can cause a test to have a verdict of fail. Clear to make the requirement supplemental. In general, supplemental requirements are used for requirements that are tracked internally. A supplemental requirement cannot cause a run to fail, and supplemental results are restricted to two pages of the Performance Requirements report. - Optionally, apply the defined requirement to other test elements:
- In the Test Contents area, select the test elements that will have the requirement. The elements must be of the same type, for example, all page elements.
- In the Requirements table, right-click the requirement row, and select Copy Requirements.
- Optionally, select Hide Undefined Requirements to hide the shaded rows, which indicate that a requirement is not defined, and improve readability.
- Select a requirement and click Clear to remove its definition. The requirement is still available and can be redefined.
- After you have defined a number of requirements on test elements, you might want to see all of the requirements defined for the test. To do so:
- In the Test Contents area, click the name (root) of the test.
- In the Test Element Details area, click the Performance Requirements tab. The Performance Requirements page displays a summary of the performance requirements defined in the test.
- To navigate to the original requirement definition, double-click the requirement row.
Example
You can define performance requirements in a test or in a schedule. When you define a requirement in a test, the requirement is defined individually for each test element.even if you select multiple test elements and apply the requirement to all of them at the same time. When you define a requirement in a schedule, the requirement is applied to the aggregate of test elements.For example, assume that you select every page in a test and define this requirement: Average response time for page [ms] [For Run] must be less than 5 seconds. This means that if one page in the test has a response time of 6 seconds, the requirement on that page fails. The other pages, which have a response time of less than 5 seconds, pass.
Assume that you open a schedule and define this requirement: Average response time for all pages [ms] [For Run] must be less than 5 seconds. This measures the average response time for all of the pages. One page can have a response time of 30 seconds, but if enough pages have a response time low enough to counter the negative effect of that one page, the requirement passes.
Add an authentication folder
Web application servers can include an option to force a login. You might have recorded a test with this option disabled but want to run the test with the option enabled. Adding an authentication folder to the appropriate test request lets you do this without recording the test again.
To add an authentication folder to a request:
- In the Test Navigator, browse to the test and double-click it. The test opens.
- Click the request that will contain the authentication folder.
- Click Add and select Basic Authentication. A folder named Authentication is added to the request, and the Test Element Details area displays the Userid, Password, and Realm fields.
Verify expected behavior
To check whether an expected behavior occurred during a run, you add verification points. When you run a test containing a verification point, an error is reported if the expected behavior did not occur. When global verification points are disabled (the default), you can enable verification points for a specific test.
Enable verification points globally: Click...
-
Window | Preferences | Test | Test Generation | HTTP Test Generation
Specify the expected page title
Page title verification points verify that the primary request for a page returns the expected page title. If the returned title is unexpected, the test log reports a failed verdict event. Although the comparison is case-sensitive, it ignores multiple white-space characters (such as spaces, tabs, and carriage returns).
- In the Test Navigator, browse to the test and double-click it. The test opens.
- Right-click the test name or a page, and select Enable Page Title VPs. Your choice determines whether the verification point is added to all pages in the test or to one page.
- Click the page title to display the editing fields in the Test Element Details area.

- Ensure that the Expected page title field shows the string that you expect to be included in the response. Although you can change the string, the value listed is what was returned between the <title></title> tags during recording.
You can also change the preferences so that Page Title verification points are set automatically. To do this:
- Change the HTML page title: Click...
-
Window | Preferences | Test | Test Generation | HTTP Test Generation | Verification Points | HTML Page Title
This changes subsequent tests that you record.
- Optionally, regenerate existing tests with the changed preference.
Specify the expected response code
Response code verification points verify that the response code matches an expected value. If the returned code is does not match, the test log reports a failed verdict event. You can specify an exact response code or verify that the code is within the same category. You can either change the preferences so that Response Code verification points are set automatically for all the tests or you can configure each test setting. To set response code in the preferences:
- Change subsequent tests that you record: Click...
-
Window | Preferences | Test | Test Generation | HTTP Test Generation | Automatically include verification point of | HTTP Return Code | Relaxed or Exact
This changes subsequent tests that you record.
- Optionally, regenerate existing tests with the changed preference,
To set response code setting for a test:
- In the Test Navigator, browse to the test and double-click it. The test opens.
- Right-click the test name, a test page, or a request, and select Enable Response Code VPs. Your
choice determines whether a verification point is added to every request in the test, to every request in a page, or to a particular request.
The following figure shows a response code verification point within
a test:

When you modify a test, the modified items appear in italic type. The italic type changes to regular type after you save the test.
- Click the verification point to display the response code
editing fields in the Test Element Details area.
- To disable an individual response code verification point, clear the Enable verification point field.
- From the Select matching method list, click an option to indicate how closely the returned response code
must match the recorded value.
Option Description Relaxed If the recorded response code is 200, 201, 202, 204, 206, 301, 302, or 304, then a returned response code of any of those values causes the verification point to pass. If the recorded response code is any other value, it is the same as if you had specified an exact match. Exact An error is reported if the returned response code does not match the recorded value.
Specify the expected response size
Response size verification points verify that the number of bytes returned in a response is what you expected. If the byte count does not match, the test log reports a failed verdict event. You can specify an exact response size or verify that the byte count is within a range.
- In the Test Navigator, browse to the test and double-click it. The test opens.
- Right-click the test name, a test page, or a request, and select Enable Response Size VPs Your
choice determines whether the verification point is added to all test pages, to a page in the test, or to a particular request. The following figure shows a response size verification point within a test:

When you modify a test, the modified items appear in italic type. The italic type changes to regular type after you save the test.
- Click the verification point to display the response size
editing fields in the Test Element Details area.

Responses to HEAD requests, by definition, have no contents; the size is always 0.
- To disable an individual response size verification point, clear the Enable verification point field.
- From the Select matching method list, click an option to indicate how closely the response size that is returned in the page request must match the recorded response size.
- The default matching method for a primary request is Range, with a percentage adjustment based on the value in the field on the right. (You can change the percentage basis as well as the matching method.) When the test is run, an error is reported if the actual response size falls outside the adjusted range.
- For other requests, the default matching method is Exact. When the test is run, an error is reported if the response size does not exactly match the expected size.
You can also change the preferences so that Response Size verification points are set automatically. To do this:
Specify the expected content
Content verification points verify that the response contains.or does not contain.an expected string. If the content returned is unexpected, the test log returns a failed verdict event. You can create a content verification point from specific response text.
To create a content verification point from a response or a portion of a response:
- In the Test Navigator, browse to the test and double-click it. The test opens.
- Click the response containing the contents to use for the verification point. If you do not see the contents, press Ctrl+Shift+Spacebar in the Test Element Details area, under Content.
- Select the content for the verification point, right-click, and select Add to Content Verification Point. The content verification point and the selected string are displayed in the Test Contents area.
- Edit the new content verification point as needed. You can use the Add, Insert, and Remove buttons to manipulate content verification points and content verification point strings. After you select a content verification point or content verification point string in the editor, you can also edit the verification points and strings
by using the controls in the Test Element Details area.
For example, you might want to change part of the hard-coded response contents to a regular expression. To substitute from any data source
that exists in the test, select the entire string or a portion of the text string, and then right-click, and select Substitute.
Responses to HEAD requests, by definition, have no content. Therefore, a content verification point that attempts to match a string in a response to a HEAD request will fail.
Specify the expected content for multiple requests
Content verification points verify that the response contains.or does not contain.an expected string. If the content returned is unexpected, the test log returns a failed verdict event. You can advance through a test and create content verification points in multiple requests, or in the entire test.
To create content verification points in multiple requests:
- Adjust the verification point scope. The default is to create content verification points in primary requests only and to skip responses with binary contents. Click...
-
Window | Preferences | Test | Test Editor | HTTP Test
Select or clear Skip responses with binary content and Create only in primary responses as needed.
- In the Test Navigator, browse to the test and double-click it. The test opens.
- Right-click the test name, a test page, or a request, and select Verification Points | Enable Content VPs. Your choice determines whether the verification point is added to all test pages, to a page in the test, or to a particular request. Confirm to modify the test elements, and click OK.
- In the Create/Enable Content Verification Point window, set Verification fails if to either At least one of the checked strings is found or to None of the checked strings are found.
- In the list of strings in the Text column, select the strings that the content verification point should
search for.
- If you are editing an HTTP test, the window lists user-defined strings.
- If you are editing a Siebel HTTP test, the window also lists strings of interest in Siebel applications.
- To create a new string from scratch, click New String. To create a new string by editing another string, click it and click Duplicate. To edit an existing string, click Edit. To remove a string, click Remove.
- Optionally, insert a regular expression into the verification point. The most common regular expressions are * for any number of characters, ? for any single character, and \ for an escape to enter literals. For detailed information on Java. regular expressions, see the Java documentation.
- The Create/Enable Content Verification Point window advances through the requests. The preference settings that you selected in the first step determine whether secondary requests and requests containing binary data are affected. Select one of the following:
By default, a string that you set for a content verification point is available to all tests. To make the string available only to a specific test, or to clear the list of strings displayed when you create a verification point, change the preferences in the Content Verification Points section of Window | Preferences | Test | Test Editor | General.Option Description Skip Advances to the next request without inserting a verification point in the current request. Enable Inserts a verification point into the current request and advances to the next request. Enable All Inserts a verification point into every test request (if the scope is the test) or every page request (if the scope is a page).
Specify error-handling behavior
You can specify how error conditions are handled when running a test or schedule. Error conditions include verification point failures, connection failures, server timeouts, custom code alerts, and problems with data correlation. You can specify error-handling behavior for schedules, tests, and test elements.
- In the Test Navigator, browse to a test or schedule, and double-click it. The test opens.
- In the Test editor, complete one of the following steps:
- To specify error-handling behavior for a request or other elements in the test hierarchy, in the Test Contents section, select the element and in the Test Element Details section, click the Advanced tab.
- To specify error-handling behavior for an element such as a connection, verification point, substitution, or reference, select the element, and then click Change. Skip to step 5.
- To specify error-handling behavior for a datapool that is associated with a test, on the Common Options page, select the datapool, and then click Datapool Properties. Click Change. Skip to step 5.
- Under Error Handling, expand Click to show conditions. The error condition table is displayed. The error condition table shows all possible conditions that can be handled by the protocols in the test or schedule.
- Select the check box next to the condition for which to specify behavior. A window opens where you can specify the action to take and the message to log when the condition occurs.
- Select the action to take when the specified condition
occurs.
Option Description Continue Click to continue running the test. Exit transaction Click to exit a transaction when the specified condition occurs. Select the Innermost or Outermost transaction, or type the name of a transaction. Exit loop Click to exit a loop when the specified condition occurs. Select the Innermost or Outermost loop, or type the name of a loop. Continue to next iteration of loop Click to continue to the next iteration of a loop when the specified condition occurs. Select the Innermost or Outermost loop, or type the name of a loop. Exit test Click to exit the test when the specified condition occurs. Exit user Click to stop the virtual user that encounters the specified condition. Terminate run Click to stop the run when the specified condition occurs. - Optional: Type a message to be written to the test log when the specified condition occurs.
- Click OK.
Example
To stop running a schedule when a substitution failure occurs in data correlation, select the Substitution Failure check box. Click Stop schedule, and then click OK.The error-handling behavior that is specified closest to where an error occurs takes precedence. If a specific request is set to continue if a substitution fails, and the schedule is set to stop if a substitution fails, then the schedule will continue running if the substitution fails in that request.
How loops affect the state of vusers
If verification points fail unexpectedly during a run, the cause might be that vusers in loops do not maintain their original state. To enable each virtual user to enter the loop in the original state, you can modify the test's HTTP options or add custom code.
By default, the cookie cache for a virtual user is not reset during a test run. This is consistent with a browser's behavior. If a test or schedule contains loops, and a web server sets a cookie during the first iteration of the loop, that cookie is "remembered" on subsequent iterations.
However, in certain instances, you might want to clear all cookies cached for a particular virtual user. For example, if you want each iteration of a loop to appear as a new user, you must reset the cache. If you do not, although the test completes, verification points that you have set within the test may fail.
There are two ways to reset the cookie cache, and each way has different effects.
To reset the cookie cache when looping in the schedule, or when the test follows another test in the schedule, use the following method. This resets the cache whenever the test is entered. Even if your tests do not loop, use this method if you are running back-to-back tests or Siebel tests.
- In the Test Navigator, browse to the test and double-click it. The test opens.
- On the HTTP options page, select Clear cookie cache when the test starts.
To reset the cookie cache from one loop iteration to the next when you have put a loop around the entire contents of the test, and the loop is inside the test, add custom code to the test and call an API, as follows:
- Run the test or schedule to add the current Java. libraries to the class path.
- Open the test and select the test element located at the point where you want the cookie cache to be reset. Typically, this is at the end of the loop.
- Click Add or Insert and select Custom Code. Add appends the custom code to the bottom of the selected element (test or test page). Insert adds the custom code above the selected page or page request.
- Add the following Java import statement: Import com.ibm.rational.test.lt.execution.http.util.CookieCacheUtil;
- Add the following Java code inside the exec method: CookieCacheUtil.clearCookieCache(tes);
Example
The following example shows a custom code addition that resets the cookie cache. The lines that you add to the generated custom code template are shown in bold:package test;
import com.ibm.rational.test.lt.execution.http.util.CookieCacheUtil;
import com.ibm.rational.test.lt.kernel.services.ITestExecutionServices;
public class Class1131739398417 implements
com.ibm.rational.test.lt.kernel.custom.ICustomCode2 {
public Class1131739398417() {
}
public String exec(ITestExecutionServices tes, String[] args) {
CookieCacheUtil.clearCookieCache(tes);
return null;
}
}
Split a test
After recording a test, you can split it into smaller tests. By splitting a test, you can create modular building blocks of smaller tests and combine them to make bigger tests. The original test is unchanged. With the test-splitting capability, you can record a relatively long scenario with many functional steps against an application and then, in the editor, dissect the test into many smaller test segments, which you can run in various orders in a schedule. The wizard determines which variables need to persist among the split tests and creates the linkage so that you do not have to write custom code.
- In the Test Navigator, browse to the test and double-click it. The test opens.
- Select one or more elements in the test for splitting into a new test. You must select contiguous elements. You can select elements, except for variable containers, that are immediate children of the root node of the test.
- Right-click the selected elements, and then select Save Selection As New Test.
- In the Save Selection as New Test window, type a file name for the new test, and optionally provide a description
or comment for the split test.
- Select Also use description text for comment at beginning of each test to add the Description/comment field as a comment at the beginning of the split test.
- Select Mark the selection in the editor to mark the selection in the original test with marks of the form [N-> where N is a positive integer that corresponds to the number of saved selections. For example, the first time you save a selection as a new test, the selection in the original test is marked with this identifier:[1->. If you save three selections, the original test is marked with these identifiers: [1->, [2->, and [3->.
- Click Next.
- Optional: On the next page of the Save
Selection as New Test wizard, examine the changes to be performed as a result of the split. Typically, you leave Link
tests through variables and HTTP Specific Changes selected;
clearing these options might make a split test unusable or produce unpredictable results. However, you can clear specific Link
tests through variables boxes if you do not want certain
data to be correlated between the tests.
- Click Finish.
The new test is created from the selected elements. The test variables that are created by splitting a test are listed in the Variables Created by Split Test container in the new test. For best results, open the Variables Created by Split Test container in the new test and make sure that the variables are created and assigned with values by a test that is executed before the newly split test.
The original test is marked if you select the Mark the selection in the editor option. To remove the marks, right-click the selected elements in the original test and select Clear Range. You are also prompted to delete the new test. Click Yes to delete the new test or No to preserve it.
Example
Be aware of the choices that you make when you split a test and rearrange the split tests in a schedule. Assume that the visitIBM recorded test contains the following actions:
- Logging on to a server.
- Create an entry on the server and removing the entry.
- Edit an entry, validating that the change occurred, and restoring the entry.
- Logging off of the server.
- Open visitIBM and select the logon actions. Name the new test Logon, which contains the Logon actions.
- Select the create actions. Name the new test Create.
- Select the edit actions. Name the new test Edit.
- Select the logoff actions. Name the new test Logoff.
Be aware, however, that when you split the tests, the Create test might have initialized variables that the Edit test uses. Therefore, if you reverse the order during the run (that is, run the Edit test before the Create test), make sure that the variables that the tests share are initialized and set correctly.
Split a test page
You can split an HTTP page into two contiguous pages. The page title, think times, primary request, and delay are automatically recalculated for the affected pages. Customized page titles, think times, primary requests, and delays revert to the default values.
When you inspect a test, you might notice that some page boundaries are not at the correct place. A common cause is that, during recording, you did not wait for the page to fully load. Although you can rerecord a test, if your test is long or complex, it is often easier to split the incorrect page when you edit the test, rather than to rerecord the entire test.
- In the Test Navigator, browse to the test and double-click it. The test opens.
- In the test, expand the page to split.
- Right-click on the request where you want the split to occur, and select Split page here.
- In the Split HTTP Page window, you can change the location of the split by clicking on another page element. You can also create a new page, combine the elements above the insertion point with the previous page, or combine the elements below
the insertion point with the next page.

- To split the page, click Finish.
You can also set preferences so that new pages are generated when the delay exceeds a specified value: Click...
-
Window | Preferences | Test | Test Generation | HTTP Test Generation | Protocol tab
Enter a value for Generate new page if delay between requests is >.
Merging test pages
You can two or more contiguous HTTP pages into one page. The page title, think times, primary request, and delay are automatically recalculated for the affected pages. Customized page titles, think times, primary requests, and delays revert to the default values. When you inspect a test, you might notice that some page boundaries are not at the correct place. These extra pages are caused by a variety of reasons. For example, during recording you might hover over a "hotspot" that fetches images as you move on and off of the spot. In this case, some pages in the test, which properly belong to the previous page, contain only .gif files. Although you can rerecord a test in the hope of fixing this problem, if your test is long or complex, it is often easier to merge the incorrect page when you edit the test, rather than to rerecord the entire test.
- In the Test Navigator, browse to the test and double-click it. The test opens.
- Select the pages to merge (the pages must be contiguous) and select Merge Selected Pages
- The Merge Pages window lists the pages that you are merging. From this list, select the page that will contain the other pages.
- Optionally, click Keep empty pages to keep the same number of pages in the test. For example, if you select this option and merge two pages, one page will contain all of the requests and the other page will be empty.
You can also set preferences so that new pages are not generated when the think time is less than specified value: Click...
-
Window | Preferences | Test | Test Generation | HTTP Test Generation | Protocol tab
Enter a value for...
-
Do not generate new page if think time is <
Disable and enable secondary HTTP requests
Secondary requests are all requests within a page other than the primary request.
- In the Test Navigator, browse to the test, and double-click it. The test opens.
- In the Test Element Details area, click the HTTP Options tab.
- At Secondary request behavior, click Modify.
- In the Enable or Disable Secondary Requests box, select one or more of the following options:
Option Description All secondary Select all secondary requests. Images Select all secondary requests that are image-related. Includes all secondary requests where the Content-type header of the response contains image or the path of the URI of the request contains a .gif, .png, .jpg, .bmp. or .tif extension. Host/Port based Select all secondary requests that use the specified host:port pair for connections. A list of host:port pairs in the test is displayed. User-defined Select all secondary requests where the user-specified string, or a string matching a user-specified regular expression, is in the request URI. 
- Selecting boxes under...
-
Do not disable secondary requests
...leaves them enabled. If you have extensive knowledge of the system under test and have already done some troubleshooting, you might clear these boxes in the following cases:
- With responses containing set-cookie headers: If the cookies set in a particular request are not important to the remaining requests, you may disable them. This decision requires you to know how the system under test uses cookies.
- With data sources used by enabled requests: If a test contains superfluous data correlation, you may disable it. This decision requires you to know how the system under test uses data correlation.
- Select Disable or Enable to modify the secondary requests. The requests are now enabled or disabled.
Reusing tests on different hosts: Server connection variables
Your tests represent a significant investment in time and effort. You can share or reuse them for different configurations and web hosts by changing the variables for the host name and port.
Before you begin, confirm that test generation preferences are set to support data correlation. Click...
-
Window | Preferences | Test | Performance Test Generation | HTTP Test Generation | Correlation tab
... and verify that Automatically correlate host and port data is selected. If not, select that option and regenerate the test. Perhaps you develop the tests on a lab computer and then they want to run them on a production server. If the application that you are testing is identical on both computers, you can change the host name and reuse the tests on the production server.
To change the name of the host or proxy server on all requests in a test:
- In the Test Navigator, browse to the test and double-click it. The test opens.
- Expand the Test Variable section at the top of the test, and click the Server Connection variable containing the hostname to change.
- In the Test Element Details area, perform the following steps:
- Type the new host name in the Host field.
- Optional: Type a new port number in the Port field.
To change the host names and ports of many tests, put the server connection variable in a datapool and associate the datapool with the tests. When you change the name and port in the datapool, that change is propagated throughout the tests in the datapool.
Converting tests to use SSL connections
You can convert a test that was recorded without SSL connections to use SSL connections. If you develop performance tests on a lab computer that does not use secure connections, and then you must run the tests against a production server that requires SSL connections, you can add SSL to the server access configurations and reuse the tests.
To convert a server access configuration to use SSL for all associated connections:
- In the Test Navigator, browse to the test, and double-click it. The test opens.
- Expand the Test Resources section at the top of the test.
- Right-click the server access configuration that corresponds to the server where you want to add SSL, and then click Add | SSL. An SSL element is added as a child of the server access configuration.
- In the Test Element Details area for the server access configuration, type a new number in Port if the server uses a different port for SSL communication. If the port number is correlated with a server connection variable, select the port number, right-click, and select Go To | Variable: variable_name to navigate to the variable. Change the port number in the server connection variable.
- In the Test Element Details area for the SSL element, make a selection in Protocol, and type or select a name in Cipher.
- Repeat the same steps for all server access configurations to convert to use SSL.
When you run the test, the connections that are associated with the server access configurations use SSL.
View a test in the Protocol Data view
The Protocol Data view enables you to inspect the actual test data. You can see requests, response headers, and response contents, as well as the rendered images that you see through your browser. Use this view to obtain the information you need to add custom code or to manually correlate data. This view also lets you compare the recorded data with the data retrieved during a run.
- In the Test Navigator, browse to the test and double-click it. The test opens.
- Click the Protocol Data tab to open the view.
If you cannot locate the Protocol Data tab, click...
-
Window | Show View | Protocol Data
- In the test, click the line that corresponds to the page, request, or response to view.
- In the Protocol Data view, click the tab that corresponds
to the type of data or view of interest. The selected data is displayed in the Protocol Data view.

If you have problems during playback, you can compare the data that was recorded with the data that was retrieved during the run.
Test Siebel applications
When you record a Siebel application, a Siebel-specific test is automatically generated. However, before you run this test, install the Siebel Test Automation library and edit the test to use built-in Siebel variables.
Rational Performance Tester 64-bit workbench does not support testing Siebel applications.
Prerequisites for Siebel testing
To test Siebel applications, the Siebel Test Automation and the Microsoft C++ runtime libraries must be installed on the workbench computer.
Siebel applications run only on Windows, therefore Siebel tests run only on Windows. Do not add a Siebel test to a schedule that you deploy to run on operating systems other than Windows.
Rational Performance Tester 64-bit workbench does not support testing Siebel applications.
To install the prerequisites for testing Siebel applications:
- Obtain the Siebel Test Automation library, ssdtcorr.dll, from Siebel.
- Copy the ssdtcorr.dll file to the workbench
computer in this path: ...\ibm\sdp\rpt\external_files\deployable\siebel\,
where ...\ibm\sdp\rpt\ is the product installation
directory.
If the Siebel Test Automation library is not installed, Siebel tests will fail, and a warning message will display when you edit a Siebel test. After the library is installed on the workbench computer, it is automatically deployed as needed to any remote location. The library must be on any computer that runs a Siebel test.
You can use the rptExternal variable in the config.ini file to control where external files must be installed. By default, the rptExternal variable is set to the product installation directory. Edit the rptExternal variable if you want to install the .dll files to a different location. For example, if you set the rptExternal variable to e\:\\ibm\\sdp\\rpt then you would install the Siebel Test Automation library in e:\ibm\sdp\rpt\external_files\deployable\siebel\. Note that use an extra backslash before the colon and backslashes in the path.
- Copy the Microsoft C++ runtime library, msvcr70.dll, to the workbench computer in the same directory as the ssdtcorr.dll file. (If necessary, obtain the msvcr70.dll file from the Microsoft web site.) The file name is case-sensitive, and must be all lower-case. The file must be named msvcr70.dll, not MSVCR70.DLL. Once installed in the correct directory on the workbench computer, the Microsoft C++ runtime library is automatically deployed as needed to any remote location.
Differences between Siebel tests and HTTP tests
Siebel tests precisely designate datapool candidates, include an additional type of data source, and store variables in a proprietary data structure. In addition, page names are created during test generation to help you find pages of interest.
The primary difference between a Siebel test and a standard HTTP test is in how dynamic data is stored and substituted during a test run:
- In a standard HTTP test, a data source (datapool variable, custom code, or a reference) is linked to a test value that is replaced at run time. Siebel tests support standard HTTP data sources and substitution. Datapools work the same way in Siebel tests as in standard HTTP tests, but the datapool candidates in Siebel tests are more precisely designated than in standard HTTP tests. In many cases, datapool substitutions are the only changes that you need to make to a Siebel test.
- In a Siebel test, an additional type of data source, which is called a built-in data source, contains variables that you can use to replace a test value.
These variables can be substituted for dates (in defined formats), time stamps, and counters throughout tests. In some cases, SWE Unique Value can be used as an alternative to a datapool; for example, to supply variable account names.
Siebel variables are stored in a proprietary data structure called a star array. A star array stores both strings and their length in hexadecimal format (length_string) or integer format (length*string). Siebel substituters have a method for substituting data and recomputing the length. You can substitute from a value in a star array (highlight a length_string or length*string format value, right-click, and then click Substitute). You are then asked whether you want a Siebel substitution or a standard HTTP substitution. You typically select Siebel data correlation.
Siebel tests are organized inside the test editor much like standard HTTP tests, but with some differences for pages:
- The first page of a Siebel test is named Message Bar, which emulates the ticker-tape message that Siebel application pages display.
- Page names are created during test generation to help you find pages of interest. For example, a typical change to make to a test before running it is to replace the user name and password that you typed during recording with values in a datapool. As shown in the example, the page from which you logged into the Siebel server is named Login - Send UserName/Password, to help you find this page quickly.
Correlating a request value with a built-in Siebel variable
If you are editing a Siebel test, you can correlate request values with built-in Siebel variables. To correlate a request value with a built-in variable:
- In the Test Navigator, browse to the test and double-click it. The test opens.
- Locate the value that should be replaced by a built-in variable.
- Highlight the value: with the left mouse button pressed, drag your mouse over it.
- Right-click the highlighted value and click Substitute from | Built-in data sources. The Built-in Datasource Selection wizard displays the types of variables that can be substituted.
- Select the type of variable and click either Next or Finish.
- If you select Current Date, click Next, select the date format, and then click Finish.
- If you select SWE Counter, click Next, type values for the counter in the Current Value and Maximum Value fields, and then click Finish.
Edit SAP tests
After recording a test, edit it to include variable data (rather than the data that you recorded) and verification points (to confirm that the test runs as expected).
SAP test editor overview
Use the test editor to inspect or customize a SAP performance test that you recorded.
The test editor lists the SAP transactions for a test, by title. The following example shows the test MySAPTest, which was generated from a recording of these tester actions: logon to the server, launch a Material Master Display transaction (mm03), view the Basic Data screen for the item SCREW, and stop recording.

Test Contents, displays the hierarchy of the SAP transactions for the test.
Test Element Details displays details about the currently selected item (transaction or event) in the test hierarchy. In the preceding example, Test Element Details displays information about the test because the name of the test, MySAPTest, is selected in the Test Contents area.
When you expand a test transaction, you see a list of SAP screens. Each SAP screen corresponds to a new page or window in SAP GUI and is reflected by the screen capture in the SAP Protocol Data view.
When you expand a SAP screen, you see the SAPGUI events for the screen, with names that describe the action. The following example shows the Material Master Display (mm03) transaction expanded with the SAP Easy Access screen. The set event that described the mm03 text input in the SAP GUI is selected in the Test Contents area.

Values can sometimes be highlighted in green. This highlighting indicates that these requests contain one or both of the following types of information:
- A datapool candidate: This is a value, usually one specified by the tester during recording, that the test generator determined is likely to be replaced by values in a datapool. An example of a datapool candidate is a string that you search for in a recorded test. The string is highlighted as a datapool candidate on the assumption that, before playback, you might want to associate the string with a datapool column containing appropriate substitute values..
- Correlated data: These are values in a test, usually one of them in a response and the other in a subsequent request, that the test generator determined needed to be associated in order to ensure correct test playback. An example is a material price returned to the browser by a test that searches a material database. The test generator automatically correlates material names with prices. Suppose that, before running the test with many vusers, you replace the material name searched for in the recorded test with names in a datapool. Because the test correlates the data, each virtual user searches for a different material, and the server returns an appropriate price.
To see an illustration of color coding in performance tests or to change the color settings, click...
-
Window | Preferences | Test | Performance Test Editor | Fonts and Colors tab
The Response data inside each request shows the data that the SAP R/3 server returned to the browser based on that request.
Click Add to add elements to the selected test element. Alternatively, you can right-click a test element and select an action from a menu. The choices that you see depend on what you have selected. For example, after you select a test, you can add a new event.
The Insert button works similarly. Use it to insert an element before the selected element.
The other buttons (Remove, Up, Down), are primarily for use when substantially modifying a test; these actions or choices are likely to break a recorded test.
The test editor synchronizes with the SAP Protocol Data view. When you select a test element in the test editor, the corresponding screen is displayed as a screen capture in the SAP Protocol Data view. If a specific SAP GUI object is related to the test element, the object is highlighted in the SAP Protocol Data view. You can also right-click SAP GUI objects in the SAP Protocol Data view to add associated events or verification points to your test.

Sometimes, the area of the editor where you need to work is obscured. To enlarge an area, move your cursor over one of the blue lines until your cursor changes shape (to a vertical line with an up arrow at the top and a down arrow at the bottom) and drag up or down while holding the left mouse button.
Verify expected behavior
To check whether an expected behavior occurred during a run, you can add verification points. When you run a test containing a verification point, an error is reported if the expected behavior did not occur.
Add an SAP verification point
With SAP get and SAP call elements, you can retrieve a value from the SAP GUI to create verification points on an SAP screen element.
When you add SAP verification points, SAP get elements, and some SAP calls, retrieve the data from objects in the SAP GUI, such as windows or text fields. SAP get and SAP call elements are contained in SAP screens in the test suite. SAP screens can be windows, dialog boxes, or transaction screens that are part of a recorded transaction.
You can use either the test editor or the SAP Protocol Data view to create or edit SAP get and SAP call elements and place verification points on them. When using the SAP Protocol Data view, you can select SAP screen elements from the screen capture to specify the SAP GUI identifier for the get event. Using this method to create or edit an SAP verification point is easier than adding it manually from the test editor.
The SAP Protocol Data view contains two pages that are synchronized with each other and with the test editor:
- Screen Capture displays a graphical screen capture of the SAP GUI. You can select all GUI objects such as windows, buttons, fields or areas.
- Object Data provides information about the selected GUI object: identifier, type, name, text, tooltip, and subtype.
- Open the test editor and the SAP Protocol Data view. If the SAP Protocol Data view is not open, click...
-
Window | Show View | Other | Test | SAP Protocol Data
- In the Test Contents area of the test editor, expand a transaction and an SAP screen. The SAP Protocol Data view displays a screen capture of the selected transaction.
- Inside the transaction, select the item for which you want to enter a new value. The Screen Capture page of the SAP Protocol Data view displays the screen capture of the SAP GUI with the corresponding GUI object highlighted in red.
- In the SAP Protocol Data view, right-click the GUI field to verify, and then select Create Verification Point. To create an advanced verification point using an SAP GUI call method, then you can select Create Element instead.
- In the Create Verification Point or Create Element window, specify the expected value for the verification point.
- To verify a text value in the SAP GUI object, ensure that Verify text is selected, and type the Expected value to verify; then click Finish.
- To verify advanced properties of the SAP GUI object, you can select Advanced, and then specify the properties attached to the GUI object as well as the Expected values. Refer to SAP documentation for information about these properties.
- If you selected Create Element to create a verification point on an SAP call, then select Advanced, choose an Element type that returns a value, and then specify the properties attached to the GUI object. Refer to SAP documentation for information about these properties.
After creating the event, you can use the test editor to easily change the value. You can also enable and disable SAP verification points on SAP get and SAP call elements in the test editor.
Specify an expected screen title
Screen title verification points report an error if the title of an SAP screen is different from what you expected.
- Select the SAP screen in the test editor and ensure that screen title verification is enabled for the SAP screen.
The Test Element Details area includes a Screen Title Verification Point section.
- If screen title verification was enabled for the entire test, the Enable verification point check box is selected for all SAP screens in the test.
- If screen title verification was enabled for a specific SAP screen, the Enable verification point check box is selected for the selected SAP screen.
You can enable or disable screen title verification for a specific SAP screen in the test editor by selecting or clearing the Enable verification point check box.
- Ensure that the Expected screen title field shows the string that you expect to be included in the page title
that is returned when this page is loaded.
When the test was recorded, SAP returned a default title for this screen. This value is displayed in the Recorded title field, and is automatically copied to the Expected page title field when the Enable verification point check box is selected. You can change the string in the Expected page title field as needed. Whenever the test runs with page title verification enabled, an error is reported if the title returned for the page does not contain the expected title. Although the comparison is case-sensitive, it ignores multiple white-space characters (such as spaces, tabs, and carriage returns).
Verify response times
SAP request response times measure the delay between the moment the user submits a server request and the moment the server responds. Response time data is provided by the server. You can set a verification point on a response time threshold value. If the test encounters a response time above the threshold, the verification point is failed.
When the Verification points for SAP request response time threshold option is selected in the SAP Test Generation preferences, all SAP server request elements contain a response time verification point. The default threshold value is calculated by applying a multiplier to the recorded response time. You can change the default multiplier in the SAP Test Generation preferences. The response time measurements are displayed in the SAP server request element, which is the last element in an SAP screen.
To define a response time verification point:
- In the test editor Test Content area, select an SAP server request element inside an SAP screen element.
- In the Test Element Details, select Enable verification point, and then enter the Response time threshold in milliseconds. If the test encounters a response time that is higher than the threshold, the verification point is failed.
Add elements to an SAP test
You can add a variety of elements to an SAP performance test, such as loops, conditions, SAP set, verification point or sequence elements.
Add an SAP set, SAP get, or SAP call element
You can use SAP set, SAP get, or SAP call elements in performance tests to add items such as a field selection, a keyboard entry, a get element for reference use, or any advanced interaction with the SAP client GUI.
SAP set elements represent user interactions with the SAP GUI, such as entering a value into a field. SAP set elements are contained in SAP screen elements. SAP screen elements can be windows, dialog boxes or transaction screens that are part of a recorded transaction.
SAP get elements enable you to retrieve information from the SAP GUI, such as field values. SAP get elements are contained in SAP screen elements. The primary use of an SAP get element is to create a reference field or a verification point in the test. An SAP verification point is actually an SAP get element with a verification point enabled.
SAP call elements represent all the various user interactions that are neither an SAP set or an SAP get element. For example, selecting an object, scrolling, or pressing the Enter key generates an SAP call.
You can use either the test editor or the SAP Protocol Data view to create or edit SAP set, get, or call elements. When using the SAP Protocol Data view, you can select SAP screen objects from the screen capture and copy the information directly to the new SAP set, get, or call element. Using the SAP Protocol Data view to create or edit an SAP event is much easier than adding an event manually from the test editor.
The SAP Protocol Data view contains two pages that are synchronized with each other and with the test editor:
- Screen Capture displays a graphical screen capture of the SAP GUI. You can select all GUI objects, such as windows, buttons, fields or areas.
- Object Data provides information about the selected GUI object: identifier, type, name, text, tooltip, and subtype.
To add an SAP set, get, or call element:
- Open the test in the test editor and the SAP Protocol Data view. If the SAP Protocol Data view is not open, click...
-
Window | Show View | Other | Test | SAP Protocol Data
- In the Test Contents area of the test editor, expand a transaction and an SAP screen. The SAP Protocol Data view displays a screen capture of the selected transaction.
- Inside the transaction, select the item for which you want to enter a new value. The Screen Capture page of the SAP Protocol Data view displays the screen capture of the SAP GUI with the corresponding GUI object highlighted.
- In the SAP Protocol Data view, right-click the GUI object for which you want to create the SAP set, get, or call element, and then click Create Element. This opens the window, which already contains the Identifier from the recorded session.
- In the Create Element window, specify the type of SAP element to create. Enter the value to add, and then do one of the following procedures, depending on your testing objectives:
- To create a simple SAP set element, select Set text, and then type the text value to input into the SAP GUI.
- To create an SAP get or an SAP call element, select Advanced, and then select SAP Set, or SAP Call in the Element type list. Use a SAP set to input a value into the SAP GUI client. Use a SAP call to call a method for advanced interaction with the SAP GUI. Specify the property to get or the method of the call. Refer to SAP documentation for information about SAP call methods and properties. SAP call elements are created with default values that you can change in the test editor. You can use SAP call methods to define a verification point or for data correlation.
- To create a non-text SAP set element, select Advanced, and then select SAP Set in the Element type list. Specify the property to set and enter a value if that property requires one.
- Click Finish.
After creating elements, you can use the test editor to change values. You can also replace values with a datapool variable or a reference.
Add an SAP sequence element
You can use SAP sequence elements to specify complex interactions with the SAP GUI that involve multiple actions within a single object.
SAP sequence elements represent complex user interactions with the SAP GUI, and contain multiple SAP set, get, or call child elements where each child element of the sequence is an action that relies on the return result of the preceding child element. In most cases, SAP sequences are recorded when you interact with complex SAP GUI objects. However, with advanced knowledge of the SAP API, you can use SAP sequences to create complex actions or verification points.
SAP sequence elements are contained in SAP screen elements.
You can use either the test editor or the SAP Protocol Data view to create or edit SAP sequences. When using the SAP Protocol Data view, you can select SAP screen objects from the screen capture and copy the information directly to the new SAP sequence element.
The SAP Protocol Data view contains two pages that are synchronized with each other and with the test editor:
- Screen Capture displays a graphical screen capture of the SAP GUI. You can select all GUI objects such as windows, buttons, fields or areas.
- Object Data provides information about the selected GUI object: identifier, type, name, text, tooltip, and subtype.
- Open the test in the test editor and the SAP Protocol Data view. If the SAP Protocol Data view is not open, click...
-
Window | Show View | Other | Test | SAP Protocol Data
- In the Test Contents area of the test editor, expand a transaction and a SAP screen. The SAP Protocol Data view displays a screen capture of the selected transaction.
- Inside the SAP screen, select where you want to enter the new sequence. The Screen Capture page of the SAP Protocol Data view displays the screen capture of the current SAP screen.
- In the SAP Protocol Data view, right-click the SAP GUI object for which you want to create the SAP sequence element, and then click Create Element. This opens the Create Element window, which already contains the Identifier from the recorded session.
- Select Advanced, select SAP Sequence in the Element type list, and then click Finish.
- In the Test Contents area of the test editor, select the SAP sequence and click Add | Element to add a SAP set, get, or call element to the SAP sequence.
- In the Test Contents area of the test editor, select the SAP sequence, and then click Add or Insert to add sequence child elements as required. In the Create Element window, use the Cast button to cast the results of the previous child element to match the expected input type. See the SAP API documentation for detailed information on SAP objects and calls.
Add a batch input transaction
You can import batch input transactions that were recorded from the SAP GUI into an SAP batch input test. A batch input test can contain multiple batch input transactions.
You can add batch input transactions only to a batch input test, not to a regular SAP performance test. First create a new batch input test.
Batch input tests access the SAP R/3 server at a low level, bypassing the SAP GUI interface, and therefore cannot contain any verification points or SAP GUI elements. Their main purpose is to simulate a load on the server when added to a test schedule that already contains SAP performance tests. Only the SAP performance tests provide accurate SAP application performance measurement.
To add an SAP batch input transaction to a batch input test:
- Open the batch input test in the test editor.
- In the Test Contents area of the test editor, right-click the test node, and click Add | Transaction. Placing the batch input transaction inside a transaction is not mandatory, but it is a good practice, because the performance report shows the results for each transaction separately.
- Right-click the transaction and click Add | SAP Batch Input Transaction. This opens the SAP Batch Input File Selection window.
- Select a batch input transaction file that was recorded with the SAP GUI batch input recorder, and then click Open.
After creating elements, you can use the test editor to change values. You can also replace values with a datapool variable or a reference. You can also place the batch input transaction inside a loop to make it repeat several times during the test.
Split an SAP test
After recording a test, you can split it into smaller tests. Splitting tests enables you to create modular building blocks of smaller tests and combine them to make bigger tests. The original test is unchanged. You can recombine these building blocks in a schedule, including loops and conditions.
When reusing split tests in a schedule, you must ensure that the general test structure is consistent including SAP session logon and logoff details. For example, if split test a contains the session logon details and split test c contains the logoff transaction, you must place them in the correct order in the schedule user group.
SAP tests can be split only at the transaction level. When the test is executed in the schedule, it must start with a SAP logon transaction and end with a SAP logoff transaction.
- In the Test Navigator, browse to the test and double-click it. The test opens.
- Right-click a SAP transaction in the test, and select Split Test. The page that you click is the first page of the new test.
- In the New Test Names window, confirm the location of the split, optionally provide names and descriptions for the split tests, and click Next.
- In the Split Test window, examine the changes to be performed as a result of the split, and click Finish.
Example
For example, you could record a test containing the following actions:
- Logging on to a server.
- Create an entry on the server and removing the entry.
- Edit an entry, validating that the change occurred, and restoring the entry.
- Logging off of the server.
View GUI data in the SAP Protocol Data view
The SAP Protocol Data view provides a graphical view of screens as they are displayed in the SAP GUI. In addition, it provides a view of the SAP GUI object data. The data displayed in the SAP Protocol Data view is synchronized with the test elements selected in the test editor.
To view test contents in the SAP Protocol Data view:
- Open the test.
- Click the SAP Protocol Data tab to activate the view. As shown in the example, the tab color changes to blue and the tabs for the Protocol Data view are displayed.
If you cannot locate the SAP Protocol Data tab, you can open this view by clicking Window | Show View | Other | Test | SAP Protocol Data.
- In the test editor, click the line corresponding to the transaction, screen or SAP event to view.
- In the SAP Protocol Data view, click the tab corresponding to the type of data or view of interest.
- Clicking Screen Capture opens a page that displays the corresponding screen as recorded in the SAP GUI client. If a SAP event is selected, the corresponding field, button or GUI object is highlighted in red.
- Clicking Object Data opens a page that displays the SAP GUI object data for the corresponding object. This data can be used to identify the object in a test element.
Edit Citrix tests
After recording a test, edit it to include variable data (rather than the data that you recorded), verification points (to confirm that the test runs as expected), transactions, conditional processing, and custom code.
Citrix test editor overview
With the test editor, you can inspect or customize a test that you recorded.
The test editor lists the window events for a test, in sequential order. New windows are displayed in bold. The Windows operating system assigns each window an ID number. This number changes on each execution of the test, but usually remains the same within the test, providing a means of identifying each window object.
In some cases, the operating system recycles destroyed window IDs. The test recorder identifies these properly by appending an extra number at the end of the window ID if necessary.
Test Contents displays the chronological sequence of events in the test.
Test Element Details displays details about the currently selected item (window, mouse event, key event, or screen capture) in the test hierarchy. The Common Options and Citrix Options apply to the entire test.
Under the test is the Citrix session, which contains information about the connection and Citrix XenApp client options, such as color depth and resolution.
Window events are the primary test elements in a Citrix test and represent graphic objects that are drawn by the Citrix server, such as actual window, dialog boxes, menus, or tooltips. A Window event is recorded each time a window is created, destroyed, moved, or resized. The first occurrence of a window, a create window event, is displayed in bold. Window objects are typically identified by their title. If there is no window title, for example on menus or tooltips, then the test editor uses the window ID number.
Inside windows, you see a list of events for the window, such as create window events, screen captures, mouse or key board actions.
Some actions contain data that is highlighted. This highlighting indicates that the data contains one or both of the following types of information:
- A datapool candidate: This is a value, usually one specified by the tester during recording, that the test generator determined is likely to be replaced by values in a datapool. An example of a datapool candidate is a string that you search for in a recorded test. The string is highlighted as a datapool candidate on the assumption that, before running the test, you might want to associate the string with a datapool column containing appropriate substitute values.
- References: These are values in a test, usually one of them in a response and the other in a subsequent request, that the test generator determined needed to be associated in order to ensure correct test execution. An example is a photograph returned to the browser by a test that searches an employee database. The test generator automatically correlates employee names with photographs. Suppose that, before running the test with many vusers, you replace the employee name searched for in the recorded test with names in a datapool. Because the test correlates the data, each virtual user searches for a different employee, and the server returns an appropriate photograph.
To see an illustration of color coding in performance tests, click...
-
Window | Preferences | Test | Test Editor | Fonts and Colors tab
Click Add to add elements to the selected test element. Alternatively, you can right-click a test element and select an action from a menu.
The choices that you see depend on what you have selected. For example, inside a window, you can add a mouse action or a text input. The Insert button works similarly. Use it to insert an element before the selected element. The Remove button allows you to delete an item.
Because Citrix performance tests rely on low level interaction with the server, manually changing test elements is likely to break a recorded test.
Citrix synchronization overview
During the run of a Citrix session, the test uses window events or image recognition to ensure that the correct user input actions are maintained on track with the application events coming from the Citrix server.
The synchronization mechanism enables the test to remain synchronized without relying only on the timing, which could vary with the load on the Citrix server.
Synchronization is different from the function of verification points. Verification points check specified values of the application, such as window synchronizations, and produce a test status: pass, fail, error, or inconclusive. Synchronization is used for test execution and produces synchronization timeouts in the test log when the test fails to recognize the server output.
Synchronization occurs on window events or through the recognition of a screen area that you specify.
- Window event synchronization is produced automatically by the Citrix server. When the test is run, the vusers send emulated user actions to the server, such as keyboard or mouse actions and the server responds with window events such as create, activate, or destroy. The test waits for the expected window events to occur before sending the next user actions to the server. The test uses window styles, and optionally, locations, sizes, and window titles, to recognize windows.
- Image synchronization enables you to require additional recognition of screen area contents. The test can synchronize on either a unique bitmap hashcode that is calculated from the image or on a text string retrieved from the image through optical character recognition. In some applications, such as web browsers or word processors, the actual window content changes more frequently then the window objects. In these cases, you must manually add image synchronization to critical parts of the test during the recording so that the test can synchronize with the window contents.
During test execution, the test waits for the window event or the image recognition to synchronize the user actions independently from the load on the server. If an expected window event fails to occur or an expected image is not recognized, then the test produces a synchronization timeout that is reported in the test log. The test will attempt to resume the execution at the next synchronization point.
The base timeout delay is specified in the Citrix test generation preferences; however, the actual delay varies with the level of synchronization.
There are three levels of synchronization for window events and images that can be specified for each element in the test editor:
- Conditional: This is the default behavior for main windows and dialog boxes. If the synchronization fails, the test tries to continue and the synchronization timeout is logged in the Citrix performance report and the test log.
- Mandatory: If the synchronization fails after a period that is three times the base timeout delay (by default), the test exits with an error status and the connection with the Citrix server is closed. The test execution continues to run until test results are finalized.
- Optional: Synchronization is not required but is logged in the test log. A timeout occurs after 1/10th of the base timeout delay.
- Main window create events are set to mandatory.
- Other window create events are set to conditional.
- Main window destroy events are set to conditional.
- Other window destroy events are set to optional.
- Image synchronizations are set to conditional.
Verify application behavior
To check the expected behavior of the application during a Citrix performance test, you can add verification points at strategic points in the test. You can use window verification points to check that a specific window opens during the test, regardless of its contents, or you can use image synchronization to verify the displayed contents. During the run, verification points produce a pass, fail, error, or inconclusive status in the Citrix Verification Point report. You can also measure response times between two test elements.
Enable Citrix window verification points
You can use verification points on window titles to check whether a window with a specific caption is created during the test. Alternatively you can set a verification point on the synchronization criteria of the window to check whether the window position, size, and style match the expected criteria, regardless of the contents. You can enable window verification points for a specific test or generate them automatically by setting the test editor preferences.
During the run, verification points produce a pass, fail, error, or inconclusive status in the Citrix Verification Point report and in the test log.
Mandatory window synchronization events always have a verification point enabled. This setting causes the test to have a fail status if the window does not synchronize.
To automatically enable verification points each time a window title changes during the recording, click...
-
Window | Preferences | Test | Performance Test Generation | Citrix Test Generation | Verification point on every window title change
When verification points are disabled, you can enable verification points for a specific test:
- Open the test.
- In the test editor, select a session or a window event. Your choice determines whether the verification point that you select is added to all windows in the test or to a particular window in the test.
- Right-click, and select Enable Window VPs.
Verification points on mandatory window synchronization elements cannot be disabled.
Enable Citrix image synchronization verification points
Use verification points on image synchronization elements to check whether the contents of a screen area match either an expected bitmap or a text string. You can add image synchronization verification points to a recorded image synchronization element.
During the run, verification points produce a pass, fail, error, or inconclusive status in the Citrix Verification Point report and in the test log.
To add a verification point to a recorded image synchronization element:
- In the test editor, select an image synchronization test element that you added during the recording.
- In the Test Element Details area, on the Synchronization page, select the verification method:
- Select Bitmap hash code to verify the exact contents of the image.
-
Select Optical character recognition to verify the recognized text in the captured screen area, and then click Extract Text to obtain the text that is expected.
If the text extraction is unsuccessful, try changing the text recognition settings on the Options page. However, accuracy of the recognized text is not essential. It is only important that the recognized text is consistent each time the test runs for the verification to pass.
- In the Test Element Details area, on the Settings page, select Enable verification point on synchronized image.
Specify window verification point criteria
Window verification points produce a fail status in the test execution report if they differ from the specified expected criteria.
- In the test editor, select a window event element. You can set a verification point on any window event that creates, activates, or destroys a window containing a title.
- Ensure that Enable verification point on synchronized window event is enabled for the selected window event element.
- In the test editor, select the window element containing the window event.
- Select the event synchronization criteria:
- X position and Y position: Select these options to specify that the top left corners of the window must be located at the same coordinates.
- Width and Height: Select these options to specify that the window must be the same size.
- Title: Select this option to specify that the window must have the same title.
- If you selected Title, the Window
title field shows the expected title. If necessary, you can change the expected title in the Window title field.
You can use standard regular expressions to specify the expected title by selecting Use regular expressions.
Whenever the test runs with a verification point enabled on a window create, activate, or destroy event, a fail status is reported in the test log if the criteria returned by the Citrix server for the window does not contain the expected criteria.
Measuring response times
A response time measures the delay between a specified start event and a specified stop event. Typically, the start of the measurement is set to a mouse or keyboard input. Similarly, the stop is set to a window create, window activate, or window destroy event that is a response to the input event, or an image synchronization element that was recorded with the test.
Response time measurements require a start element and a stop element. If either of these are missing, the response time definition is displayed with an error or warning marker.
When the Response time for main windows option is selected in the Citrix Test Generation preferences, recorded tests are generated with a response time measurement each time a main window is created. Generated measurements start on the event that occurred immediately before a main window is created and stop when the main window is created.
You can view all the response times of a test by selecting the Citrix test element in the test editor. Response times are listed in the Response Time Definitions table where they can be edited, renamed, or deleted.
- In the test editor Test Contents area, select a test element to start the response time measurement.
- Press the Ctrl key, and select another test element to stop the response time measurement. The two elements are selected in the test. The first element is the start of the response time measurement and the second is the stop.
- Right-click either the start or stop element, and click Create Response Time.
- A Create Response Time window displays information about the new response time measurement. If the new response time measurement replaces a previous one, click Yes. Otherwise, click OK.
- Optional: To view all the response times that are defined for the test, click the test element in the test navigator,
and select the Citrix Response Time page.
By default, response time measurements are included in the test results, even when the synchronization fails with a timeout. To exclude failed synchronizations from the response time results, clear the State option in the Response Time Definitions list.
Add elements to a Citrix test
You can add a variety of elements to a test, such as user input actions, comments, loops or conditions.
Edit a mouse action
You can edit mouse actions to manually specify how the mouse interacts with the Citrix server.
Mouse actions describe low-level user actions using the mouse such as mouse movements, clicks and double-clicks, or drag-and-drop operations. Mouse actions can be added only inside window events or mouse sequences. For example, a drag-and-drop operation is described as a mouse down action at a specific location, a sequence of mouse move actions, and a mouse up action at the destination location.
In most cases, you will rely on the mouse actions that were recorded with the test. However, in some cases, you might want to manually refactor mouse action sequences that are redundant or poorly recorded. For example, a double-click event can sometimes be recorded as a mouse down, a mouse up, and a click. The result will be the same as a double click action but the test will be more difficult to read.
Because Citrix tests contain low level user input and synchronizations, minor changes can prevent the test from working. When editing these tests, you must ensure that they are functionally identical.
- Open the test in the test editor.
- Expand a window action.
- To edit a mouse action, select the event in the Test Contents area.
- To create a new action at a specific location, select an action and click Insert and Citrix Mouse.
- In the Test Element Details area, specify the type of event.
- Mouse move: This indicates that the mouse is moved from the current coordinates to the coordinates specified in X Position and Y Position.
- Mouse click: This indicates that the mouse is clicked at the coordinates specified in X Position and Y Position. In the Buttons area, select the button that is clicked.
- Mouse double click: This indicates that the mouse is double clicked at the coordinates specified in X Position and Y Position. In the Buttons area, select the button that is double clicked.
- Mouse down: This indicates that a mouse button is pressed at the coordinates specified in X Position and Y Position. In the Buttons area, select the button that is double clicked.
- Mouse up: This indicates that a mouse button is released at the coordinates specified in X Position and Y Position. In the Buttons area, select the button that is double clicked.
- You can specify the think time for the mouse action. This emulates the time spent by a user before initiating the current event.
View a mouse sequence
You can use mouse sequences to view complex mouse movements on the screen.
Mouse sequences provide a graphical view of a series of mouse move events. This is particularly useful when a large number of mouse move events are meaningful to the application. For example, drawing the letter e in a paint program is represented as a mouse down event, a mouse sequence, and a mouse up. In the test editor, the sequence graphically displays how the letter e is drawn in the application. If any screen captures were taken during the recorded session, the sequence will be shown over the screen capture.
In most cases, you will rely on the mouse sequences that were recorded with the test. However, in some cases, you might want to manually refactor mouse events into sequence.
Because Citrix tests contain low level user input and synchronizations, minor changes can prevent the test from working. When editing these tests, you must ensure that they are functionally identical.
- Open the test in the test editor
- Expand a window event and select the sequence in the Test Contents area.
- In the Test Element Details area, you can view the following information:
- Display mouse sequences for
- This option specifies how you want to display previous, current,
or all mouse sequences in the current mouse sequence:
- Current sequence
- Only the current mouse sequence is displayed in the test editor. This option is selected by default.
- Previous and current sequences
- The current mouse sequence is displayed with any previous mouse sequences.
- All sequences
- All mouse sequences are displayed simultaneously.
- Fit screen to visible area
- Adjust the display of the mouse sequence to the available area in the test editor. If disabled, the screen capture will be the actual size, which might require scrolling. This option is enabled by default.
- Screen capture area
- This area represents the mouse movements on the screen. If a screen capture was recorded, it is displayed in the background. Mouse sequences are displayed as specified.
Edit a keyboard action
You can edit keyboard actions to manually specify how the keyboard interacts with the Citrix server.
Keyboard actions describe low level user actions using the keyboard such as text inputs or keyboard shortcuts. Keyboard actions can be added only inside window events.
In most cases, you will rely on the keyboard actions that were recorded with the test. The recording tries to factor multiple key presses into text input actions. However, in some cases, you might need to manually factor keyboard actions that are redundant or poorly recorded. For example, in some cases, a text input string Hello can be recorded as a press on the Shift key, a press on the H key, a release of the Shift key, a stroke of the E key, and finally a text input of llo. By manually factoring keyboard actions into text inputs, you can handle text from datapool variables and references.
Because Citrix tests contain low level user input and synchronizations, minor changes can prevent the test from working. When editing these tests, you must ensure that they are functionally identical.
- Open the test in the test editor
- Expand a window event.
- To edit a keyboard action, select the action in the Test Contents area.
- To create a new keyboard action at a specific location, select an action and click Insert and Citrix Keyboard.
- In the Test Element Details area, specify the type of action.
- Key Stroke: This indicates that a key is pressed and released.
- Key Down: This indicates that a key is pressed and held down.
- Key Up: This indicates that a pressed key is released.
- You can manually enter any Unicode character that is not normally available through single keystrokes by using the Character Edition area. Select the input field and enter the character on your keyboard. The Key Code and Character fields display the corresponding character.
The workbench uses some key combinations as keyboard shortcuts. Such combinations can be intercepted and cause undesirable actions instead of displaying a particular character in the Character field..
- You can specify the think time for the keyboard event. This emulates the time spent by a user before initiating the current event.
Edit a text input
You can edit text inputs to replace a sequence of keyboard events with text strings that are easier to handle as datapool variables or references.
Text inputs describe a series of low-level keyboard events as a single text string. Text inputs can be added only inside window events.
In most cases, you will rely on the text inputs that were recorded with the test. The recording attempts to factor multiple key presses into text input events. However, in some cases, you might need to manually factor keyboard events that are redundant or poorly recorded. For example, in some cases, a text input string Hello can be recorded as a press on the Shift key, a stroke of the H key, a release of the Shift key, a stroke of the E key, and finally a text input of llo. By manually factoring keyboard actions into text inputs, you can handle text from datapool variables and references.
Because Citrix tests contain low level user input and synchronizations, minor changes can prevent the test from working. When editing these tests, you must ensure that they are functionally identical.
- Open the test in the test editor
- Expand a window event.
- To edit a text input, select the action in the Test Contents area.
- To create a new text input at a specific location, select an action and click Insert and Citrix Text.
- In the Test Element Details area, edit the text string that will be entered during the test.
- You can specify the think time for the keyboard event. This emulates the time spent by a user before initiating the current event.
Synchronize tests with screen areas
Image synchronization enables Citrix performance tests to keep track of the contents of a screen area during replay instead of focusing only on window events.
You can use image synchronization elements in a test to facilitate the test replay in applications that do not create or modify many windows, but update the contents of the window regularly.
The contents of an image are processed as a value that is either a calculated bitmap hashcode or a text string obtained by optical character recognition. During test execution, the test waits for the contents of a screen area to match the expected image synchronization value before proceeding with the test. If the value is not matched during the synchronization period, an image synchronization timeout is produced in the test log.
You can also add verification points to image synchronizations in the test editor. The verification point passes if the synchronization succeeds and fails if a timeout occurs.
You insert image synchronizations during test recording.
- Start recording a Citrix performance test and record a sequence of user actions.
- To add an image synchronization to the recorded test, in the Citrix Recorder Control window, click the Insert image synchronization
 button, select an area of the screen that will be used for synchronization, and then click the Insert image synchronization button again.
- Continue the recording. When you have completed the sequence of actions to be tested, end the Citrix session cleanly and close the Citrix XenApp client. A progress window opens while the test is generated. On completion, the Recorder Control view displays the message Test generation completed, the Test Navigator lists your test, and the test opens in the test editor.
- In the test editor, select the Image synchronization element.
- Set the synchronization state to Conditional, Mandatory or Optional. In most cases, because you are explicitly requesting for a synchronization to occur, you should leave the synchronization state as Conditional.
- Specify one of two synchronization methods.
- Select Bitmap hash code if you want the synchronization to occur when the selected area matches exactly the recorded image. A single pixel of difference will cause a synchronization timeout.
- Select Optical character recognition if you want the synchronization to occur when a text string is recognized in the selected area. Click Extract text to test the text recognition on the recorded image. Note that for synchronization purposes the text recognition results must be repeatable, not necessarily accurate.
On Windows 2008, it is recommended to use the Bitmap hash code synchronization method for a Citrix test.
You can click Extract text several times to verify the text recognition results are repeatable. If the recognized text differs, click Options to change the Zoom factor or other optical character recognition settings. You should not manually correct the recognized text.
You can click Add to specify multiple expected text strings, Use regular expression to specify a text string as a regular expression, or Factorize to automatically generate a regular expression from multiple expected text strings.
- Specify whether you want to enable a verification point on the image synchronization. This enables the test to produce a pass or fail status in the Citrix Verification Points report.
Manually adding an image synchronization
You can manually add an image synchronization element to an existing test to ensure that the test synchronizes correctly or to add a verification point. To do this, you must create the image synchronization element, and then perform a single run of the test to retrieve the image hash code or text detected by optical character recognition (OCR).
- Open the test in the test editor.
- Select the location where you want to create the image synchronization and click Insert and Citrix Image Synchronization. This creates a new image synchronization element that is set to Conditional and has several values disabled. This is because the test does not yet contain the image hash code or recognized text.
- In the screen capture area, move and resize the black rectangle to specify the zone of the image that will be used for the synchronization. Alternatively, you can specify the pixel values in X position, Y position, Width and Height.
- Select...
-
File | Save
- In the test navigator, right-click the test and select Run As | Performance Test. This runs the test once to retrieve the image hash code or recognized text.
- After running the test, right-click the test report, select Display Test Log, and then select the Events page.
- Click the Events tab.
- Expand the top line of the Events hierarchy and navigate to the Image timeout element that was produced during the run.
- Select the image timeout to open the Citrix Image Synchronization view. If necessary, you can open the Citrix Image Synchronization view manually by selecting Window | Show View | Other | Test | Citrix Image Synchronization. This view shows the actual screen area encountered during the test and the expected image, as well as the corresponding hash codes or recognized text values.
- To add the actual hash code or recognized text to the image
synchronization, click the Add value
 button.
Add values to an image synchronization
Replace or add alternative values in an image synchronization element so that synchronization is not restricted to the exact recorded image. Alternative values can also be useful in updating the test if the behavior of the application changes.
If you are using optical character recognition, simply click Add in an image synchronization element in the test editor to add an alternative value, and enter a new text string in the Expected text field.
If you are using the bitmap hash code synchronization or optical character recognition, you can use the following method to add an alternative hash code or recognized text value.
To add an alternative value to an image synchronization:
- After inserting an image synchronization element, run the test from the Run menu. If possible, arrange for the alternative condition to occur before starting the run. The test should produce an image synchronization timeout when the alternative condition is encountered.
- In the Performance Test Runs view, right-click the test log container, and then select Display Test Log. The test log opens in the editor with the Overview page selected.
- Click the Events tab.
- Expand the top line of the Events hierarchy and navigate to the Image timeout element that was produced during the run.
- Select the image timeout to open the Citrix Image Synchronization view. If necessary, you can open the Citrix Image Synchronization view manually by selecting Window | Show View | Other | Test | Citrix Image Synchronization. When an image timeout is selected, this view shows the actual screen area encountered during the test and the expected image, as well as the corresponding hash codes or recognized text values.
- You can either add the new hash code or recognized text
value to the image synchronization as an alternative value or you can replace the existing value with the new value.
- To add the actual hash code or recognized text as an alternative
value, click the Add value button.
- To replace the expected value with the new value, click the Replace value
 button.
- To add the actual hash code or recognized text as an alternative
value, click the Add value
Use custom code with a Citrix test
You can write custom Java. code to expand the functions of IBM Rational Performance Tester.
Custom code requires knowledge of Java programming and the use of the RPT API.
To use custom code for test synchronization:
- In the test navigator, select the test element location to insert the custom code.
- Click Insert | Custom Code. A custom code test element is created in the test.
- On the Test Element Details page, click Generate Code to create a Java class based on the RPT API. You can click View Code to edit an existing class.
- In the Java editor, add the import statement for Citrix tests: import com.ibm.rational.test.lt.execution.citrix.customcode.*;
- Complete the exec method to specify the function to create.
- Save and close the Java class.
Example
The following example is custom code class that can be used as a starting point to evaluate the results of a synchronization point. You can use this template to write a class that performs a synchronization when image synchronization and window-event synchronization are not practical for your test.
import com.ibm.rational.test.lt.kernel.services.ITestExecutionServices;
import org.eclipse.hyades.test.common.event.VerdictEvent;
import com.ibm.rational.test.lt.execution.citrix.customcode.CitrixCustomCodeImpl2;
import com.ibm.rational.test.lt.execution.citrix.customcode.ICitrixCustomCode2;

public String exec(ITestExecutionServices tes, String[] args) {
	ICitrixCustomCode2 thisCode = new CitrixCustomCodeImpl2(tes);

	// to get the last VP status
	int verdict = thisCode.getLastVerificationPointVerdict();
	if (verdict != VerdictEvent.VERDICT_PASS) {

		// this example reports a message but must be adapted to your specific needs 		tes.getTestLogManager().reportMessage("last VP status: " + thisCode.verdictEventToString(verdict));

	}
	return null;
}
The following example demonstrates how you can record a screen capture during playback for debugging purposes. The screen capture is recorded in the test log and can be viewed in the Citrix image synchronization view.
import com.ibm.rational.test.lt.kernel.services.ITestExecutionServices;
import com.ibm.rational.test.lt.execution.citrix.customcode.*;

public String exec(ITestExecutionServices tes, String[] args) {

	ICitrixCustomCode2 thisCode = new CitrixCustomCodeImpl2(tes);

	// To capture and log the full screen:
	thisCode.logFullScreenCapture();

	// To capture and log a part of the screen:
	// thisCode.logPartialScreenCapture(x, y, width, height);

	// To capture and log a part of the screen to a file:
	// thisCode.savePartialScreenCapture(filename, x, y, width, height);

	return null;
}
After creating a custom code test, you can run the test as usual. If you need to debug the test, you can use the monitoring panel to insert breakpoints or to interact with the Citrix environment during execution.
Edit service tests
After recording a service test, edit the calls and message returns to include variable data (rather than the data that you recorded). You can add verification points (to confirm that the test runs as expected), transactions, conditional processing, and custom code.
Web service test editor overview
With the test editor, you can inspect or customize a test that you recorded.
The test editor lists the web service call elements for a test, in sequential order.
Test Contents displays the chronological sequence of test elements in the test.
Test Element Details displays details about the currently selected item (test, call, message return, or verification point) in the test hierarchy.
Window events are the primary test elements in a Citrix test and represent graphic objects that are drawn by the Citrix server, such as actual window, dialog boxes, menus, or tooltips. A Window event is recorded each time a window is created, destroyed, moved, or resized. The first occurrence of a window, a create window event, is displayed in bold. Window objects are typically identified by their title. If there is no window title, for example on menus or tooltips, then the test editor uses the window ID number.
web service calls can contain web service message return elements, which display the results of the web service call. The XML message content can be displayed either in Form, Tree or Source view. Each of these views displays the same message content in different forms:
- Form view provides a simplified view of the call elements focused on editing the values of the XML message content.
- Tree view provides a hierarchical view of the XML structure, including elements, namespaces, and the associated values. Tree view also allows you to manipulate XML fragments.
- Source view displays the XML contents of a web service or XML call or the plain text contents of a simple text message.
Message return elements can contain verification point elements that check that the actual return results match expected criteria.
Some actions contain data that is highlighted. This highlighting indicates that the data can be used as a datapool candidate or as a reference.
In service calls and message returns, you can use datapools and data correlation on values contained in the XML or on XML fragments. To use data correlation on XML fragments, switch to the Tree view, right-click the XML element and select Create XML Fragment.
To view or modify the color coding in web service tests, click...
-
Window | Preferences | Test | Test Editor | Fonts and Colors tab
Click Add to add elements to the selected test element. Alternatively, you can right-click a test element and select an action from a menu.
The choices that you see depend on what you have selected. For example, inside a web service call, you can add a web service message return. The Insert button works similarly. Use it to insert an element before the selected element. The Remove button allows you to delete an item.
Verify application behavior
To check the expected behavior of the application during a service test, you can add verification points after a message return. During the run, verification points produce a pass, fail, error, or inconclusive status in the Web Service Verification Point report.
Add equal verification points
Equal verification points enable you to check that the contents returned by a service match exactly the contents specified in the verification point. When you add verification points, the results from a service response are compared with the expected data specified in the verification point test element. Equal or contain verification points enable you to directly compare the XML document that the service returns.
- Contain verification points return a Pass status when the response XML document contains the expected XML data.
- Equal verification points return a Pass status when the response XML document matches exactly the expected XML data.
- Open the test editor, and right click a response element and select Add | Equal Verification Point.
- Select the verification point, and in the Test Element Details area of the test editor, type a name for the verification point.
- Select the verification options:
- Select Test using XML namespaces to perform the verification on the qualified structure of the XML document, including the namespace tagging, instead of the simple name. Disable this option to check only the simple name of the element and the final return value.
- Select Text XML text nodes to include the content of text elements in the verification.
- Select Text XML attributes to include the content of attributes in the verification.
- On the Message page, select the Form, Tree, or Source view to specify the expected XML data.
For an equal verification point, the expected XML data contains the XML document from the response test element. If necessary, edit the expected XML data.
You can specify standard Java. regular expressions in the Tree view. To do this, select the Regular expression column on the line of an attribute or text value and type the regular expression in the Value column. For example, the following regular expression checks for a correctly formatted email address: /^([a-zA-Z0-9_\.\-])+\@(([a-zA-Z0-9\-])+\.)+([a-zA-Z0-9]{2,4})+$/
When using regular expressions, the number of XML nodes or XML fragments in the verification point must match the quantity of expected nodes.
You can enable or disable each verification point by right-clicking the verification point in the test editor and clicking Enable or Disable.
Add contain verification points
With contain verification points, you can check that one or several elements of the XML content returned by a service match the XML fragment that is specified in the verification point. When you add verification points, the results from a service response are compared with the expected content that is specified in the verification point test element. Equal or contain verification points enable you to directly compare the XML contents that the service returns.
- Contain verification points return a Pass status when the response XML contents contain the expected XML fragment.
- Equal verification points return a Pass status when the response XML contents match exactly the entire expected XML content.
- Open the test editor, and select a service response element.
- In the Test Element Details area, click the Message tab and select the Form or Tree view.
- Expand the envelope line, right click the element to check, and then click Create Contain Verification
Point. This action creates a contain verification point that includes the XML element from the recorded response.
You can also create a contain verification point with the message response by selecting the message response in the Test Contents pane and clicking Add | Contain Verification Point. However, the result is effectively the same as an equal verification point because the verification point contains the entire XML content of the message response.
- Select the verification point, and in the Test Element Details pane, type a name for the verification point.
- Select the verification options:
- Select the Test using XML namespaces check box to perform the verification on the qualified structure of the XML document, including the namespace tagging, instead of the simple name. Disable this option to check only the simple name of the element and the final return value.
- Select the Test XML text nodes check box to include the content of text elements in the verification.
- Select the Test XML attributes check box to include the content of attributes in the verification.
- If necessary, select the Form, Tree, or Source views to edit the expected XML fragment.
For an equal verification point, the expected XML data contains the XML document from the response test element. If necessary, edit the expected XML data.
You can specify standard Java. regular expressions in the Tree view. Select the Regular expression column on the line of an attribute or text value and type the regular expression in the Value column. For example, the following regular expression checks for a correctly formatted email address: /^([a-zA-Z0-9_\.\-])+\@(([a-zA-Z0-9\-])+\.)+([a-zA-Z0-9]{2,4})+$/
When using regular expressions, the number of XML nodes or XML fragments in the verification point must match the number of expected nodes. The verification point returns a Pass status when all regular expressions in the XML fragment are matched.
Example
You can use a contain verification point to check that the message response contains only a specific element with a specific value. For example, consider the following message response:
<s:Envelope
xmlns:a="http://www.w3.org/2005/08/addressing"
xmlns:s="http://www.w3.org/2003/05/soap-envelope">
<s:Header>
<a:Action
s:mustUnderstand="1">http://www.w3.org/2005/08/addressing/soap/fault</a:Action>
<a:RelatesTo>uuid:ed9bc447-d739-452f-989d-cd48344d494a</a:RelatesTo>
</s:Header>
<s:Body>
<s:Fault>
<s:Code>
<s:Value>s:Sender</s:Value>
<s:Subcode>
<s:Value
xmlns:a="http://schemas.xmlsoap.org/ws/2005/02/sc">a:BadContextToken</s:Value>
</s:Subcode>
</s:Code>
<s:Reason>
<s:Text
xml:lang="en-US">The message could not be processed. This is most likely because the action 'http://Samples.ICalculator/Add' is incorrect or because the message contains an invalid or expired security context token or because there is a mismatch between bindings. The security context token would be invalid if the service aborted the channel due to inactivity. To prevent the service from aborting idle sessions prematurely increase the Receive timeout on the service endpoint's binding.</s:Text>
</s:Reason>
<s:Node>http://www.w3.org/1999/xlink</s:Node>
<s:Role>http://www.w3.org/1999/xlink</s:Role>
<s:Detail
xmlns:tns0="http://schemas.com/2003/10/Serialization/"
xmlns:tns15="http://Samples.Windows"
tns0:Id="id"
tns0:Ref="idref">
<tns15:GetCallerIdentityResponse>
<tns15:GetCallerIdentityResult>str</tns15:GetCallerIdentityResult>
</tns15:GetCallerIdentityResponse>
</s:Detail>
</s:Fault>
</s:Body>
</s:Envelope>
To check for the Subcode element, the expected content of the contain verification point is the following XML fragment:
<s:Subcode
  xmlns:a="http://www.w3.org/2005/08/addressing"
  xmlns:s="http://www.w3.org/2003/05/soap-envelope">
   <s:Value
   xmlns:a="http://schemas.xmlsoap.org/ws/2005/02/sc">a:BadContextToken</s:Value>
</s:Subcode>
By default, the contain verification point checks whether an element named Subcode contains one element named Value. You can use the following options:
- Test using XML namespaces: With this option, the verification point checks whether an element named "http://www.w3.org/2003/05/soap-envelope":SubCode contains one element named "http://www.w3.org/2003/05/soap-envelope":Value.
- Test XML text node: With this option, the verification point also checks whether the element named Value contains the text a:BadContextToken.
- Test XML attributes: With this option, the verification point also checks that the attributes match the expected XML fragment. In this example, the Test XML attributes option is not necessary because the Subcode element does not have any attributes.
To check that the Detail element properly returns a specific value for GetCallerIdentityResult, the expected content of the contain verification point is the following XML fragment:
<s:Detail
 xmlns:a="http://www.w3.org/2005/08/addressing"
 xmlns:s="http://www.w3.org/2003/05/soap-envelope"
 xmlns:tns0="http://schemas.com/2003/10/Serialization/"
 xmlns:tns15="http://Samples.Windows"
 tns0:Id="regular_expression"
 tns0:Ref="idref">
  <tns15:GetCallerIdentityResponse>
    <tns15:GetCallerIdentityResult>IdentityValue</tns15:GetCallerIdentityResult>
  </tns15:GetCallerIdentityResponse>
</s:Detail>
You can use the following options:
- Test XML text node: With this option, the verification point also checks whether the element named GetCallerIdentityResult contains the text IdentityValue.
- Test XML attributes: With this option, the verification point also checks that the attribute Id referred to by tns0:Id has the expected value. You can specify a regular expression for this value by using the Regular expression column in the Tree view of the verification point. For example, tns0:Id="[a-zA-Z]" checks that the value does not contains numbers.
You can enable or disable each verification point by right-clicking the verification point in the test editor and clicking Enable or Disable.
Add Xpath query verification points
With service query verification points, you can check that a response matches an Xpath query.
When you add verification points, the results from a service response are compared with the expected data that is specified in the verification point test element. With query verification points, you can check that the number of nodes returned by an XML Path language query matches the expected number of nodes specified in the verification point.
Refer to the XPath specification for details on expressing an XPath query: http://www.w3.org/TR/xpath.
You can use the test editor to create or edit verification points.
- Open the test editor, and select a web service response element.
- Click Add, and select Query verification point.
- In the Test Element Details area of the test editor, type a name for the verification point.
- Type a valid XPath expression or click Build Expression to open the XPath Expression Builder. The XPath Expression Builder helps you build and evaluate XPath expressions based on the recorded contents of the response.
- Specify a Comparison operator (=, >, or <), and the expected number of nodes that the query should return. Click Evaluate to update the Expected Count with the actual result based on the recorded contents of the response.
You can enable or disable each verification point by right-clicking the verification point in the test editor and clicking Enable or Disable.
Because XPath expressions require that the qualified name have a prefix, XPath expressions will return null for the default namespace declared with xmlns.
Add attachment verification points
Service attachment verification points enable you to check that the attachment of a service response matches the specified criteria.
When you add verification points, the results from a service response are compared with the expected data that are specified in the verification point test element. Attachment verification points enable you to verify that an expected attachment is delivered with the response.
Attachment verification points return a Pass status when all the criteria of an attachment match the expected criteria specified in the verification point test element. If any of the criteria do not match, the verification point returns a Fail status.
You can use the test editor to create or edit verification points.
To add attachment verification points to a performance test:
- Open the test editor and select a service response element.
- Click Add and select Attachment Verification Point.
- In the Test Element Details area of the test editor, type a name for the verification point, and specify the criteria to be verified. All criteria must match in order for the verification point to pass.
- In the case of multiple attachments, set the Index of attachments to the index number of the attachment to be checked. Type 1 if there is only one attachment in the response.
- Specify the expected size in bytes of the attachment.
- Specify the MIME type and encoding of the attachment.
You can enable or disable each verification point by clicking Enable verification point in the test editor.
Add XSD verification points
XSD verification points enable you to check that the XML content of a service response comply with the rules defined in an XML Schema Definition (XSD) file.
When you add verification points, the results from a service response are compared with the expected data that are specified in the verification point test element. XSD verification points return a Pass status when the XML contents of the response are compliant with the associated XSD or a WSDL file containing XSD information.
If you add multiple XSD files to the verification, then the XML content of the response must comply with all of the XSD files.
You can use the test editor to create or edit verification points.
To add an XSD verification point to a test:
- Open the test editor and select a service response element.
- Click Add and select XSD Verification Point.
- In the Test Element Details area of the test editor, type a name for the verification point.
- Click Add XSD to add a an XSD file to the validation list or Add WSDL to add a WSDL containing XSD information. Click Open to display the XSD or WSDL contents.
You can enable or disable each verification point by right-clicking the verification point in the test editor and clicking Enable or Disable.
Add a service request
You can use service request elements in tests to send a request to the service.
- Open the test in the test editor, and select the first element in the test.
- Click Add and select Web Service Request. The Web Service Request wizard opens.
- Select one or several WSDL files in your workspace for the web service to test and click Next. If necessary, you can import a WSDL file into the workspace with the Import button.
- Select a web service port from the WSDL file and click Next.
- Select either HTTP, JMS, or WebSphere MQ depending on the transport protocol used by the web service, and provide the correct transport protocol configuration to perform the call. You can create a New transport configuration or reuse an existing one.
- Click Finish. This creates the web service request in the test editor.
- On the Message page of the request, select the Form, Tree, or Source views to edit the service request contents.
- If any resource files are to be attached to the request, select the Attachment tab. Use Add, Remove, or Edit to specify the resources that are to be attached to the request.
- If the service uses encryption, signature or other security protocols, select the Security for Request and Security for Response pages to configure the security for this particular service request or to open the WSDL security editor.
After creating elements, you can use the test editor to edit service requests. You can create a service response element to test the performance and behavior of the service. You can also replace some content values with datapool variables or a references.
Update a service response from the service
While you are developing a service test, you can send a request from the test editor to record or update the response element.
Service response elements are children of service request elements. Service tests use response elements to measure the response time between a call and the corresponding response. Response elements can also contain verification points.
You can click Update Response in the request element to complete one of the following actions:
- Record a response from the service: This method sends the request and records the actual response from the service. For services that use the IBM WebSphere MQ or JMS transport protocols, multiple responses can be recorded.
- Update the current response content: If a response exists, its contents are replaced. If multiple responses are received, the number and order of the responses are updated.
Important: After updating the response content, data correlation or verification points that referred to replaced content might no longer work.
You can use the test editor to create or edit response elements in a service test. There are three methods of adding a service response:
- Generate a response from Web Services Description Language (WSDL): If the service uses WSDL, then the response is created with the content structure that the WSDL specifies.
- Add a text response: In this response type, you specify free formatted content for the response.
- Record a response from the service: This method sends the request and records the actual response from the service.
WebSphere MQ and JMS requests can contain multiple response elements.
To add a response element to a service test:
- Open the test in the test editor, and select a service request element.
- On the Test Element Details page, click Update Response. Alternatively, right-click the service request element, and click Add | Response from Request. This action performs the service request. If the request is valid, the Update Response window opens and displays the response data.
- In the Return Preview window, review
the content of the response to ensure that it is correct. For the WebSphere MQ
and JMS protocols, if multiple responses are received, then click the arrows to view each response.
- Click the Message tab to view the contents of the response in the Form, Tree or Source view.
- Click the Attachment tab to view any resource files that were attached to the response.
- Click the Response Properties tab to view the properties of the response.
- To use the received response in the test, click Update Test. This creates the response elements as a child of the request element or updates the existing response elements with the new data.
After creating or updating response elements, you can create verification points on the response contents to test the behavior of the service.
Manually adding a response element
You can add service response elements to specify the received content of a service request. You can use the test editor to create or edit response elements in an existing service test.
Service response elements are children of service request elements. Service tests use response elements to measure the response time between a call and the corresponding response. Response elements can also contain verification points. IBM WebSphere MQ and JMS requests can contain multiple response elements.
Depending on the type of request, you can manually create several types of response elements:
- Response from Web Services Description Language (WSDL): For web services, this response type uses the WSDL file to create the specified XML structure of the response.
- XML response: This response type creates an empty response element in which you must manually create the expected XML structure. You can use an XML Schema Definition (XSD) document from the XSD catalog to assist you.
- Text response: This response type creates an empty response element, which can contain freely formatted text.
Alternatively, you can automatically create and update response content by recording the actual response content that the service returns.
To add a response element to a service test:
- Open the test in the test editor, and select a service request element.
- Create one of these elements:
- For web service requests, click Add | Response from WSDL.
- If the expected response contains XML content, click Add | XML Response.
- If the expected response contains plain text, click Add | Text Response.
- Edit the message content of the response element to reflect
to actual content that the service returns.
- Click the Message tab to view the contents of the response in the Form, Tree or Source view.
- Click the Attachment tab to view any resource files that were attached to the response.
- Click the Response Properties tab to view the properties of the response.
After creating a message return, you can create verification points on the contents to test the behavior of the service.
Edit WSDL security profiles
To ensure that your service test uses the correct security protocols to access a SOAP-based service, you must specify a security profile for the (Web Service Description Language) WSDL file. After a security profile is set up, it can be reused in multiple web service calls.
WSDL security editor overview
With the WSDL security editor you can create the SOAP algorithm stacks that are associated with a web service operation. Algorithm stacks contain digital certificate information and the security algorithms applied to messages to perform secure communication with a web service.
After you create an algorithm stack, you associate it with an operation that is specified in the Web Services Description Language (WSDL) file of the web service. Algorithm stacks remain available in the workspace and you can reuse them with other WSDL files. You can also edit a test to make the same web service call several times with different security configurations.
Use the WSDL security editor to create and edit security configurations. The WSDL security editor contains two pages that correspond to the steps of setting up a security configuration:
- Describing a security stack
- Associate a security stack with each WSDL operation
Algorithm stacks
Algorithm stacks contain one or several algorithm blocks that are arranged in a sequence of steps. Each algorithm block modifies or transforms the message content. Algorithm blocks can add timestamps to, add tokens to, encrypt, or sign messages.
Use the Algorithm Stacks page of the WSDL security editor to create stacks for service requests and responses. When a message is sent or received, each algorithm block in the stack is executed in the specified order. For example, you can define a request stack for outgoing requests that adds a timestamp, signs, and then encrypts the message content, and you can define a response stack that decrypts incoming responses. You can create as many algorithms as your application requires.
You can edit algorithm blocks and move them up and down in the stack. Encryption and signature blocks can use keystores for digital certificates. Some algorithm blocks display messages that help you enter correct information. If the contents of the algorithm block are invalid, an error icon is displayed.
Raw transaction data view
When a stack is associated with a service request or response, viewing the results of each transformation step that is applied to the XML message content can be useful. You can use the Raw Transaction Data view to look at the message content before and after each algorithm in the stack.
Digital certificate keystores
You can add digital certificate keystores to a security stack to use with encryption or signature algorithms. Keystores must be declared with their associated passwords before the algorithms that use them. Digital certificates are contained in Java. keystore files (KS, JKS, JCEKS, PKCS12, and PEM) that must be located in your workspace.
Associate stacks with WSDL operations
Use the Algorithms by WSDL operations page of the WSDL security editor to associate a security algorithm stack with each web service call and message return in the WSDL file.
Create security profiles for WSDL files
You can create SOAP security profiles for use with web service calls or message returns that require message encryption, signature or other advanced security algorithms.
Before creating a security profile, you must have a Web Services Description Language (WSDL) file in your workspace.
If the security profile uses digital certificates for encrypting or signing requests or responses, you must have the corresponding keystore files (KS, JKS, JKECS, PKCS12, or PEM) in your workspace.
- In the test navigator or project explorer, right-click the WSDL file and select Configure WSDL Security. This opens the WSDL security editor.
- Click the Security Algorithms tab. Security profiles are described by adding elements to a stack. When a service request is sent or a response is received, each element in the stack is applied to the message in the specified order. If necessary, create one security profile for outgoing requests and one for incoming responses.
- In the Security Algorithms area, click Add to create a new algorithm stack, and click Rename to change the default name.
- In the Algorithm Stack Details area, click Add to add a new algorithm element to the stack. You can add time stamps, user-name tokens, encryption, or signatures.
- Edit each element in the stack according to the requirements
of the web service.
Encryption and signature stack elements can be applied to portions of the web service call or message return document by specifying an Xpath query in User Xpath part selection. For example, you can encrypt one XML element with one encryption stack element, and another element with another stack element. You can use the Web Service Protocol Data view to help identify the correct Xpath query for this option.
You can check that the security stack is valid by clicking Tools | Validate Selected Algorithm.
- When all the stack elements are complete, ensure that the execution order is correct. If necessary, use the Up and Down buttons to change the order of elements in the stack.
- Repeat steps 4 through 7 to create as many algorithms as are required for security profile.
- Click the Algorithms by WSDL Operations tab. This page enables you to associate a security profile with each request or response operation in the WSDL.
- In the WSDL Contents column, select a service request or response.
- In the Algorithm Stack column, select a security profile from the list. If necessary, click << to open the stack on the Security Algorithms page.
After saving the security profile, the Web Service Protocol Data view displays the effect of the security profile on the XML data of the web service.
Use a security policy
The WS-Policy specification enables web services to use XML to publish their security policies either as part of the Web Services Description Language (WSDL) file (compliant with the WS-PolicyAttachment specification) or as a separate XML document. With the WSDL Security Editor, you can create a security profile that uses a policy that complies with the WS-Policy specification.
Before creating a security configuration, you must have a WSDL file in your workspace.
If the security policy uses digital certificates for encrypting or signing requests or responses, you must have the corresponding keystore files (KS, JKS, JKECS, PKCS12, or PEM) in your workspace.
When you import a WSDL containing a policy (with WS-PolicyAttachment), a security profile is automatically generated for each operation in the WSDL security editor.
- In the test navigator or project explorer, right-click the WSDL file, and select Configure WSDL Security. This opens the WSDL security editor.
- Click the Security Algorithms tab. Security profiles are described by adding elements to a stack. When a service request is sent or a response is received, each element in the stack is applied to the message in the specified order.
- In the Security Algorithms area, click Add to create a profile, and click Rename to change the default name.
- In the Algorithm Stack Details area, click Add | WS-Policy to add the WS-Policy element to the stack. You can also add time stamps, user-name tokens, encryption, or signatures.
- If the policy is included in the WSDL file, click Use policy included in WSDL (WS-PolicyAttachment), and edit the WS-Policy settings as required:
- Policy
- If you are not using the WS-PolicyAttachment specification, specify the XML policy file. Click Browse to add a policy file from the workspace or to import a policy file.
- Signature configuration
- Select this option to specify a keystore for any signature that is specified in the policy. Click Edit Security to add a keystore from the workspace or to import a keystore.
- Encryption configuration
- Select this option to specify a keystore for any encryption that is specified in the policy. Click Edit Security to add a keystore from the workspace or to import a keystore.
- Decryption configuration
- Select this option to specify a keystore for any decryption that is specified in the policy. Click Edit Security to add a keystore from the workspace or to import a keystore.
- Retrieve token from security token server (WS-Trust)
- Select this option, and click Configure to specify a Security Token Server (STS) to use with the policy.
- Additional properties
- Use this table to specify settings for the advanced properties or specific implementations of the WS-Security specification. Click Add to add a property name and to set a value.
- Check that the security profile is valid by clicking Tools | Validate Selected Algorithm.
- Click the Algorithms by WSDL Operations tab. On this page, you can associate a security profile with each request or response operation in the WSDL.
- In the WSDL Contents column, select a web service request or response operation.
- In the Algorithm Stack column, select a security profile from the list. If necessary, click << to open the stack on the Security Algorithms page.
After saving the security profile, the Web Service Protocol Data view displays the effect of the security profile on the XML data of the web service.
Implementing a custom security algorithm
You can define your own security algorithms for SOAP security profiles by implementing custom security Java. interfaces that can be used in the WSDL security editor. With custom security algorithms, you can implement proprietary security algorithms that transform the XML before sending and after receiving message content.
The custom security interface and the JAR file containing it are provided with the product in the customsecuritydefinition folder of the com.ibm.rational.test.lt.models.ws plugin. You need these interfaces to create your own algorithms.
- In the test navigator or project explorer, create a new Java class in your web service test project folder.
- Implement a security algorithm in Java using the following interface:
/**
* ***************************************************************
* IBM Confidential
*
* (c) Copyright IBM Corporation. 2008. All Rights Reserved.
*
* The source code for this program is not published or otherwise
* divested of its trade secrets, irrespective of what has been
* deposited with the U.S. Copyright Office.
* ***************************************************************
*
*/

package com.ibm.rational.test.lt.models.wscore.datamodel.security.xmlsec;

import java.util.Properties;
import org.w3c.dom.Document;


public interface ICustomSecurityAlgorithm {

	/**
	 * The following methods can be used in both case:
	 * Execution in the workbench and execution of the test.
	 */


	/**
	 * Called to process de Document that is sent over a transport.
	 * @param subject 	 */
	void process(Document subject);
	/**
	 * Called to un process a document that is received from a server.
	 * @param subject 	 */
	void unProcess(Document subject);

	/**
	 * Properties defined in the UI of the CustomSecurityAlgorithm.
	 * @param map
	 */
	void setProperties(Properties map);

	/**
	 * The following methods can only be used in terms of cast to test service interface, 	 * or in terms of access to the previous XML  information, when the jar containing 	 * the custom security algorithm is deployed in the performance test project. In 	 * this case you cannot use the algorimth directly from the workbench.
	 */

	/**
	 * This object corresponds to the ITestExecutionService object.
	 * This applies only to an algorithm that must link to the execution of the test.
	 * If you plan to use this object you will need to deploy the jar containing the 	 * implementation into your performance test project and not directly into the JRE.
	 *
	 * In case of a need of the previous xml document received from the execution you can
	 * obtain the value using:
	 * IDataArea area = ((ITestExecutionService)executionObject).findDataArea(IDataArea.VIRTUALUSER);
	 *String previousXML = (String) area.get("PREVIOUS_XML"); //$NON-NLS-1$
	 *
	 */
	void setExecutionContext(Object executionObject);
The process method modifies the XML before it is sent to the server.
The unprocess method modifies the XML after it is received from the server.
The setProperties method retrieves any properties that are defined in the security editor for this custom security interface.
The setExecutionContext method is called during test with the object ITestExecutionServices that corresponds to the message using this custom security interface.
- The custom security interface can be used either in the WSDL
security editor for web services or in XML call elements in the Local XML security tab.
- If you are testing a WSDL-based web service, right-click the WSDL file in the test navigator or project explorer to open the WSDL security editor, select the Security Algorithms page; then, under Details of selected security algorithm stack, click Add | Custom Security Algorithm.
- If you are testing an XML call, open the XML call element in the test editor, select the Local XML Security tab, and then, click Add | Custom Security Algorithm
- In custom security, click Browse Class to select the class name of the custom security algorithm, for example : ICustomSecurityAlgorithm.
- Type an Algorithm name for the custom security algorithm.
- In the properties list, use Add, Remove, or Edit to specify any properties that are used by the setProperties method in your custom security algorithm.
After saving the security configuration or the call element, the Web Service Protocol Data view displays the effect of the security algorithm on the XML data of the web service.
Add WS-Addressing to a security configuration
The WS-Addressing specification provides transport-neutral mechanisms that enable SOAP-based web services to communicate addressing information. You can use WSDL security algorithms to add WS-Addressing to your service tests.
Before adding WS-Addressing to a security configuration, you must have a service test with requests and responses that are related to a valid WSDL.
To add WS-Addressing to a WSDL security algorithm:
- Open the test, select a service request, and in the Raw Transaction Data view, select Enable the display of the XML document after the security processing.
- On the Request Stack page, click Edit WSDL Security
 .
.
If you need to edit separate security or processing algorithms for incoming responses, click Show Response Stack to add a Response Stack page to the editor. The WSDL security editor opens.
- Select the Algorithm Stacks page of the WSDL security editor, and in the Security Algorithm list, select or create a security algorithm.
- In the Stack Contents list, click Add | WS-Addressing and specify the settings that are implemented by the service.
- WS-Addressing Algorithm
- Use this block if your service uses either WS-Addressing 2004/08
or the WS-Addressing 1.0 Core standard.
- Namespace
- Specify the namespace for either WS-Addressing 2004/08 or WS-Addressing 1.0 Core.
- Action if request uses WS-Addressing
- Select the action to complete if WS-Addressing is already in the request.
- Replace anonymous address in Reply-to with:
- Select this option to generate the specified address in the Reply-to header instead of an anonymous address.
- Remove WS-Addressing from response
- Select this option to strip any WS-Addressing headers from the response.
- Save the WSDL security algorithm, and select the test editor. The WS-Addressing namespace and header XML content is displayed in the Raw Transaction Data view.
Asynchronous service testing overview
Asynchronous services use a callback interaction pattern for inter-object communications. Asynchronous services can be used, for example, in publish-subscribe systems that are provided by message-oriented middleware vendors or in system and device management domains.
WS-Notification services
Asynchronous services are standardized in the WS-Notification specifications:
- WS-BaseNotification defines the web services interfaces for NotificationProducers and NotificationConsumers. This specification includes standard message exchanges that are implemented by service providers that want to act in these roles, along with the associated operational requirements.
- WS-BrokeredNotification defines the web services interface for a NotificationBroker. A NotificationBroker is an intermediary which, among other things, enables entities that are not service providers themselves to publish messages. It includes standard message exchanges that are implemented by NotificationBroker service providers, along with the associated operational requirements of service providers and requestors that participate in brokered notifications.
- WS-Topics defines a mechanism to organize and categorize items of interest for subscription known as topics. These are used in conjunction with the notification mechanisms defined in WS-BaseNotification and WS-BrokeredNotification.
You can test web services and XML services that implement the WS-Notification specification by creating an asynchronous request inside a test. The asynchronous request contains the interfaces for the corresponding WS-Notification specification, along with a callback structure.
Proprietary asynchronous services
You can test proprietary asynchronous services that do not implement WS-Notification specifications. To test these services, you manually create a service request containing the interfaces for the service, and then, you can add the asynchronous callback structure to the request.
The XML data of the asynchronous request must contain an endpoint that specifies the URL of the callback receiver. During the test, this endpoint is used to redirect the callback to the tester instead of the real receiver.
Callback structure
To test asynchronous services, you must create an asynchronous request structure in your test as shown in the following diagram:
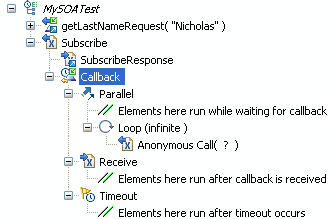
A web service request or a plain XML request provides the subscription action and contains a callback element, which describes the behavior of the test in three states:
- Parallel contains test elements that are run after the subscription request and while waiting for the notification response.
- Receive contains test elements that are run when the notification response has been received from the service.
- Timeout contains test elements that are run if the notification response is not received after a delay that is specified in the callback element.
When everything contained in the parallel, receive, and timeout elements have finished running, the run continues with the next element in the test after the asynchronous request.
The method for generating the asynchronous callback structure in the test depends on whether the asynchronous service uses the WS-Notification specification:
- WS-Notification services: Create the asynchronous request in the test.
- Proprietary services: Manually create a web service request or XML request in the test, and then add the asynchronous callback structure to the request.
Create an asynchronous request structure
You can create an asynchronous request based on the WS-Notification specification, which contains an callback structure.
- In the test editor, select the test, and click Add, and then click Specification-based Structure. The New Web Service Test wizard opens.
- On the Web Services Specification Selection page, Select WS-Notification, and click Next.
- On the WS-Notification Details page, if the service has a Web Services Description Language (WSDL) file, click Add to associate it with the call.
- Specify the Subscription identifier. You can select default identifiers for Websphere Application Server or Apache Muse; or if your service does not use a standard identifier, you can select Custom, and type the Name and Namespace of the identifier.
- In the Topic area, replace the default Name and Namespace values with those of topic of your service.
- Specify the Subscription duration. Because this is a test environment, the subscription expires after the specified delay to save server resources.
- If this is a WS-BrokeredNotification service, which implements a notify call when the subscription is received, you can select Add notify call, and type the message to be sent.
- Click Next.
- On the Configure Protocol page, select a Protocol configuration, and specify the options of the configuration. Select Generate SOAP 1.2 envelope if you are testing a SOAP 1.2 web service.
- Click Finish. This action generates in the test editor a web service call or an XML request with a callback structure containing a parallel, a receive, and a timeout element.
In the callback structure, add test elements to the parallel, receive, and timeout elements to specify the behavior of the test:
- Parallel contains test elements that are run after the asynchronous call has been sent.
- Receive specifies the message return of the callback and contains test elements that are run after the callback is received.
- Timeout contains test elements that are run if the callback is not received after a specified delay.
Add an asynchronous callback to a service request
To test a proprietary asynchronous service that does not implement the WS-Notification specification, you can add an asynchronous callback to a service request or XML request.
Manually create a web service call or XML call that invokes the asynchronous service. The call must contain an endpoint that specifies the URL of the callback receiver. This endpoint is used to redirect the callback to the tester.
If the service implements the WS-Notification specification, create the asynchronous call structure with the Create New WS-Notification Request and Callback wizard instead.
- In the test editor, select a web service or XML request, click Add, and then click Asynchronous Callback. The Create New Asynchronous Callback wizard opens.
- On the Select Callback Endpoint page, select the XML element of the request where the endpoint URL of the callback is located.
- If you have a web Services Description Language (WSDL) file for the web service, click Next. Otherwise, skip to step 5.
- On the Bind Message to WSDL Port page, select a port from the WSDL file. If the WSDL file for the service is not listed, click Add to add a WSDL file from the workspace or to import a WSDL file.
- Click Finish. This generates a callback structure containing a parallel, a receive, and a timeout element, in the test editor.
In the callback structure, you can add test elements to the parallel, receive, and timeout elements to specify the behavior of the test:
- Parallel contains test elements that are run after the asynchronous request has been sent.
- Receive specifies the message return of the callback and contains test elements that are run after the callback is received.
- Timeout contains test elements that are run if the callback is not received after a specified delay.
Create a reliable messaging call structure
You can create a test structure dedicated to testing service calls based on the WS-ReliableMessaging specification.
The WS-ReliableMessaging specification provides for a series of SOAP messages to be delivered reliably between distributed applications in the presence of software component, system, or network failures. In the context of a service test, a reliable messaging call structure consists of a series of calls that conform to the specification. The structure can be created either as a sequential list of unique service calls or a loop containing a call element and uses a datapool to identify the unique calls.
- In the test editor, select the test, and click Add, and then click Specification-based Structure. The New Web Service Test wizard opens.
- On the Web Service Specification Selection page, Select WS-ReliableMessaging, and click Next.
- Select one or several Web Services Description Language (WSDL) files in your workspace for the web service to test, and click Next. If necessary, you can import a WSDL file into the workspace with the Import push button.
- On theConfigure Protocol page, select an existing HTTP transport configuration, or click New to create a new configuration.
- Specify the URL of the service, the HTTP Method, and Version.
- In the Header table, click Add to specify any specific headers that need to be added to the call.
- In the Cookies table, click Add to specify any specific cookies that need to be used by the call.
- Click Next.
- On the Sequence Options page, specify how the sequence structure will be created in the test.
- In Message count, specify the number of calls in the list or the number loop iterations.
- Select Create service call list to generate a list of calls with the number of messages or Create loop with datapool to generate a loop with a datapool. The datapool defines the call number for each call in the loop.
- Select Shuffle sequence if you want the call numbers to be generated in a random order.
- Click Finish. This action generates a reliable messaging service call structure in the test.
Socket API test editor overview
Use the test editor to inspect or customize a socket API test that you recorded.
The test editor lists the connections and data exchanges for a test as they occurred during the recording.
Test Contents displays the flow of the socket events that constitute the test.
Test Element Details displays details about the currently selected test element in the test hierarchy.
Values can sometimes be highlighted in green. This highlighting indicates that these requests contain one or both of the following types of information:
| Datapool candidate | Value, usually one specified by the tester during recording, that the test generator determined is likely to be replaced by values in a datapool. An example of a datapool candidate is a string that you search for in a recorded test. The string is highlighted as a datapool candidate on the assumption that, before playback, you might want to associate the string with a datapool column containing appropriate substitute values. |
| Correlated data | Values in a test, usually one of them in a response and the other in a subsequent request. An example is a product price returned to the browser by a test that searches a product database. You can use these values as references that can be reused later in the test. Suppose that, before running the test with many vusers, you replace the product name searched for in the recorded test with names in a datapool. Because the test correlates the data, each virtual user searches for a different product, and the server returns an appropriate price. |
To see an illustration of color coding in performance tests or to change the color settings, click...
-
Window | Preferences | Test | Fonts and Colors
Click Add to add elements to the selected test element. Alternatively, you can right-click a test element, and select an action from a menu. The choices that you see depend on what you have selected. For example, after you select a test, you can add a new event.
The Insert button works similarly. Use it to insert an element before the selected element.
Use the other buttons (Remove, Up, Down) primarily when you substantially modify a test.
Performing actions with these buttons or choices are likely to break a recorded test.
Sometimes, the area of the editor where you need to work is obscured. To enlarge an area, move your cursor over one of the blue lines until your cursor changes shape to a vertical line with an up arrow at the top and a down arrow at the bottom, and drag up or down while holding the left mouse button.
Displaying binary data
With the Socket Details view, you can display the binary data for send and receive elements in the test. The text area of the Socket Details view supports many international character encoding standards. To open the Socket Details view, right-click a socket send or receive element, and click Show Socket Details.
In the test log, the Socket Details view also displays actual the actual binary data sent and received during a test run.
Manipulating elements in the socket test editor
Socket tests are often made of a long series of send and receive elements to or from various connections. The test editor helps you to locate specific elements and to manipulate certain types of elements in the test editor. The following examples demonstrate how you can select and manipulate large sets of test elements:
- To select all the send or receive elements in the test: Click the Select button and click Socket Send or Socket Receive.
- To locate all the connections in the test: Click the Select button and click Socket Connection.
- To disable or remove all send and receive actions to or from a specific connection: Right click a test element, click Manage Socket Connections, click Only disable them, and select the connections to disable or remove.
- To reenable all disabled send and receive actions to or from a specific connection: Right click a connection element, click Select All Related Actions, right-click again, and click Enable.
Add a socket close
You can manually add a socket close element to a socket API performance test.
In a performance test, socket close elements close the connection to a server. A socket close element relates to a specific socket connection.
Ensure that for each socket connection, there is a corresponding socket close. If not, during the test run, the operating system can run out of socket handles, causing the test to fail.
- Open the performance test in the test editor.
- In the Test Contents area of the test editor, right-click the test node, and click Add | Socket Close.
- In the Test Element Details section, click Change and select the socket connection to close. You can specify a Think Time delay before the test establishes the connection.
After you have closed a connection, you can no longer send or receive data from that connection. If any test elements use a connection after the close element, they are flagged with an error in the test editor.
Add a socket send
You can manually add a socket send element to a socket API performance test.
In a performance test, socket send elements describe how data is sent over a connection. A socket send element relates to a specific socket connection.
- Open the performance test in the test editor.
- In the Test Contents area of the test editor, right-click the test node, and click Add | Socket Send.
- In the Test Element Details section, click Change, and select the socket connection to send data to. You can specify a Think Time delay before the test establishes the connection.
- In the Data area, type the data to send. By default, data is sent as 7-bit alphanumeric characters. To specify hexadecimal bytes, prefix the data with \x, for example: \x00\xff
Add a socket receive element
You can manually add a socket receive element to a socket API performance test. In a performance test, socket receive elements describe how data is received over a connection. A socket receive element relates to a specific socket connection.
- Open the performance test in the test editor.
- In the Test Contents area of the test editor, right-click the test node, and click Add | Socket Receive.
- In the Test Element Details section, click Change and select the socket connection to receive data from. You can specify a Think Time delay before the test establishes the connection.
- Specify the End Policy. This specifies when the receive element stops receiving data and the test resumes:
- Detects inactivity: The receive action stops when no bytes are received from the connection after a delay specified in Inactivity threshold (in milliseconds). After this delay, the remote computer has finished sending the response and is considered inactive. This is the default setting.
- Receives exact number of bytes: The receive action stops when the recorded number of bytes is received. Specify a Timeout (in seconds) after which the receive action produces an error in the test log, if the correct number of bytes is not received. If Link data size is enabled, the receive action expects the number of bytes displayed in the Data area. If Link data size is disabled, the receive action expects the number of bytes displayed in Bytes.
- Receives until end of stream: The receive action stops when the connection is closed by the remote computer. If Accepts empty response is selected, then the reception of a single byte is not required and the Response Timeout is ignored. Specify a Timeout (in seconds) after which the receive action produces an error in the test log, if the correct number of bytes is not received.
- Matches a string: The receive action stops when a specified sequence of bytes is received. Specify a Timeout (in seconds) after which the receive action produces an error in the test log, if the correct number of bytes is not received.
- Recognizes a regular expression: The receive action stops when a sequence of bytes that matches a regular expression is received. Specify a Timeout (in seconds) after which the receive action produces an error in the test log, if the correct number of bytes is not received.
- In the Data area, type the data that you expect to receive. By default, data is sent as 7-bit alphanumeric characters. To specify hexadecimal bytes, prefix the data with \x, for example: \x00\xff.
Verify received content
With content verification points, you can check that actual received data matches the expected data that is specified in the verification point.
When you add verification points, the received data is compared with the expected data that is specified in the verification point test element. With content verification points enable, you can directly compare the content data that the server returns and return a Pass status when the criteria is met.
To add a content verification point to a socket test:
- Open the test editor, right click a socket receive element, and select Add | Content Verification Point.
- Select the verification point, and in the Test Element Details area of the test editor, specify the verification criteria:
- Comparison operator
- Specify the criteria to use to perform the verification, among the following operators:
- Equals
- The verification point returns a Pass status if the received data exactly matches the text or binary content that is specified in the Data area.
- Contains
- The verification point returns a Pass status if the text or binary content that is specified in the Data area occurs at least once in the received data.
- Starts with
- The verification point returns a Pass status if the text or binary content that is specified in the Data area occurs at the beginning of the received data.
- Ends with
- The verification point returns a Pass status if the text or binary content that is specified in the Data area occurs at the end of the received data.
- Differs from
- The verification point returns a Pass status if the received data does not exactly match the text or binary content that is specified in the Data area.
- Does not contain
- The verification point returns a Pass status if the text or binary content that is specified in the Data area does not occur at least once in the received data.
- Does not start with
- The verification point returns a Pass status if the text or binary content that is specified in the Data area does not occur at the beginning of the received data.
- Data
- Specify the data that is expected to be received through the connection.
- Binary
- In this view, edit the expected content as binary data.
- Raw ASCII
- In this view, edit the expected content as raw ASCII data. Bytes are expressed as 7-bit alphanumeric characters or two-digit hexadecimal bytes preceded with \x. Additionally, \r and \n stand for carriage-return and line-feed, while \\ represents the backslash character.
You can enable or disable each socket verification point by clicking Enable verification point in the test editor.
Verify received message size
With size verification points, you can check that actual received data matches the expected data size in bytes as specified in the verification point.
When you add verification points, the received data is compared with the expected data that is specified in the verification point test element. With size verification points, you can check the number of bytes in a socket receive element and return a Pass status when the criteria is met.
To add a size verification point to a socket test:
- Open the test editor, right click a socket receive element, and select Add | Size Verification Point.
- Select the verification point, and in the Test Element Details area of the test editor, specify the verification criteria:
- Comparison operator
- Specify the criteria that is used to perform the verification with these operators:
- Is
- Is less than
- Is less or equals
- Is more than
- Is more than or equal to
- Is not
- Value (bytes)
- Specify the size criteria for the verification point.
You can enable or disable each socket verification point by clicking Enable verification point in the test editor.
Verify received data with custom Java code
With custom verification points, you can use Java. code to verify the data received through a connection.
Use Java custom code requires knowledge of the Java programming language and of the Rational Performance Tester API.
When you add verification points, the received data is compared with the expected data that is specified in the verification point test element. Custom verification points return a Pass status when the custom class returns a Pass status after performing a verification written in Java code.
To add a custom verification point to a socket test:
- Open the test editor, right click a socket receive element, and select Add | Custom Verification Point.
- Select the verification point, and in the Test Element Details area of the test editor, click Generate Code. This action generates a Java class that is based on the template of the RPT API for socket custom verification points.
- Edit the Java code to define the specific verification action to perform.
- Save and close the Java class.
To modify the custom class, click View Code to open the code in the Java editor. You can enable or disable each socket verification point by clicking Enable verification point in the test editor.
Merging socket send and receive elements
With the Organize wizard, you can merge consecutive send or receive elements that use the same connection to improve the clarity of your socket test.
The wizard can perform the following actions when merging socket test elements:
- Merge consecutive socket send elements that use the same connection.
- Merge consecutive socket receive elements that use the same connection.
- Delete all socket receive elements except for the last one, which is necessary to synchronize the test.
To merge send or receive elements in a socket test:
- Select the socket send or receive elements to merge. Press the Shift key to select multiple consecutive elements in the test editor.
- Right-click the selection and click Organize Send and Receive Actions. This opens the Organize wizard.
- Choose one of the following options:
- Select Merge all selected send or receive actions to merge the selected elements.
- Select Merge all selected send and keep a single receive to delete all socket receive elements except the last one.
- Click Next.
- If your selection contained send elements that could be merged, specify the Custom Code settings that should be retained for the merged element, and click Next.
- If your selection contained receive elements that could be merged, specify the Response Timeout and End Policy settings that should be retained for the merged element, and click Next.
- Click Finish to perform the merge.
Change multiple socket send and receive elements
You can perform global changes to multiple send and receive elements in a socket test. With the Organize wizard, you can perform the following global changes on multiple send and receive elements:
- Change the Custom Code data manipulation settings on selected send elements.
- Change the Response Timeout and End Policy settings on selected receive elements
You can also apply a global change strategy that applies to all the selected send and receive elements. A change strategy can change the settings and merge send and receive elements at the same time.
To perform global changes on a series of send or receive elements:
- Select the socket send or receive elements to merge. Press the Shift key to select multiple consecutive elements in the test editor. Use the Select button to select a specific type of test element. Right-click a connection and click Select All Related Actions to select all elements that use a specific connection.
- Right-click the selection and click Organize Send and Receive Actions. This opens the Organize wizard.
- Choose one of the following options:
- To modify the selected elements, select Change settings on all selected send and receive elements.
- To modify all elements that use a specific connection, select Change settings on all elements related to a specific connection, click Next, and then select the connections for which you want to change the settings.
- Click Next.
- To change send elements, select Globally change, specify the new custom code settings for data manipulation to apply to all send elements, and then click Next.
- To change receive elements, select Globally change, specify the new response timeout or end policy settings to apply to all receive elements, and then click Next.
- Click Finish to apply the changes.
Split a socket test
After recording a test, you can split it into smaller tests. Splitting tests enables you to create modular building blocks of smaller tests and combine them to make bigger tests. The original test is unchanged. You can recombine these building blocks in a schedule, including loops and conditions.
When reusing split tests in a schedule, you must ensure that the general test structure is consistent including socket connection and close elements. For example, you must ensure that all socket send and receive elements are preceded with a corresponding socket connection and followed by a socket close element. When the split tests are recombined in the schedule, you must place them in the correct order.
- In the Test Navigator, browse to the test and double-click it. The test opens.
- Right-click a socket send or receive element in the test, and select Split Test. The page that you click is the first page of the new test.
- In the New Test Names window, confirm the location of the split, optionally provide names and descriptions for the split tests, and click Next.
- In the Split Test window, examine the changes to be performed as a result of the split, and click Finish.
Example
For example, you could record a test containing the following actions:
- Logging on to a server.
- Create an entry on the server and removing the entry.
- Edit an entry, validating that the change occurred, and restoring the entry.
- Logging off of the server.
Use custom code to specify an end policy
You can write a custom Java. class to specify when a socket receive element stops receiving. This offers the most flexibility, but requires that you write your own Java class using the Rational Performance Tester extension API.
The end policy specifies how the receive element stops receiving and allows the test to resume. There are several predefined end policies that you can choose from, for example after a certain number of bytes has been received, or when a specific string is detected. However, in some cases, a complex condition must be defined. This can be done by delegating the decision to custom code.
To create a new custom code class:
- In the test editor, select a socket receive element.
- In the End policy section, select Delegated to custom code and click Generate Code. This creates a Java class template that follows the RPT extension API. The Java class in created in the src folder of the current project.
- Write the custom code by extending the generating class.
- Save the custom code and the test. You can click View Code to edit the Java class later.
Example
The following example is a sample custom class that demonstrates how to configure a custom end policy for the internet time protocol:package test;
import java.text.DateFormat;
import java.util.Date;
import java.util.TimeZone;
import com.ibm.rational.test.lt.execution.socket.custom.ISckCustomReceivePolicy;
import com.ibm.rational.test.lt.execution.socket.custom.ISckReceiveAction;
import com.ibm.rational.test.lt.kernel.services.ITestExecutionServices;
/**
* Custom receive policy CustomReceive_TimeReceiver.
* For javadoc of ITestExecutionServices, select 'Help Contents' in the Help menu and select * 'Extending RPT functionality' -> 'Extending test execution with custom code'
*/
public class CustomReceive_TimeReceiver implements ISckCustomReceivePolicy {
// static {
// static blocks are called once on each run and allow for example to bind
// to an external dynamic library
// }
ISckReceiveAction receiveAction;
ITestExecutionServices testExecutionServices;
public CustomReceive_TimeReceiver() {
// The constructor is called during the test creation, not at the time of the execution of // the customized receive action }
public void setup(ITestExecutionServices tesRef,
ISckReceiveAction receiveActionRef) {
testExecutionServices = tesRef;
receiveAction = receiveActionRef;
}
public boolean onRead(int readByte) {
// TIME protocol (RFC 868): a connected server returns 4 bytes and closes the connection // Those 4 bytes are the number of seconds since 1900/1/1
// The test is simply made of a connection to one TIME server on port 37
// (public servers are listed here: Got time server host name from http://tf.nist.gov/service/time-servers.html),
// Then a receive delegated to this custom code class,
// Then a close
try {
if (readByte == EndOfStream) {
/* In case of success: */
receiveAction.receiveSuccess();
String message = extractAndCheckTime(receiveAction.getConnectionHolder().getFinallyReceivedBytes());
/* A message is appended in the Test Log just after this receive action: */
testExecutionServices.getTestLogManager().reportMessage(message);
return true;
}
} catch (Throwable t) {
/* In case of exception: */
receiveAction.handleException(t);
return true;
}
if (receiveAction.getConnectionHolder().getCurrentlyReceivedBytesCount() | 4) {
/* Unexpected condition: */
receiveAction.handleException(new Exception("Time protocol server returned more than 4 bytes"));
return true;
}
/* We need further bytes to complete this receive */
return false;
}
private String extractAndCheckTime(byte[] bytes) {
// This is network order, i.e. big endian
long remoteTime = ((((long)bytes[0]) & 0x00000000000000ff) << 24) +
((((long)bytes[1]) & 0x00000000000000ff) << 16) +
((((long)bytes[2]) & 0x00000000000000ff) << 8) +
(((long)bytes[3]) & 0x00000000000000ff);
// 1900 to 1970: a difference of reference, see RFC 868 and java.util.Date javadoc
remoteTime -= 2208988800L;
Date remoteDate = new Date(remoteTime*1000);
Date localDate = new Date();
DateFormat dateFormat = DateFormat.getDateTimeInstance();
dateFormat.setTimeZone(TimeZone.getTimeZone("GMT"));
String message = "Remote time: " + dateFormat.format(remoteDate) + " GMT (TIME server is " +
receiveAction.getConnectionHolder().getHostName() + ", port 37)\n" +
"Local time: " + dateFormat.format(localDate) + " GMT\n";
long diff = localDate.getTime()/1000 - remoteTime;
if (diff == 0) {
message += "-> No difference";
} else {
message += "-> Difference (seconds): " + diff;
}
return message;
}
}
Use custom code to manipulate data
You can write a custom Java. class to manipulate data in a send element. This offers flexibility for injecting data in test, but requires that you write your own Java class using the Rational Performance Tester extension API.
In some cases, complex methods of generating data are required to send specific content to the server. This can be done by manipulating data with custom code.
To create a new custom code class:
- In the test editor, select a socket send element.
- Select Manipulate data with custom code and click Generate Code. This creates a Java class template that follows the RPT extension API. The Java class in created in the src folder of the current project.
- Write the custom code by extending the generating class.
- Save the custom code and the test. You can click View Code to edit the Java class later.
Edit Kerberos tests
You can change the Kerberos realm, user name, and password when editing tests.
- In the Test Navigator, browse to the test, and double-click the test name. The test opens.
- Click the Security tab.
- Expand Kerberos. To edit the Kerberos information in a test, Enable Kerberos authentication must be selected.
- Edit the Kerberos client realm name, client key distribution center (KDC), user name, and password as necessary. The realm name, user name, and password are used for all Kerberos connections and requests in the test.
- Select Server is in a different realm than client to edit the server realm name and server KDC if the server is in a different realm than the client.
- Optional: Click Edit krb5.ini, and then type a realm name, to edit the Kerberos configuration file.
Kerberos user names and passwords can be associated with a datapool. See the related topic on providing tests with variable data to learn more about datapools.
Add test elements
You can add a variety of elements to a test, such as transaction blocks, IF-THEN conditions, loops, and comments.
Add a comment
You can add a comment to document a test.
- In the Test Navigator, browse to the test and double-click it. The test opens.
- In the test, select the item to comment.
- Click Add and then click Comment. The comment icon is placed before the selected item and the Comment text field opens.
- Add the comment to the Comment text field. The comment is added to the test.
Add a transaction to a test
A transaction is a specific group of test elements whose performance you are interested in. When viewing the test results, you can view performance data about any transactions that you have added.
To put a group of test elements into a transaction:
- In the Test Navigator, browse to the test and double-click it. The test opens.
- In the test, select the test elements to group together. Use Shift+click to select multiple contiguous elements; use Control+click to select multiple noncontiguous elements.
- Click Add (to place the transaction after the selected element) or Insert (to place the transaction immediately before the selected element or block), and click Transaction.
- You are prompted whether to move the selected objects into the transaction. Click Yes or No.
- Optional: In the transaction details, you can give the transaction a meaningful name. This is useful in the Transactions report, which lists transactions by name.
Add conditional logic
You can insert IF-THEN logic around portions of a test to make those portions run if a specific condition is met.
A conditional block can run portions of a test depending on the value of a reference or field reference. The reference or field reference must exist in the test and precede the conditional block. If the reference or field reference that the conditional block uses for input does not exist, create the reference.
The test might already contain the test elements that are to be run. If the test does contain the elements to be run, select the requests in step 2 of the procedure, and click Insert. The following instructions explain how to add a conditional block containing such requests.
Otherwise, you can create an empty conditional block at the end of the selected item (test or request). Click the object, and then click Add.
- In the Test Navigator, browse to the test and double-click it. The test opens.
- Click a page or page request. The conditional block is inserted before the selected item. By completing step 5, you can move the selected items into the block.
- Press Shift or Ctrl when clicking to select multiple pages or requests to be moved into the block. In step 6, if you add an Else block, you can select one or more of these items to be moved into the Else branch.
- Right-click the item, and select Insert | Condition (IF). You are prompted: Would you like to move selected objects into the new IF?
- Click Yes or No. The If block is inserted into the test. If you click Yes,
as shown in the example, the items that you selected are moved under If in the Test Contents area. The following example shows an If block with an HTTP test.

- To add an Else block:
- In the Test Contents area, under If, select the items to be moved to the Else block. Press Shift or Ctrl when clicking to select multiple items.
- Right-click, and select Insert | Condition (IF) - ELSE Block. You are prompted: Would you like to move selected objects into the new ELSE?
- Click Yes or No. The Else block is inserted into the test. If you click Yes,
as shown in the example, the items that you selected are moved under Else in the Test Contents area and into the Else field in the Test Element Details area. The following example shows
an If-Then-Else block with an HTTP test.

- In the Test Element Details area, under Condition add conditions:
- Next to the First operand field, click Data Source, and then select a data source to be compared with the string in the Second operand field, or type a value in the First operand field.
- In the Operator field, indicate the basis of comparison of the two operands. Note that the two operands are strings.
- Next to the Second operand field, click Data Source, and select a data source to be compared with the First operand, or type a value in the Second operand field. When the defaults are used (both operand fields set to true and the Operator field set to Equals), the block is always processed.
- In the Test Element Details area, under Options, choose the required comparison type by selecting or clearing the check boxes.
Synchronize users in tests
By inserting a synchronization point, you can coordinate the activities of a number of vusers by pausing and resuming activities. You can synchronize all vusers at the beginning of a test and stagger the release times so that the users do not overload the system. Synchronization points are also useful in stress testing. You can insert a synchronization point into a schedule or a test. You typically insert synchronization points into schedules, because they are more visible at the schedule level and you can set the Release and Timeout options within a schedule only, not within a test. However, in the following cases, insert a synchronization point into a test:
- You must control where the synchronization point is encountered. For example, you can insert a synchronization point just before a test sends a request to a server.
- You have edited a test, and the execution of a synchronization point depends on the logic that you have added.
Synchronization points within loops are not reset. In other words, after a synchronization point has been released (in the first iteration of a loop), the synchronization point stays released for all further iterations.
To insert a synchronization point into a test:
- In the Test Navigator, browse to the test, and double-click it. The test opens.
- Click the test element just below the place to add the synchronization point, and then click Insert | Synchronization point. Depending on the nature of the test element, you can insert a synchronization point at some points in the test hierarchy but not at others.
- Type a name for the synchronization point, or select the name of an existing synchronization point. The synchronization point opens in the test. Note that Release Type and Timeout are not available for synchronization points in tests. Release Type and Timeout are available only for synchronization points in schedules.
- To change the Release Type or Timeout, open the synchronization point within a schedule, and make the changes. The changes affect all instances of the synchronization point.
Add a loop to a test
You can define part of a test as a loop that runs a specified number of times. If the loop contains a synchronization point, the synchronization point is released after the first iteration of the loop and stays released for all further iterations. You can set a loop within a schedule or a test. The following table shows the advantages of both methods:
| Loop location | Results |
|---|---|
|
Schedule |
Loops in schedules are easy to locate and modify.Loops in schedules close the server connection at the end of each iteration and reopen it at the beginning of the next iteration. This action models the behavior of a user closing and reopening a browser. Use this method to run a test at a set rate. |
| Test | Loops in tests can be more granular, and thus
provide a higher level of control.
Loops in tests reuse the server connection during each loop iteration. Use this method, with loops that have high iteration counts, to stress test a server. |
- In the Test Navigator, browse to the test, and double-click it. The test opens.
- Click the page or the request that will be inside the loop. Press Ctrl when clicking to select multiple pages or requests.
- Click Insert, and select Loop.
- You are asked whether you want to move the selected elements into a the loop. Click Yes. If you click No, an empty loop is inserted into the test.
- In the Test Element Details area, type the number of iterations for the loop to repeat.
Option Description Count-based Runs for the number of iterations that you select. Time-based Runs at least for the time that you specify. The loop always finishes the iteration. For example, if you select a time of 1 second and a loop takes 10 seconds to run, the loop finishes one iteration, and then checks the time. Infinite Runs until the test stops. - Optional: Select Control the rate of iterations,
and type your preferences for the pacing rate. In specifying
a number of iterations per unit of time, you set a fixed period for the iterations to complete. If you select Randomly vary
the delay between iterations, the total delay is randomly
distributed. If you clear this check box, the same delay occurs between each iteration.
Statistically, the Randomly vary the delay between iterations option sets delay amounts at random from a negative exponential distribution with the same mean as the fixed delay value. The negative exponential distribution has a long "tail," which means that a very small number of delays will have very large values. Therefore, make sure that the application you are testing is not negatively affected by long periods of inactivity (such as a timeout that disconnects the user).
Search within tests
Search request data or response content by right-clicking in the data or content and selecting Find. To search for specific element types and to display the results in a table, click Select. For a still more powerful search and replace, use the Test Search function. You can use a number of different methods to search within a test.
- Use the Find option to search within the Test Details area and, optionally, to replace text.
- Use the Select button to search within the Test Contents area and display a table of like test elements.
- Use the powerful Test Search function to search within the Test Contents and the Test Details areas. For example, you can search for a type of verification point and also declare whether the result should include enabled verification points, disabled verification points, or verification points in both states. The specific data that you can search for and the search options are protocol-dependent.
Locating specific types of test elements
Click Select to locate elements of a specific type in the Test Contents area. The elements are displayed in a table, and you can sort the table columns. This option is useful for viewing attributes of test elements that are the same type.
- In the Test Navigator, browse to the test and double-click it. The test opens.
- To restrict the search to specific instances of elements, select them in the test. For example, you might want to search for text in specific responses, rather than in all responses.
- Click the test editor tree to give it focus, and then click Select. A list of element types opens. This list is generated dynamically based on the contents of the test. For example, if a test does not contain verification points, they are not listed.

- To include only the elements that you selected, select Restrict To Highlighted Elements.
- To include only the elements that contain specific text from the Test Contents area, select Use Filter Text.
- Select the type of test element to view from the list.
- If you selected Use Filter Text, enter the filter text in the prompt, and then click OK. To use regular expressions in the filter text, click the Search Options icon to the right of the prompt, and then select Regular expression. By default, if Regular expression is not selected, the asterisk (*) and question mark (?) are interpreted as wildcard characters. To search for a URL containing an asterisk or question mark, type a backslash (\) before the asterisk or question mark.
The Test Element Details area displays the results under the heading Multiple Items.
Example
The following example shows results for an HTTP request. Other protocols might display less detailed information. Double-click a table row to locate the element within the test. 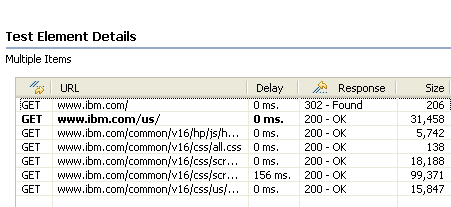
Search and replacing text in tests
With the Test Search function, you can search for text in a test or search within specific test elements and optionally replace the found text.
- In the Test Navigator, browse to the test and double-click it. The test opens.
- Right-click the test name, and then select Test Search.
- In Search for text, type the text
to locate.
You can leave this field blank, depending on your search strategy. For example, if you know that a string occurs in elements or element instances that you are not interested in, by using the options described in steps 4, 6, and 8, you can locate the elements or element instances of interest before entering the search text into this field.
- If you have selected pages or requests within the test, click More Options, and then select Restrict search to elements highlighted in Test Contents. This restricts the search to the selected pages and requests.
- To perform a case-sensitive search, select Case sensitive. To search with regular expressions, select Regular expression. In regular expression mode, press Ctrl and type a space in Search for text for content assistance. Content assistance lists the regular expression patterns and the content that they match.
- To highlight found elements in the Test Contents area, click More Options, and then select Highlight found elements in Test Contents. You can use this option with the option that is described in step 4 to designate the element instances of interest before specifying the text of interest.
- To have the search include children of the selected element, click More Options, and then select Recursive. This option is selected by default. If Recursive is cleared, then only the selected element is searched.
- To have the search locate both encoded and decoded versions of the specified text, click More Options, and then select Match encoded and decoded values. This option is selected by default. The type of encoding that the search supports varies depending on the protocol. For example, when searching in HTTP data, abc%123 and abc%25123 match.
- In the Elements to search list, select all test elements to search.
Select the check box in step 4 restricts the elements that you can select in this step to the instances that are selected in the Test Contents area. For example, if you select HTTP Pages here and only one page is selected in the Test Contents area, only that page is found. If the check box in step 4 is cleared, every test page is found.
- Optional: Click selected elements to define how to search them.
A new area opens, where you can define how to search a selected element.
To locate items, continue to the next step. To replace found strings, click Replace, and go to step 12.
- Click Search. The results of your search are displayed in two views
- The Search view, which lists the objects that contain matches
- The Test Search Match Preview view, which displays the matches that were found

- In the Search view, complete any of these search actions:
- To preview a found string in the Test Search Match Preview, click the object.
- To open your test at the location where an instance is found, double-click the object.
- To perform a different search action (such as proceed to the next match or previous match, replace), right-click the object, and select your choice.
- If you clicked Replace in step 9,
the Replace window opens. In the With field, type the replacement text.

- Select the replacement action by clicking the appropriate push button. If you are making selective replacements, found instances are displayed in the same order as in the Test Search Match Preview view. Click Replace or Skip until all found instances have been displayed.
Disable portions of a test
When you disable portions of a test, you can still see the disabled portion, but it is not executed during a run.
To disable an element in a schedule or test for any protocol, do the following:
- In the Test Navigator, browse to the schedule or test, and double-click it. The schedule or test opens.
- Right-click the element to disable, and select Disable. The element and the dependent child elements, which are disabled automatically, are shaded and preceded by two forward slashes (//)
to remind you that they are disabled.
To change the color or symbol that represents disabled elements, click...
-
Windows | Preferences | Test | Test Editor | Colors and Fonts tab
Although a disabled test element does not run, you can still work with it. For example, you can insert a test into a disabled user group for later use.
- To enable a disabled element, right-click it, and select Enable. Select Enable All to enable all disabled elements.
Example
Disable an element in a test or schedule affects other elements in the following ways:| Disabled element | Result |
|---|---|
| User group (percentage) | The percentages in the remaining user groups are recalculated. When you enable the user group again, remember to return all of the affected user groups to their original percentage. |
| User group (absolute) | The number of users in the remaining groups might not match the total number of users specified in the schedule. If so, new vusers are redistributed among the remaining user groups so that the numbers will match. When you enable the user group again, remember to return all of the affected user groups to their original totals. |
| Request containing a data correlation reference | Substitution in the remaining actions that depend on this request does not work. |
| Request containing a data correlation substituter | Substitution does not occur because the entire action is omitted. The substituter that uses the disabled data source is also disabled. To re-enable the substituter, select an enabled data source for substitution. |
| HTTP request containing a server connection | No effect. The connection is automatically created in the next request. |
| Portion of custom code | Custom code with disabled arguments is flagged. If the disabling causes an unexpected number of arguments passed to custom code elements, you receive an error at runtime. To fix this, modify the custom code to check the number of arguments. |
| IF data_source construct | An IF construct is marked as invalid if it contains a disabled data source. |
| Test element and child are disabled | If you disable a child element and then disable its parent
(for example, a request and then a page), the disabled child element will have two prefixes: one created manually and one inherited. In the following example, the first request has inherited the disabled state. The second request has been manually disabled and has also inherited the disabled state:
//disabled page 	//request
	////disabled request
Do one of the following to re-enable the second request:
|
| A data source or a range of text that will be replaced | In HTTP, the Data table displays this text in gray. |
Running test elements in random order
You can record multiple user scenarios in a test and then run each scenario in a random order. To do this, you put each scenario under a random selector and then select the proportion of time that the scenario should be run. For example, you can record a test that includes logging on to a system, browsing through items in the system, buying various items, and then totaling the order. In this case, you could run the logging in and the totaling scenarios once, but put the browsing and buying scenarios under a random selector.
- In the Test Navigator, browse to the test and double-click it. The test opens.
- Click the test element that will be controlled by the random selector, and then click Insert | Random Selector. Use Shift+Click to select multiple elements.
- You are asked whether you want to move the selected elements into a new random selector. Click Yes. Click No to insert an empty random selector
into the test.
To set whether or not elements are moved automatically, or whether you are prompted, click...
-
Window | Preferences | Test | Test Editor | General tab
- Set the weight of the random selector. The weight determines
the statistical probability that a specific element will be selected.
- If you have added a number of test elements, the Create weighted blocks window is displayed. You can select adjacent elements and group them. Each element.whether in a group or by itself.must be weighted.
- If you have added only one test element, the weighted block is displayed in the Test Element Details area with a default of 1.
Example
When a selector contains many different weights, you can mathematically determine the likelihood that a block will be executed. To do this, add the weights together and divide the weight for each block by that total.For example, assume a selector contains six blocks set to the following weight:
- two blocks set to a weight of 1
- one block set to a weight of 2
- two blocks set to a weight of 5
- one block set to a weight of 9
| Weight of block | Likelihood of block being selected |
|---|---|
| 1 (two blocks) | 1/23. = 0.0435, or about 4.35% (for each block) |
| 2 | 2/23 = 0.0870, or about 8.70% |
| 5 (two blocks) | 5/23 = 0.2174, or about 21.74% (for each block) |
| 9 | 9/23 = 0.3913, or about 39.13% |
Rename test assets
As your test assets increase and become more complex, you might want to rename them. Use the Eclipse Rename function or save the assets under a different name.
Use either of the following steps to rename a test asset:
- When you use the Eclipse Rename function,
the new name is visible in the Test Navigator, but the underlying
file system name is not changed. To use the Eclipse Rename function:
- In the Test Navigator, right-click the test asset, and then select Rename
- Type the new name, and then click Enter Be sure to click Enter, or the file will not be renamed.
- When you rename a test asset by saving it under another name, the underlying file system name is changed, but you must perform manual cleanup. To save a test asset under another name:
- In the Test Navigator, browse to the test and double-click it. The test asset opens.
- Click File | Save As, and save the asset under a different name.
- Delete the original asset.
Example
The following table summarizes how renaming an asset affects the other assets in your workspace.| Renamed asset | Effect on other assets |
|---|---|
| Project | Do not rename a project. Renaming a project might result in lost or corrupted project assets. |
| Schedule | Rename a schedule has no affect on other assets, but note that results cannot be renamed. |
| Test | When you use Rename, schedules that contain the old test name will still run correctly. To avoid confusion,
manually update the schedule to use the new test name.
After you use Save As, manually update each schedule that uses the renamed test. |
| Custom code | If you rename the custom code class (.java file), then the reference to the class in the custom code action of the test will not work. Typically rename the custom code class in the Resource perspective
or the Java. perspective.
If you change the name of the custom code class in the test editor that implements the custom code action, the modification does not change the corresponding .java file; instead the modification causes the custom code action to refer to a different (and possibly new) custom code class. |
| Datapool | When you use Rename and open a test containing the datapool, you are prompted to save the changes (in
this case, the renamed datapool that the test now uses).
After you use Save As, manually update each test that uses the datapool. |
| Location | When you use Rename, locations (agent
computers) are automatically updated in the schedules that use them.
When you use Save As, manually update each schedule that uses the test. |
| Results | You cannot rename results. |
| Weighted block | Rename a weighted block has no affect on other assets. To rename a weighted block, click the block in the test, and type the new name in the Name field. |
Delete test assets
As your test assets grow and become more complicated, you might want to delete the assets that you no longer use.
In the Test Navigator, right-click the test asset, and then select Delete. The following table summarizes how deleting an asset affects the other assets in your workspace.
| Deleted asset | Effect on other assets |
|---|---|
| Project | You are prompted whether to delete the project contents. If you click Yes, the contents are physically deleted. If you click No, you will not see the contents in the Test Navigator, but the project remains in your workspace, which is, by default, C:\Documents and Settings\username\IBM\Rationalsdpn.n/workspace). |
| Schedule | Delete a schedule has no effect on other assets. |
| Test | If you delete the test in the Test Navigator, the test is physically deleted.
If you open a schedule and delete a test, the test is deleted from the schedule, but the test remains available as a test asset. |
| Custom code | If you delete the custom code class (.java file), then the reference to the class in the custom code action of the test will not work. Typically you delete the custom code class from the Resource
perspective or the Java. perspective.
If you delete the name of the custom code class that implements the custom code action, the deletion does not change the corresponding .java file. |
| Datapool | If you delete a datapool in the Test Navigator, the datapool is physically deleted. When you open a test that uses the datapool, you are prompted to take one of these actions:
If you open a test and delete the datapool from the Common Options tab, only the reference to the datapool is deleted. |
| Location | You are not asked to confirm the deletion, nor are you warned if a user group uses the location. The user group is marked with a red X when you open the schedule containing it. |
| Results | You are asked to confirm the deletion, and the results are physically deleted. |
Debugging custom code for tests and compound tests
If you have custom code added to a test or a compound test, you can debug the custom code for any errors by clicking the Debug button.
This procedure can only be done when custom code is part of a test or compound test. If there are multiple custom code classes added to a test or compound test, the debug action debugs all the custom code classes.
You can use the debug option only in full Eclipse mode of the product. You cannot debug in the streamline mode.
- Open a test or a compound test from the Test Navigator view.
- Click the Debug button. The Debug view opens. If there are any breakpoints in the custom code, the test run pauses at the breakpoint. Press F8 to resume the test run.
Provide tests with variable data (datapools)
You can produce more realistic tests by changing them to use datapools. During execution, a test that uses a datapool replaces a value in the recorded test with variable test data that is stored in the datapool. This substitution allows each virtual user to generate a different request to the server.
Datapool overview
Datapools provide tests with variable data during a run.
When you record a test, you perform a sequence of steps that you expect a typical user to perform. From the recording, a test is generated that exactly captures these interactions. When you run this test, it uses the same data usedd during recording. To vary the data in the test, you use a datapool, which contains variable data. At run time, this variable data is substituted for the data in the recorded test.
Assume that you plan to create a test that searches the IBM website for three items: IBM RPT, IBM Rational Functional Tester, and IBM Rational Manual Tester. Here is what to do.
- Record a test that searches for one item.
- Create the datapool and associate it with the test.
- Associate a particular request in the test with a particular column in the datapool.
Create the datapool. Create a datapool with three items. The following figure shows a datapool called Search in IBM .

Record a test. Type the web address www.ibm.com/us/, search for IBM RPT, and stop recording. The following figure shows the test generated. The Datapools list, on the right, is empty. The test is not yet associated with a datapool.

Associate the test with the datapool. To associate a test with a datapool, click Add Datapool, and select the datapool. The following figure, which now contains a datapool in the Datapools list, shows the expanded test. The test elements that have a yellow background contain data that can be substituted or is already substituted (by either a datapool or data correlation, which is not discussed here).

Associate a particular request with a particular column in the datapool. When you click a request, the datapool candidates are displayed in green in the Test Element Details area, and they are identified as such when you click them. The following figure identifies IBM+Rational+Performance+Tester as a datapool candidate. To associate IBM+Rational+Performance+Tester with a datapool column, select it, right-click, and click Substitute | Select Data Source.
If part of the Test Element Details area is obscured, move your cursor over one of the blue lines until it changes to a , and drag up or down while holding the left mouse button.
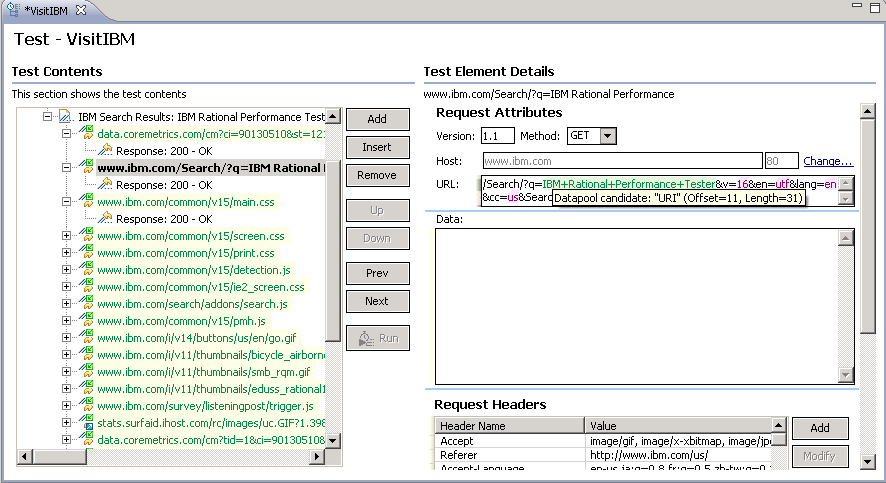
After you have associated the request with the datapool column, IBM+Rational+Performance+Tester changes to a dark green background to indicate that it is associated to a datapool, as shown in the following figure. Items that have been modified are displayed in italics; the italics are removed after you save the test.
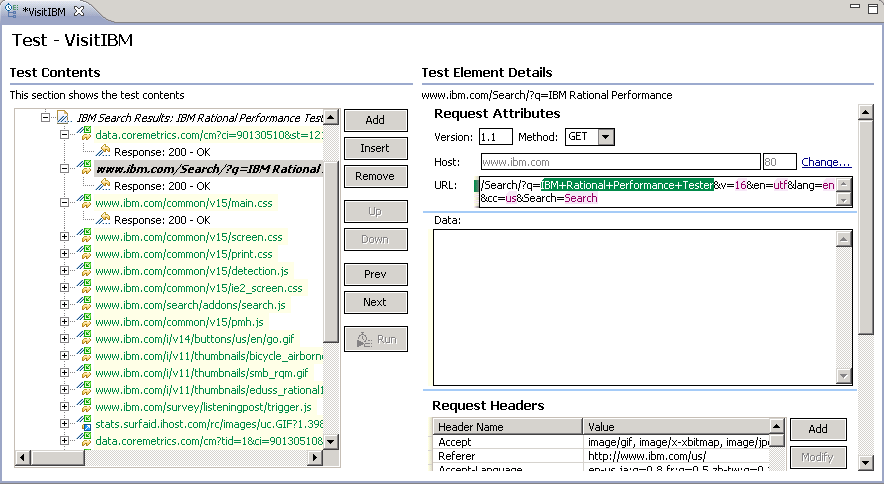
Create a datapool associated with a test
You can create datapools that contain variable data for tests to use when they run. This is the preferred way to create a datapool, because the datapool is automatically associated with a test. You can create anything from an empty datapool containing one column, which edit later, to a fully functioning datapool.
- In the Test Navigator, browse to the test and double-click it. The test opens.
- In the Test Contents area, click the name of the test.
- In the Common Options tab, click Add Datapool. The options, listed in the following table, enable you to create anything from a simple datapool that edit later to a complete datapool.
To create Do this in the Test Editor - Add Datapool window A one-column datapool with a default access mode. In Existing datapools in workspace, select New Datapool<testname>.datapool, and click Finish. You can optionally name the datapool column in this session, and you can add other columns and data later. A one-column datapool and choose the access mode. In Existing datapools in workspace, select New Datapool<testname>.datapool, and click Next. You are prompted for the access mode. You can optionally name the datapool column in this session, and you can add other columns and data later. An association between the test and an existing datapool. Select the datapool. The datapool is associated with the test, and you can optionally set the access mode in this session. A new, fully functioning datapool. Select a project and click Use wizard to create new datapool. - Select the Open mode for the datapool.
This mode determines the view that vusers have of the datapool. Different tests can open the same datapool differently, and you can change the open mode later by opening the test and double-clicking
the datapool title.
Option Description Shared (per machine) (default) Virtual users on each computer draw from a shared view of the datapool, with datapool rows apportioned to them collectively in sequential order, on a first-come-first-served basis.
This option makes it likely that the vusers or loop iterations will use data from different rows and that the server will see variable data. The exact row access order among all vusers or iterations cannot be predicted, because this order depends on the test execution order and the duration of the test on each computer.
Private Each virtual user draws from a private view of the datapool, with datapool rows apportioned to each user in sequential order.
This option ensures that each virtual user gets the same data from the datapool in the same order. However, because each user starts with the first row of the datapool and accesses the rows in order, different vusers will use the same row. The next row of the datapool is used only if you add the test that is using the datapool to a schedule loop with more than one iteration.
Segmented (per machine) Virtual users on each computer draw from a segmented view of the datapool, with data apportioned to them collectively from their segment in sequential order, on a first-come-first-served basis. The segments are computed based on how a schedule apportions vusers among computers. For example, if a schedule assigns 25% of users to group 1 and 75% to group 2, and assigns these groups to computer 1 and computer 2, the computer 1 view will consist of the first 25% of datapool rows and the computer 2 view will consist of the remaining 75% of rows.
This option prevents vusers from selecting duplicate values (for example, account IDs). If you disable wrapping, no row can be used more than once.
- If you are setting how the test accesses the datapool during this session, select one of the following options. Different tests can access the same datapool differently, and you can change the access mode later by opening the test and double-clicking the datapool title.
- Sequential: Rows in the datapool are accessed in the order in which they are physically stored in the datapool file, beginning with the first row and ending with the last.
- Random: Rows in the datapool are accessed in any order, and any given row can be accessed multiple times or not at all. Each row has an equal chance of being selected each time.
- Shuffled: Before each datapool access, the order of the rows is changed, and a different sequence results. Rows are accessed randomly but all rows must be selected once before a row is selected again.
Think of the nonsequential access order (Random and Shuffled) as being like a shuffled deck of cards. With Random access order, the selected card is returned anywhere in the deck, which means that one card might be selected multiple times before another is selected once. Because you never reach the end of the deck, Wrap when the last row is reached is unavailable. With Shuffled access order, the selected card is returned to the bottom of the deck. After each card has been selected once, you either resume selecting from the top with the same access order (Wrap when the last row is reached is Yes), or no more selections are made (Wrap when the last row is reached is No).
- Select one of the following options.
Option Description Wrap when the last row is reached By default, when a test reaches the end of a datapool or datapool segment, it reuses the data from the beginning. To force a test to stop at the end of a datapool or segment, clear the check box beside Wrap when the last row is reached. Forcing a stop might be useful if, for example, a datapool contains 15 records, you run a test with 20 vusers, and you do not want the last five users to reuse information. Although the test is marked Fail because of the forced stop, the performance data in the test is still valid. However, if it does not matter to your application if data is reused, the default of wrapping is more convenient. With wrapping, you need not ensure that your datapool is large enough when you change the workload by adding more users or increasing the iteration count in a loop.
This option is unavailable with the Random option, because with random access, there is, in effect, no end of file.
Fetch only once per user By default, one row is retrieved from the datapool for each execution of a test, and the data in the datapool row is available to the test only for the duration of the test. Select Fetch only once per user to specify that every access of the datapool from any test being run by a particular virtual user will always return the same row.
To illustrate how these options affect the rows that are returned, assume that a test contains a loop which accesses a datapool. The loop has 2 iterations. The following table shows the row that is accessed in each iteration:
Datapool option Iteration 1 Iteration 2 Sequential and Private row 1 row 2 Shared and Shuffled row x row y Fetch only once per user row x row x - If you are creating a fully functioning datapool, you can optionally import the data from a CSV file during this session. You can import data later by clicking File | Import | Test | Datapool, and selecting a CSV file.
After you have created a datapool and added data to it, the next step is to associate a value in the test with a column in the datapool
Create a datapool in the workspace
You can create datapools in the workspace containing variable data that tests use when they run. Use this method to create a datapool if you have not yet created the test that will use it.
- Click File | New | Datapool.
- In the New Datapool window, click the project that will contain the datapool. The project is displayed in the Enter, create, or select the parent folder field.
- In the Name field, type the name of the datapool, and then click Next.
- In the window for describing the datapool, optionally add a description, and then click Next.
- In the window for initializing the new datapool with the contents of a comma-separated value file, go to the CSV
File field and type the name of a CSV file, or click Browse to navigate to the file.
If you do not want to use a CSV file to initialize the data, click Finish. An empty datapool opens for you to enter data directly.
- If the data in the CSV file is encoded differently from what the local computer expects, select the encoding from the Import Encoding list.
- The first row of the CSV file can contain column names. If it does, select the First row contains variable names and suggested types check box. If this check box is not selected, columns are named Variable1, Variablen ... You can change the names when you edit the datapool.
- Typically, leave the First column contains equivalence class names check box cleared. Equivalence classes are used in functional, rather than performance, testing. Select this check box if you are using a datapool for both functional and performance testing, and the datapool already contains equivalence classes.
- Click Finish.
The new datapool opens. The following figure shows a datapool that has already been populated from a CSV file.
After you have created a datapool and added data to it, follow these steps to:
- Associate a test with the datapool
- Associate a value in the test with a column in the datapool
How datapool options affect values that a virtual user retrieves
The Open, Access, and Wrap modes that you select for a datapool affect the values that a virtual user retrieves. The Wrap mode also affects segmented datapools.
The following table lists the most common types of datapools and the options that you select to create them.
| Datapool purpose | Open mode selection | Access mode selection | Wrap mode selection |
|---|---|---|---|
| The datapool provides unique data values with in random order for every attempted transaction. The datapool is reset between test runs so that data can be reused. | Segmented | Shuffled | Fetch only once per user |
| The datapool provides unique data values in any order for every attempted transaction. You determine which values are used so the values can be deleted and not reused in later test runs. | Segmented | Sequential | Fetch only once per user |
| The datapool enables each virtual user get and keep a single unique data value throughout the virtual user's tests | Segmented | Sequential | Fetch only once per user |
| The datapool provides randomly chosen nonunique data values to all users. | Shared | Random | Wrap when the last row is reached |
| The datapool cycles through all data values without any concern for value reuse. | Segmented | Sequential | Wrap when the last row is reached |
How rows are assigned in segmented datapools
If a datapool is segmented, a fixed number of rows is assigned to each location. This number is completely independent of the number of users that run the test containing the datapool. Instead, the number of rows assigned to a location is proportional to the number of vusers assigned to that location. For example, assume that a schedule contains 25 vusers, and 5 users are assigned to run at a specific location. This means that 20 percent of the data runs from each segmented datapool are the assigned rows for this location. All values are taken from that segment, or .slice,. of the datapool. Once those row values are exhausted, the datapool either wraps back to the first row of its assigned segment or, if no wrap mode is set, gives a null value.Import a CSV file into a datapool
If you need to create a new datapool with a large number of records, you can initialize the datapool quickly by importing data from a comma-separated-value (CSV) file.
- Use a spreadsheet or a simple text editor, create a CSV
file containing the data to be included in the datapool. The first line of the file can contain the descriptive names of the variables (columns). For example you might include these column titles: Inventory or Description. Here is an example of a spreadsheet file:
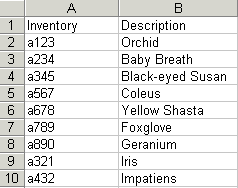
- Click File | Import, and expand Test.
- In Test, select CSV File as Datapool, and then click Next.
- In the Import CSV File as Datapool window, complete these steps:
- Click Browse to navigate to the CSV file.
- If the data in the CSV file is encoded differently from what the local computer expects, select the encoding from the Encoding list.
- The first row of the CSV file can contain column names. If it does, select the First row of the CSV file contains the variable names and optional suggested types check box. If this check box is not selected, columns are named Variable1, Variable2 and so on. You can change the names when you edit the datapool.
- The first column of the CSV file can contain equivalence class names. Typically, leave the First column of the CSV file contains the equivalence class names and optional record numbers check box cleared. Equivalence classes are used in functional, rather than performance, testing. Select this check box if the CSV file contains equivalence classes. If this check box is not selected, the data from the CSV file will be imported into one equivalence class.
- Click Next.
- To import into an existing datapool, select Import into an existing datapool, and then select the datapool.
- Select Append to existing records to add rows to the datapool. Select Replace existing records to replace rows in the datapool.
- To create a datapool, click Next, select a folder, and type the name of the new datapool.
- Click Finish. The data from the CSV file is imported into the datapool.
Example
The following figure shows the datapool with the imported data.
Enable a test to use a datapool
Before a test can use variable data from a datapool, you must update the test to include a reference to that datapool.
- In the Test Navigator, browse to the test and double-click it. The test opens.
- Right-click the test name, and click Add | Datapool. The Import Datapool window opens, listing the datapools available to the test. If a test is already using a datapool, it does not appear in the list.
- In the Matching Resources list, click the name of the datapool that your test will use.
- Select the Open mode for the datapool.
This mode determines the view that vusers have of the datapool.
Option Description Shared (per machine) (default) Virtual users on each computer draw from a shared view of the datapool, with datapool rows apportioned to them collectively in sequential order, on a first-come-first-served basis.
This option makes it likely that the vusers or loop iterations will use data from different rows and that the server will see variable data. The exact row access order among all vusers or iterations cannot be predicted, because this order depends on the test execution order and the duration of the test on each computer.
Private Each virtual user draws from a private view of the datapool, with datapool rows apportioned to each user in sequential order.
This option ensures that each virtual user gets the same data from the datapool in the same order. However, because each user starts with the first row of the datapool and accesses the rows in order, different vusers will use the same row. The next row of the datapool is used only if you add the test that is using the datapool to a schedule loop with more than one iteration.
Segmented (per machine) Virtual users on each computer draw from a segmented view of the datapool, with data apportioned to them collectively from their segment in sequential order, on a first-come-first-served basis. The segments are computed based on how a schedule apportions vusers among computers. For example, if a schedule assigns 25% of users to group 1 and 75% to group 2, and assigns these groups to computer 1 and computer 2, the computer 1 view will consist of the first 25% of datapool rows and the computer 2 view will consist of the remaining 75% of rows.
This option prevents vusers from selecting duplicate values (for example, account IDs). If you disable wrapping, no row can be used more than once.
- Select the Access mode for the datapool:
- Sequential: Rows in the datapool are accessed in the order in which they are physically stored in the datapool file, beginning with the first row and ending with the last.
- Random: Rows in the datapool are accessed in any order, and any given row can be accessed multiple times or not at all. Each row has an equal chance of being selected each time.
- Shuffled: Before each datapool access, the order of the rows is changed, and a different sequence results. Rows are accessed randomly but all rows must be selected once before a row is selected again.
- Select whether the test will reuse data when it reaches
the end of the datapool.
By default, when a test reaches the end of a datapool or datapool segment, it reuses the data from the beginning. To force a test to stop at the end of a datapool or segment, clear the check box beside Wrap when the last row is reached. Forcing a stop might be useful if, for example, a datapool contains 15 records, you run a test with 20 vusers, and you do not want the last five users to reuse information. Although the test is marked Fail because of the forced stop, the performance data in the test is still valid. However, if it does not matter to your application if data is reused, the default of wrapping is more convenient. With wrapping, you need not ensure that your datapool is large enough when you change the workload by adding more users or increasing the iteration count in a loop.
- Select whether the test will make the data in the datapool record permanent for each virtual user.
By default, one row is retrieved from the datapool for each execution of a test, and the data in the datapool row is available to the test only for the duration of the test. Select Fetch only once per user to specify that every access of the datapool from any test being run by a particular virtual user will always return the same row.
To illustrate how these options affect the rows that are returned, assume that a test contains a loop which accesses a datapool. The loop has 2 iterations. The following table shows the row that is accessed in each iteration:
Datapool option Iteration 1 Iteration 2 Sequential and Private row 1 row 2 Shared and Shuffled row x row y Fetch only once per user row x row x - Click Select. A reference to the datapool is added to the test, and the Test Element Details area is updated with the datapool information.
- Save the test.
Now that you have created a reference between the test and the datapool, the next step is to associate a value in the test with a column in the datapool.
Associate a test value with a datapool column
After you have created a datapool and have enabled your test to use the datapool, you associate a specific value in the test with a specific datapool column.
- In the Test Navigator, browse to the test and double-click it. The test opens.
- Locate and click a request containing a value to replace
with variable data.
Clicking a test page shows you a table that lists datapool candidates and correlated data on that page. (If correlated data is not displayed, right-click the table and verify that Show References is selected.) References are shown in blue letters and datapool candidates are shown in black letters.

If the contents of the Value column corresponds exactly with column data in your datapool, click the row, and then click Substitute. The Select Data Source window opens. Skip to step 6. You can ignore step 8, because URL encoding is preselected.
Otherwise, double-click the row to navigate to the page request containing the value to replace from a datapool, and continue to the next step.
The value to replace from a datapool might not be listed in any page table. In this case, manually locate the request string that includes the value.
- If the value to replace from a datapool is part of a string that has been designated a datapool candidate, you must remove the light green highlight: right-click and select Remove Substitution. For example, if you searched for doe, john in your test, the datapool candidate in your test is displayed as doe%2C+john. Suppose that you do not want to associate this candidate with a single datapool column containing data in the format doe, john. Instead, you want to associate doe and john with separate datapool columns. In this case, you must first remove the substitution.
- Highlight the value: With the left button pressed, drag your mouse over the value.
- Right-click the highlighted value, and select Substitute | Select Data Source.
The Select Data Source window opens.
To use a datapool that is not listed, click Datapool: the Select datapool column window opens.
- Click the name of the datapool variable, or column, to associate with the test value.
- Click Select.
To indicate that the association has been set, the highlighting for the selected test value turns dark green, and the datapool table for this page is updated as shown in the example.
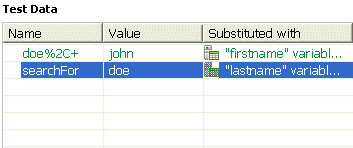
- Optional: Encode variable data when it is substituted
from a datapool.
If a test value contains special characters such as spaces or commas, click the row and select URL Encode. With this option, special characters are encoded when variable data is substituted from a datapool. For example, data that is space-separated in a datapool column might need to be encoded. When URL encoding is enabled, John Doe is substituted as John%20Doe. If URL encoding is not selected, the variable data that is substituted is literal. Do not enable URL encoding for datapools that contain data that is already encoded.
- Save the test.
View datapool candidates when you open a test
Datapool candidates are displayed automatically when you open a test for the first time. From the datapool candidates window you can view the datapool candidates in the test, bookmark locations of interest, and add or remove datapool references.
- Record a test. When the test opens for the first time in the Test Navigator, the Show Datapool Candidates window is displayed. The Show Datapool Candidates window is displayed only if there are datapool candidates and if Always display this dialog when a test is first opened is selected. To prevent the Show Datapool Candidates from being displayed when a test opens, clear the Always display this dialog when a test is first opened check box in the Show Datapool Candidates window.
- Do one of the following:
Option Description To view details about the datapool candidates in a test Navigate through the Datapool Candidates field to see them previewed in the Preview pane. Click the Next and Previous icons to move the selection down or up in the list of datapool candidates. Click the Show as Tree icon to toggle between tree format and list format. Click the Sort icon to sort the list of datapool candidates. Click the Bookmark icon to bookmark a location for later review. To select a data source for a datapool candidate Select the datapool candidate in the Datapool Candidates field, and then click Substitute. The Select Data Source window opens. To find more values in the test that have the same value as the selected datapool candidate Click Find More and Substitute. These values can be reviewed and substituted interactively as needed. To remove a substitution Select a substitution site, and then click Remove Substitution. - Click Close to close the Show Datapool Candidates window and proceed to the test in the test editor. To display the Show Datapool Candidates window again while in the test editor, click the root node of the test. Then click the Common Options tab under Test Element Details, and then click Show Datapool Candidates.
Edit a datapool
You can add, modify, or remove data from a datapool, similar to the way you work with a spreadsheet using the Datapool Editor.
If your datapool changes are extensive, it might be easier to delete the datapool, enter the revised data into a CSV file, and import the data into a new datapool. If your changes are minor, it is easier to edit the datapool.
- In the Test Navigator, double-click the datapool to open the Datapool Editor.
Option Description To change the data in a cell Type over the data, just like you would do in a spreadsheet. To add a row Right-click the row above the one to be added, and select Add Record. To remove a row Right-click the row to be deleted, and select Remove Record. To add and populate a column - Click the Overview tab.
- In the Variables section, click the column above the one to be added, and click the Add button.
- Click the EquivalenceClass1 tab to display the datapool cells. To populate the cells, type directly into each one.
To change a column name - Click the Overview tab.
- In the Variables section, double-click the column name and type the correct name.
To change the order of a column - Click the Overview tab.
- In the Variables section, select the column name, and click the Up or Down buttons to manipulate the column position.
To select all rows Right-click any row, and then select Select All. Alternately, press Ctrl+A. - Close the datapool and save your changes.
Encrypted datapools overview
You can encrypt one or more columns in a datapool.
To encrypt confidential information such as a set of passwords or account numbers that are used during a test, you can use an encrypted datapool. Datapool columns are encrypted using the RC4 private-key algorithm. You can use only one password to encrypt columns in any given datapool. Encrypted datapools are not supported on agent computers that are running the z/OS or AIX operating systems.
Important: If you forget the password to a datapool, there is no way to recover the password.
When you run a test that uses a datapool containing encrypted variables, you are prompted for the datapool password. If the test uses multiple encrypted datapools, you must enter the password for every encrypted datapool that the test uses.
When you run a test that uses a datapool with an encrypted column, the value of the column is decrypted at run time. The column value is sent as a cleartext string in the requests to the server. The actual values of the encrypted datapool variables are not displayed in the test log. The test log displays asterisks for the encrypted datapool variables.
To see the actual values of variables that are sent to the server at run time, use custom code. Send the datapool column value to custom code that writes the value to a file other than the test log. If the custom code writes to the test log using tes.getTestLogManager().reportMessage(), then asterisks are displayed instead of the decrypted variables.
Encrypting datapools
You can encrypt datapool columns.
Create a test containing a datapool.
- Open a datapool for editing.
- Click the heading of the column to encrypt. The Edit Variable window opens.
- Select Encrypted, and then click OK. The Enter Password window opens.
- Type the password to use to encrypt the column. If you have already encrypted other columns in the datapool, you must enter the password usedd previously. You can use only one password to encrypt columns in a datapool.
- Click OK. Asterisks are displayed instead of the actual values of encrypted variables.
The datapool column is encrypted.
If you forget the password to a datapool, there is no way to recover the password.
Remove encryption from datapools
You can remove encryption from a datapool variable.
Create a test that includes an encrypted datapool.
- Open a datapool for editing.
- Click the heading of the column from which you want to remove encryption. The Edit Variable window opens.
- Clear the Encrypted check box, and then click OK. The Enter Password window opens.
- Type the password usedd to encrypt the column.
- Click OK. The values of the variable are displayed.
Change passwords on encrypted datapools
You can change the password of an encrypted datapool.
Create a test containing a datapool with at least one encrypted column.
- Open a datapool for editing.
- Click the heading of an encrypted column.
- Click Modify Password.
- Type the old password and the new password.
- Click OK.
The password on the encrypted datapool is changed.
Import to encrypted datapools
You can import data from a .csv file to an encrypted datapool.
Create a test containing an encrypted datapool.
- Click File | Import | Test | Datapool.
- Click Next.
- Click Browse, and then select the .csv file to import.
- Click Next.
- Select Import to an existing datapool.
- Under Datapools, select the datapool into which you want to import the .csv file.
- Type the password for the datapool in the Password for datapool_name field.
- Click Finish.
Export from encrypted datapools
You can export data from an encrypted datapool.
Create a test containing an encrypted datapool.
- Click File | Export | Test | Datapool.
- Click Next.
- Click Browse, and select the .csv file to which you want to export the datapool.
- Click Next.
- Select the datapool to export to the .csv file.
- Type the password for the datapool in the Password for datapool_name field.
- Click Finish.
Use a digital certificate store with a datapool
You can associate the certificates in one or more certificate stores with a datapool to use multiple digital certificates during testing.
- Open a test for editing. On the Common Options page, click Add Datapool.
- Create a datapool with two columns containing a list of the certificates in the certificate store and a list of passphrases for the certificates.
- Select Fetch only once per user.
- Save the datapool.
- On the Security page, under Digital Certificates, click Add.
- Select a certificate from the certificate store that you created previously.
- Type the passphrase for the selected certificate.
- When prompted to datapool the digital certificate, click Yes.
- In the Select datapool column wizard, choose the datapool that you added previously, and substitute the appropriate columns for the certificate name and passphrase.
- Save the test, and then add the test to a schedule.
When you run this schedule, the certificates from the certificate store are submitted to the server.
Navigating between a datapool and a test
After you have created a datapool or imported a comma-separate values (CSV) file into a datapool, you can navigate between the datapool and associated tests in the test editor. You can enlarge the test and the datapool, list the datapools that a test uses, navigate from a row in a datapool to the corresponding element in the test, see the data for a page or request, and add or remove datapool references.
- In the Test Navigator, browse to the test and double-click it. The test opens.
- Do one of the following actions:
Option Description Maximize the test window Double-click the test tab (for example,  ). Do not click the x, or you will close the test.
To return to the default perspective, click...
). Do not click the x, or you will close the test.
To return to the default perspective, click...
-
Window | Reset Perspective
View the datapools that a test uses In the Test Contents area, click the first line of the test, which is the test name. Navigate from a row in a datapool to its corresponding element - In the Test Contents area, click the test name, which displays the datapool.
- Expand the datapool to display the rows.
- Double-click the row.
View the data for a page or request In the Test Contents area, click the page or request. To add a reference to a datapool In the Test Element Details area, drag your cursor over the candidate, right-click, and select Substitute | Select Data Source. The Select Data Source window opens. If you have not already added the datapool to the test, click Datapool, and then add the new datapool. Remove a reference to a datapool In the Test Element Details area, drag your cursor over the reference, right-click, and select Remove Substitution. - Save the test, if you have made any changes.
About test variables
A test variable is a user-defined name-value pair that stores and refers to information throughout a test and between tests.
Share variables among tests
A variable is declared in the test variables section of the test, but the variable can be used throughout the test as a reference for any field that can be substituted. Substituting data from a test variable is done using the Test Variables page of the Test Data Source view. A variable is given a default value when declared. The value can also be changed using a Set Variable statement. Set Variable statements are created with the Add and Insert menus of the Test Editor. Variables can be set to a hard-coded value or to a value retrieved from a data source, such as datapool or reference that appears before the Set statement.
In order to share variables between tests, both tests must contain a variable with the same name and both variables must have the Visible in option set to All tests for this user. When these conditions are met and multiple tests have been placed in a schedule, then data set in the variable by one test can be used in the other test.
A common reason to share data between tests is to perform data correlation. With data correlation, a variable is set to a response that comes from a request in one test and is used in requests performed in a different test. Assume that you are testing an employee database. The Create Employee test creates an employee record and the Modify Employee test modifies an employee record. When a new record is created, it is assigned a record ID. Variables can be used to pass the record ID from a response in the Create Employee test to the Modify Employee test.
A user-defined variable is not shared among different vusers. The variable is shared only among the different tests of the same virtual user. Also, if you set the Visible in to This test only, then data set by one test is not available to another test, even if both tests contain a variable with the same name.
Use variables to access datapools
You can define variables so that they share data from a datapool throughout tests. This is done by having the value field of a Set Variable statement substituted from a datapool. This way the first test, which appears in the schedule, can set the variable from a datapool and share it with the other test in a schedule.
Assume that you have two tests that log in to an application using a user ID from a datapool. The first test can set the value of a variable from the datapool, and both tests can use the variable, instead of directly using the datapool. In this case they both use the same record from the datapool. This is similar to the fetch-only-once-per-user behavior of a datapool. However, fetching once means that during playback a virtual user will get only one record from the datapool. The one-record limit holds even if the tests are in a loop and are run several times by the virtual user. By using the user-defined variables, the virtual user retrieves a new record each time through the loop, and both tests can use the same record.
Assignment (set) operators can not only have a variable value substituted from a datapool, but also in the declaration of a variable. In fact, you can substitute the assignment operator and variable value from any data source, and thus that value can be shared between tests as well.
Declaring and assigning test variables
When you declare a variable in IBM Rational Performance Tester, you can create a container for it, initialize it to a string or a datapool value, and set its scope. Then, within the test, you can reassign another value to the variable.
To create, initialize, and assign a value to a test variable:
- In the Test Navigator, browse to the test and double-click it. The test opens.
- To create a container for the test variables that you create in a test:
- Open the test, and in the Test Contents area, click Test Variables, at the top of the test.
- Select Add | Test Variable Container. A container named Test Variables is created for the user-defined variables.
- Select the container to rename it. The Test Element Details area opens for you to type a new name in the Name field.
- To declare or define a test variable:
- Open the test, and in the Test Contents section, click the user-defined container to contain the variable.
- Select Add | Variable Declaration.
- Type the name of the variable, and click OK. The variable is added as the last element in the container and the Test Element Details area opens.
- In the Test Element Details area, set the scope and initial value for the variable.
Visible in: Select This test only to restrict data to the current test only. Even if another test has a variable with the same name, that variable will not change. Select All tests for this user to share the value of this variable when the test runs in a schedule. For the variable to be shared, both tests must have a variable with the same name and must have this option enabled.
Check Value: Select When first used to check whether or not a variable is initialized only after the test execution reaches the first request that uses a variable. Select At test start to check whether or not a variable is initialized when starting the execution of the test. If the variable is not initialized, then an error message is displayed, depending on the behavior set.
If not initialized, set to: Select Text to initialize the variable to a specific value whenever the test runs in the schedule. Select Datapool value and, in the Select Data Source window, select the datapool that will initialize the variable.
Run-time error if variable not initialized: Select the action for the run when it encounters an uninitialized test variable. If you select Issue test log warning or Issue test log error, verify that the Test log page in the schedule sets errors, failures, and warnings to All, which is the default setting. If you select Exit the test, the schedule continues to run although the vusers that have the uninitialized variable stop. If you select Do nothing, the test continues to run.
- To
assign or initial a value to a test variable:
- Open the test, and in the Test Contents area, select a test element.
- Select Insert | Variable Assignment, which inserts the assignment before the selected element. The Test Editor window opens and lists the variables available to the test.
- Select the variable that you are assigning a value to and, in the Set to box in the Test Element Details area, set the value for the variable. You can set the value to a text string, to any data source that exists in the test before the assignment statement, or to Not initialized. A Set statement is added to the test, with the value you chose.
Initializing variables from the command line
To initialize test variables from an XML file, you can run the test from the command-line interface using the varfile option.
- Declare the variables using IBM Rational Performance Tester.
-
Verify that a supported Java executable file (java.exe) is in your path before you attempt to run a schedule or test from the command line. A supported Java executable file is provided with the product:
- On UNIX operating systems, the executable file is installed by default in the /opt/IBM/SDP/jdk/bin/ directory.
- On Windows operating systems, the executable file is installed by default in the C:\Program Files\IBM\SDP\jdk\bin\ directory.
- On Linux, an X server must be available, even when run from the command line. For more information, see Running tests from the command line on Linux.
- Create an XML file containing the variables with values. The XML file would have a structure similar to the following image

- To run a schedule or test from the command line, go to the directory containing the cmdline.bat and cmdline.sh files. On Windows operating systems, this directory is typically C:\\IBM\IBMIMShared\plugins\com.ibm.rational.test.lt.cmdlineexecuteversion_date.
- Issue the following command:
cmdline -workspace workspace_full_path -project proj_rel_path -eclipsehome eclipse_full_path -plugins plugin_full_path -schedule sched_rel_path -suite suite_rel_path -varfile variable_file_full_path -servicename service -serviceargs service_args -configfile file_full_path -results result_file -overwrite {true | false} -quiet -users nn -vmargs JVM_args -exportlog log_full_path -exportstats stats_full_path -exportstatreportlist stats_list -usercomments "any user comment" If a value contains spaces, enclose the value in quotation marks. To see the online help for this command, while you are in the directory containing the .bat file, type cmdline -help.
The following table explains each option:
Option Description -workspace Required. The complete path to the Eclipse workspace. -project Required. The path, including the file name, of the project relative to the workspace. -eclipsehome Required. The complete path to the directory containing eclipse.exe. -plugins Required. The complete path to the folder containing the plug-ins. Typically, on Windows operating systems this folder location is C:\\IBM\IBMIMShared\plugins. -schedule Optional, but you must specify the -schedule option, the -suite option, or the -servicename option. The path including the file name of the schedule to run relative to the project. -suite Optional, but you must specify the -schedule option, the -suite option, or the -servicename option. The path including the file name of the test to run relative to the project. -varfile Optional. The complete path to the XML file containing the variable name and value pairs. -servicename Optional, but you must specify the -schedule option, the -suite option, or the -servicename option. The name of the service to run. Instead of running a schedule or performance test, the specified service is run when it becomes available. -serviceargs Optional. The series of arguments to pass to the service specified by the -servicename option. For example, -serviceargs "-myserviceparm1 myserviceparm1value". The values are in quotation marks because they contain spaces. -configfile Optional. The complete path to a file containing the parameters for a schedule or test run. Each parameter must be on a single line. To create a configuration file, use an editor that does not wrap lines. Any parameters, whether required or optional, can be set in the configuration file. Command line parameters override the values in this file. Do not use quotation marks in this file, even for values that contain spaces.
-results Optional. The name of the results file. The default result file is the schedule or test name with a time stamp appended. -overwrite Optional. Determines whether a results file with the same name is overwritten. The default value, true, means that the results file is overwritten. -quiet Optional. Turns off any message output from the launcher and returns to the command shell when the run or the attempt is complete. -users Optional. Overrides the default number of vusers in the run. For a schedule, the default is the number of users specified in the schedule editor. For a test, the default is one user. This option creates a new copy of the schedule containing the specified number of users. -vmargs Optional. Java virtual machine arguments to pass in. For example, -vmargs "-debug -Xmx512m". The values are in quotation marks because they contain spaces. -exportlog Optional. The complete path to a file in which to store the exported HTTP test log. -exportstats Optional. The complete path to a directory in which to store exported statistical report data. The statistical report data is stored in comma-separated values (CSV) format, with the file name derived from the report name. If the -exportstatreportlist option is not specified, the reports specified on the Export Reports page of the Performance Test Report preferences are exported. -exportstatreportlist Optional. A comma-separated list of absolute paths to custom report format files (.view files) to use when exporting statistical report data with the -exportstats option. This parameter overrides workspace preferences. For example, -exportstatreportlist c:/customreport.view,c:/customreport2.view. -usercomments Optional. Add text within double quotation mark to display it in the User Comments row of the report. - Messages are displayed to indicate when the test or schedule is launched and when it is completed, unless you include the -quiet option.
- Issuing the command locks the workspace. To check the progress of the schedule or test during the run, invoke another workspace and open the project through that workspace.
Example
cmdline -workspace C:/RPTWorkspace -project testProj -eclipsehome C:\Program Files\IBM\SDP\eclipse.exe -schedule MySchedule -varfile C:/Assets/testProjVar.xml
Initializing variables from Rational Quality Manager
To run an IBM Rational Performance Tester test from IBM Rational Quality Manager, you can pass the execution variables defined in Rational Quality Manager to the RPT test.
- Configure the Rational Quality Manager adapter in RPT.
- Variable names must be the same in Rational Quality Manager and RPT.
- The Visible in value for the variable in the RPT test must be set to All tests for this user.
To initialize an execution variable value to a test, run the test from Rational Quality Manager. For information about execution variables, see Using execution variables in manual test.
Correlating response and request data
For a test to run correctly, a request that is sent to a server might need to use a value that was returned by a previous request. By ensuring that this data is correlated accurately, you can produce better performance tests.
Data correlation overview
A request can include data that was returned in the response to a previous request. Associating data in this manner is called data correlation.
Interactions with an application are typically related to each other. For example, consider the following interactions with a web-based application, in which each request depends on information returned from a previous response:
- A payroll clerk types the web address for an application, which sends a login prompt. When the clerk logs in, the web server returns a page that indicates that login has succeeded and a unique session ID to the web browser that the clerk is using.
- The clerk clicks a link on the returned page, which requests that the web server open the page for searching the employee database. The web browser includes the session ID when sending the request. Based on the session ID, the web server knows that the request comes from someone who is already logged on, and so opens the search form for the employee database. The clerk then searches for a specific employee. The web server returns a photograph of that employee and the employee's unique ID.
- The clerk clicks a link that requests the web server to return the payroll record for the employee. With this request, the web browser sends two IDs:
- The session ID, so that the web server knows that the request comes from some who is logged on
- The employee ID, so that the web server can locate and return the correct information
If you record these interactions in a test, before running the test with multiple users, you would vary the test data. For example, you would replace the user name and password values, the employee name search values, or both, with values that datapools contain. When you run the test, each virtual user returns a different employee payroll record, based on the contents of the datapools.
In a generated test, where data in a request depends on data that is contained in the response to a previous request, the request data is substituted from the response data on which it depends. The term for this internal linking of response and request data is data correlation. When you run a test with multiple users and varied data, data correlation is required to ensure that the test runs correctly.
A reference is a value in a test (typically in a response) that can be used by a subsequent value in the test (typically in a request). When the test generator detects that a request value must be substituted from a previous value, it designates the earlier value as a reference and correlates the subsequent request value with the reference. This process is called automated data correlation. You can also manually correlate any two values in a test or unlink existing correlations.
You can change or disable automated data correlation. To do so, click...
-
Window | Preferences, expand Test | Test Generation
To help you work with correlated data, the test editor uses color coding and provides navigational aids:
- When you click a page, you see a Test Data table for that page.
By default, related datapool candidates are shown in green text on a light green background, values that are already associated with a datapool are shown in white text on a green background, and references are shown in blue text.

- If correlated data is not displayed, right-click the table and verify that Show References is selected. To navigate directly to a page request containing correlated data, double-click a table row. To associate correlated data from this table with a datapool, click the row, click Substitute, and then click Select Data Source to open the Select Data Source window. You can also use the Test Data Sources view to make substitutions. In the test editor, right-click the Test Data table, and then select Link with Test Data Sources View. When you click a row in the Test Data table, the Test Data Sources view displays information about the selected substitution site.
- When you expand a page, green text indicates page requests that contain datapool data or candidates. Blue text indicates page requests that contain references.
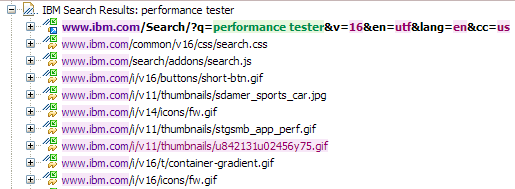
- When you click a highlighted request, datapool candidates are highlighted in light green, data that is associated with a datapool is highlighted in dark green, and correlated data is highlighted in red. If you right-click a value for correlated data, as shown in the example, you can then click Go To to see its reference:
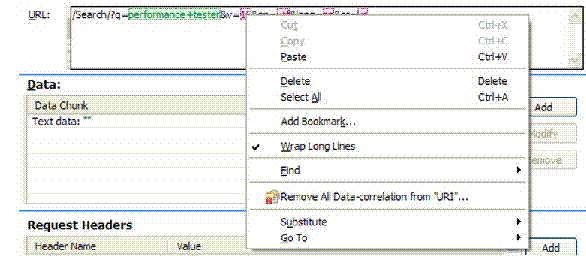
- References are highlighted in dark blue.
View data correlation
You can switch between viewing all test elements in the test editor and viewing only elements related to data correlation in the test editor. Viewing only data correlation elements makes it easier to add and remove substitutions.
- In the Test Navigator, browse to the test, and double-click it. The test opens.
- In the Test Contents area, click Options.
- Click Show | Data Correlation. The test editor window displays only elements that are related to data correlation. Alternately, click View under Test Contents to switch between Display all Test Contents and Show Substitutions.
- Select a single test element in the Test Contents area to see the current data source and to remove or change the substitution in the Test Element Details area. Select multiple elements in the Test Contents area to see the data in tabular form in the Test Element Details area. Different controls are available depending on the type and number of elements that you select in the Test Contents area.
- Optional: In the Test Elements Details area, click Substitute | Select Data Source to open the Select Data Source window, where you can specify the data source for the selected substitution site.
To view all test elements, click Options | Show | Data Correlation again.
If you select a test element while viewing all test contents, and then switch to viewing only data correlation elements, then the corresponding substituters and datapool candidates are selected. For example, if you select an HTTP page in the test editor, and then switch to viewing only data correlation elements, then all substituters and datapool candidates for all requests from the HTTP page are selected.
Data correlation rules overview
You can use the data correlation rules editor to customize how data is correlated. You can control how references and substitutions are generated in tests, and store these rules so that you do not have to manually correlate data in every test that you record against a particular application.
Create data correlation rule sets in the rules editor. Data correlation rule sets are also known as rules files. Each rule set can contain multiple rule passes, and each rule pass can contain multiple rules. When you re-correlate test data with data correlation rules, each rule set is applied in the order that you specify. Within each rule set, each rule pass is applied in order. Within each rule pass, each rule is applied in order.
You can use data correlation rules to do these tasks:
- Create a reference, substitution, variable, or datapool column
- Link a substitution to a reference
- Rename a reference or substitution
- Encode a substitution
- Unlink a substitution from a reference
- Remove a specific reference, substitution, or variable
- Remove all references or substitutions
Typically, you create a substitution and then link a reference to the substitution. References are located in the data that the server under test returns, while substitutions are in the data that is sent to the server.
Rule sets are hierarchical trees. You can insert child rules, which accept values generated by parent rules as input. To find a particular reference by name, first add a Find a reference rule, and then add a child Reference name rule. In the rules editor, you can also combine rules by using And and Or and Not rules.
Create data correlation rule sets
To use rules-based data correlation, you must create a data correlation rule set. Data correlation rule sets are also known as rules files.
- Click File | New | Data Correlation Rule Set. The New Data Correlation Rule Set wizard opens.
- Select a parent folder, and then in File name provide a name.
- Click Finish. The data correlation rules editor opens.
An empty rule set is created. Data correlation rule sets are XML files with the .dcrules file extension. Typically, you use the rules editor to edit data correlation rule sets. You can also use any XML editor to edit a data correlation rule set file.
Create a reference using data correlation rules
You can create a data correlation rule that creates a reference from a regular expression when the rule is applied to test data.
- Open a data correlation rule set in the rules editor. A new rule set contains one empty rule pass.
- Click Insert, and then select Create a reference. An empty Create a reference rule is inserted in the rule pass.
- Under Details, supply information for all fields that are marked with asterisks and shaded in red. For Reference field, click the down arrow to select the field in which to create the reference. Use the push buttons at the top of the window to select a protocol, and then select a field. For example, to create a reference in the content field of an HTTP response, click the down arrow, and then click HTTP | Content. To create references in multiple fields, click the Add field push button to add another Reference field.
- In Regular expression, type an expression to use to locate the reference. If only a part of the regular expression is required for a reference, enclose that part in parentheses.
- Open the test, and locate the response to create the reference in.
- Copy the text from the response to the clipboard.
- In the rules editor, click the Toggle regular expression assistant push button to open the regular expression assistant.
- Paste the text from the clipboard to the Test regular expression page of the regular expression assistant window. If the Test regular expression page is empty, the contents of the clipboard is automatically pasted in.
- Click the Captured group tab in the regular expression assistant. The overall group is displayed, and the captured groups are displayed. If no groups are displayed, edit the regular expression accordingly.
- In Reference names, provide names for the references. The names that you specify are available to child rules. To use the references as arguments in child rules, enclose the reference name in percent signs. For example, if you specify a reference name of name, you can use %name% as an argument in a child rule.
- Optional: If an attribute contains multiple matches for the regular expression, in Occurrence, type or select the occurrence to use to create the reference.
- Optional: Under Create reference only if used, select true to create a reference only if a substitution site uses the reference. Select false to create the reference regardless of whether a corresponding substitution site is found.
- Optional: Under Overlapping site action, select the action to take when a new reference overlaps with existing references.
Option Description Always remove existing If the new reference overlaps with other references, the other references are removed. Keep existing If the new reference overlaps with other references, the other references are not removed. Keep existing only if used If the new reference overlaps with other references, the other references are removed only if the references are unused. - Optional: Under Create reference even if overlapping, select true to create a reference even if the new reference overlaps with existing references.
- Optional: In Log level,
select the level of error data to be written to the error log. With logs, you can see which rules worked and which did not. When you are debugging data correlation rules, use the Action log level. If the Action log level does not provide enough data for troubleshooting, use the Detail log level. The Detail log level products a significantly
higher number of log entries. Typically, when you are sure that the data correlation rules that you have written work correctly, use the None or Summary log levels to reduce memory and disk-space consumption and unrequired
entries in the error log.
Option Description None Nothing is logged. Warning A message is logged when there are potential problems that are detected when the rule is applied. Summary One message is logged for the rule, no matter how many times the rule is applied. Important A message is logged every time the rule is applied in a manner that is not typical. This is the default log level. Action A message is logged every time the rule is applied. Detail A detailed message is logged every time the rule is applied. - Optional: In Label, type a label for the rule. If you do not type a label name, the rule is given a default name. The default name is the base name with the regular expression appended.
- Optional: In Description, describe the rule. Descriptions can be useful if you share rule set files with other testers.
Create a substitution with data correlation rules
You can create a data correlation rule that creates a substitution from a regular expression that is applied to test data.
- Open a data correlation rule set in the rules editor. A new rule set contains one empty rule pass.
- Click Insert, and then select Create a substitution. An empty Create a substitution rule is inserted in the rule pass.
- Under Details, supply information for all fields that are marked with asterisks and shaded in red. For Field, click the down arrow to select the field for which to create a substitution. Use the push buttons at the top of the window to select a protocol, and then select a field. To create a substitution in the data field of an HTTP request, click the down arrow, and then select HTTP | Data.
- In Regular expression, type a regular
expression to use to locate the substitution. If only a part of the regular expression is required for a substitution, enclose that part
in parentheses.
- Open the test, and locate the request to create the substitution in.
- Copy the text from the request to the clipboard.
- In the rules editor, click the Toggle regular expression assistant push button to open the regular expression assistant.
- Paste the text from the clipboard to the Test regular expression page of the regular expression assistant window. If the Test regular expression page is empty, the contents of the clipboard is automatically pasted in.
- Click the Captured group tab in the regular expression assistant. The overall group is displayed, and the captured groups are displayed. If no groups are displayed, edit the regular expression accordingly.
- In Substitution names, type names for the substitutions.
- Under Decode the field, select true to decode the specified attribute before searching for a matching reference. Select false to search for a matching reference without decoding the attribute. The type of encoding depends on the selected protocol and attribute. For example, HTTP data can be URL-encoded.
- Optional: Under Create substitution only if used, select true to create a substitution only when a matching data source is found. Select false to create the substitution regardless of whether a matching data source is found.
- Optional: Under Conflict action,
select the action to take when a new substitution overlaps with existing substitutions.
Option Description Always replace existing If the new substitution overlaps with other substitutions, the other substitutions are removed. Replace existing if datapool candidate If the new substitution overlaps with other substitutions, and all the other substitutions are datapool candidates, other substitutions are removed. If at least one current substitution site that overlaps with the new substitution site is associated with a reference, then no current substitution is changed, and the new substitution is not created. Replace existing if enclosed in the new site If the new substitution overlaps with other substitutions that are all completely enclosed in the new substitution, other substitutions are removed. If at least one current substitution overlaps with the new substitution without being completely enclosed by the new substitution, then no current substitution is changed, and the new substitution is not created. Replace existing if datapool candidate or enclosed If the new substitution overlaps with other substitutions, and each of the other substitutions is either a datapool candidate or is completely enclosed in the new substitutions, other substitutions are removed. If at least one current substitution overlaps with the new substitution without being completely enclosed by the new substitution, or if at least one current substitution site that overlaps with the new substitution site is actually associated with a reference, then no current substitution is changed, and the new substitution is not created. Keep existing If the new substitution overlaps with other substitutions, the other substitutions are not removed. The new substitution is not created. - Optional: In Log level,
select the level of error data to be written to the error log. With logs, you can see which rules worked and which did not. When you are debugging data correlation rules, use the Action log level. If the Action log level does not provide enough data for troubleshooting, use the Detail log level. The Detail log level produces a significantly
higher number of log entries. Typically, when you are sure that the data correlation rules that you have written work correctly, use the None or Summary log levels to reduce memory and disk-space consumption and unrequired
entries in the error log.
Option Description None Nothing is logged. Warning A message is logged when potential problems are detected when the rule is applied. Summary One message is logged for the rule, no matter how many times the rule is applied. Important A message is logged every time that the rule is applied in a manner that is not typical. This is the default log level. Action A message is logged every time the rule is applied. Detail A detailed message is logged every time the rule is applied. - Optional: In Label, type a label for the rule. If you do not type a label name, the rule is given a default name. The default name is the base name with the regular expression appended.
- Optional: In Description, describe the rule. Descriptions can be useful if you share rule set files with other testers.
Assigning sequential numbers to users
This topic is applicable for IBM Rational Performance Tester version 8.5.1. To assign unique sequential numbers to all the vusers in a test, you can create a sequential number data source in the workbench. This data source will generate unique integers or floating point numbers for the users.
You can use the sequential built-in data source option wherever data correlation substitutions are permitted, such as Transactions or Delays. You define an initial value that should be assigned to the first virtual user and a step value that is a number by which the current value increments after each retrieval by a virtual user. If initial value is 1 and step value is 5, the workbench generates numbers in the sequence of 1, 5, 10, 15, and so on for each virtual user. If a test is run on multiple agent machines, the workbench assigns a sequential value to all the users in all the agent machines.
- In the Test Contents area of the test, click an element in the test where data correlation substitution is permitted, such as a transaction name or delays.
- In the Test Element Details area, right-click the name of the element and click Substitue | Built-in Datasources.
- In Built-in Datasource Selection Wizard, click Sequential Number and click Next.
- Assign a name for the data source.
- In Initial Value, type a number to be assigned to the first virtual user.
- In Step Value, type a number.
- In Formatting Options, you can format the number in the manner you want to use.
- Click Finish.
- Save and run the test.
After you add the test to a schedule and run the schedule, the test log displays each element name where the data source is applied with the unique sequential number assigned to the virtual user.
Example: Linking references to substitutions with rules
You can create data correlation rules to link references to substitutions. If you know which field in a request or in POST data must be correlated, write a Create a substitution rule for that field, and then insert a Create a reference rule as a child of the Create a substitution rule.
- Open a data correlation rule set in the rules editor. A new rule set contains one empty rule pass.
- Create a Create a substitution rule.
- Right-click the Create a substitution rule, and then click Insert Item | Find data source for substitution.
- Right-click the Find data source for substitution rule, and then click Insert Item | Create a reference. If the reference exists, select Find a reference instead of Create a reference. A Create a reference or Find a reference rule is inserted as a child of the Find data source for substitution rule. To use the value of the substitution extracted by the parent rule, type %subname% for the Regular expression, where subname is the name of the substitution that is created by the parent rule.
When you recorrelate test data using this rule set, the references and substitutions that you defined are created and linked.
Example
Assume that a URI in your test is...-
http://host:port/RPThelp/index.jsp?topic=datacorrelation.html
Assume that some of the response data from a previous request includes ...<id=2 docHelpName=recordtest> <id=23 docHelpName=datacorrelation> <id=24 docHelpName=rules>.... Write a rule that creates a substitution site in the URI for datacorrelation and sets the substitution name to helpname. Then, add rules that create a reference as a child of the substitution rule. The regular expression for the reference rule is docHelpName=%helpname%>. Thus, the regular expression in the reference rule evaluates to docHelpName=datacorrelation>. This regular expression ensures that the correct reference is linked to the substitution site.
Example: Linking substitutions to references with rules
You can create data correlation rules to link substitutions to references.
If you are familiar with the application under test and know the exact location of the reference in the response data, write a Create a reference rule that uses a regular expression to locate the reference data, and then insert a Create a substitution rule as a child of the Create a reference rule.
- Open a data correlation rule set in the rules editor. A new rule set contains one empty rule pass.
- Create a Create a reference rule.
- Right-click the Create a reference rule, and then click Insert Item | Link with substitutions.
- Right-click the Link with substitutions rule, and then click Insert Item | Create a substitution. To use the value of the reference that is extracted by the parent rule, type %refname% for the Regular expression, where refname is the name of the reference that is created by the parent rule. A Create a substitution rule is inserted as a child of the Link with substitutions rule.
When you recorrelate test data with this rule set, the references and substitutions that you defined are created and linked.
Example
Assume that a response in your test data contains an ID that is present in URIs and in POST data throughout the test. For example, the response includes ...<NeededID=ID123 docHelpName=rules>.... Assume that a URI in the test is...-
http://host:port/RPTHelpID123/index.jsp?topic=datacorrelation.html
...and the POST data includes...
-
nameID123=ID123
Because you know the exact location of the ID in the response, you can write a rule that creates a reference for the ID. Specify the Reference name as ID. Then, add rules for two substitutions as children of the reference rule. Add one substitution with a URI attribute and one with a data attribute. Specify %id% in Regular expression for both substitution rules. Thus, the regular expression in the substitution rule becomes the ID123 value when the rules run. This regular expression creates substitution sites in every location where the ID123 value is found in URIs and in POST data. In this example, three substitution sites would be created: RPThelpID123, nameID123, and nameID123=ID123.
Example: Linking substitutions to built-in data sources with rules
You can create data correlation rules to link substitutions to built-in data sources. Built-in data sources include the dynamically calculated variables such as Current Date, Random Number, and Timestamp.
- Open a data correlation rule set in the rules editor. A new rule set contains one empty rule pass.
- Create a Create a built in data source rule.
- Right-click the Create a built in data source rule, and then click Insert Item | Link with substitutions.
- Right-click the Link with substitutions rule, and then click Insert Item | Create a substitution. A Create a substitution rule is inserted as a child of the Link with substitutions rule.
When you recorrelate test data with this rule set, the built-in data sources and substitutions that you defined are created and linked.
Recorrelating data with rules
After you have created a data correlation rule set, you can recorrelate data in tests.
Record a test, and create a data correlation rule set.
- Open a test for editing. To recorrelate data in tests that are not open in the editor, select multiple tests in the Test Navigator window.
- To recorrelate a test that is open in the test editor, click Edit | Re-correlate test and transform data. To recorrelate multiple tests, right-click the selected tests in the Test Navigator window, and then select Apply data correlation rules. The Data Correlation and Transformation window opens.
- Select Do rule-based data correlation.
- Optional: To remove data correlation from the test data, select Clear existing data correlation. Select Do automatic data correlation to recorrelate the test data by using the automatic data correlation. You can control automatic data correlation in the preferences.
Click...
-
Window | Preferences | Test | Test Generation | HTTP Test Generation | Data Correlation tab
- Click Add. The Rules File Selection window opens.
- Expand the list of resources to locate the data correlation rules file to add.
- Select the data correlation rules file to add, and then click OK. Data correlation rules files have the .dcrules extension by default. The rules file is added to the list under Rules Files.
- Optional: Click Add to add more rules files. Use the Up and Down push buttons to move rules files in the list. The data correlation rules are applied in the order in which the files are listed.
- Click Finish. The test data is recorrelated.
If you recorrelate test data in multiple tests that are not open in the test editor, the original tests are backed up. The backup copies are displayed in the list in the Test Navigator window. To restore the original version of the test, right-click the backup copy in the Test Navigator window, and then select Restore test.
Record tests with data correlation rules
After you have created a data correlation rule set, you can record a test that uses those rules.
Create a data correlation rule set.
- In the Performance Test perspective,
click the New Test From Recording toolbar button or click...
-
File | New | Test From Recording
- In the New Test From Recording wizard, click Create a test from a new recording, select the type of test to create, and click Next.
- On the Select Location page, select the project and folder to create the test in, type a name for the test, select Customize automatic data correlation, and click Next.
- Continue recording a test. After you have recorded the test, the Data Correlation window opens.
- Select Do rule-based data correlation.
- Optional: Select Do automatic data correlation to correlate the test data using the automatic
data correlation. You can control automatic data correlation in the preferences. Click...
-
Window | Preferences | Test | Test Generation. Click HTTP Test Generation
... and then click the Data Correlation tab for additional controls over automatic HTTP data correlation. For example, when recording an HTTP test with data correlation rules, you might select...
- Automatically correlate host and port data
- Automatically correlate URL pathname if redirected by response
- Automatically correlate Referers
...and then clear...
-
Enable all other data correlation
- Click Add. The Rules File Selection window opens.
- Expand the list of resources to locate the data correlation rules file to add.
- Select the data correlation rules file to add, and then click OK. Data correlation rules files have the .dcrules extension by default. The rules file is added to the list under Rules Files.
- Optional: Click Add to add more rules files. Use the Up and Down push buttons to move rules files in the list. The data correlation rules are applied in the order in which the files are listed.
- Click Finish. The recorded test data is correlated.
Generate data correlation rules in the test editor
Instead of writing rules in the rules editor, you can generate rules automatically based on data correlation adjustments that you make while editing tests.
To see what data correlation looks like in rule form, generate rules while you edit tests, and then examine the rules in the rules editor. To generate a rule set file that you can use to correlate data on multiple tests that run against the same application, save all manual correlations in a rule set file.
Generating rules while you edit
You can generate rules automatically as you make changes to data correlation in the test editor. With this feature, you can see what a typical data correlation action looks like in rule form.
Record a test.
- Rules accumulation is enabled by default. To enable rules accumulation, right-click in the Test Contents window, and then select Data Correlation | Allow rules accumulation.
- Adjust data correlation as you typically would in the test editor. For example, create or delete references, substitution sites, datapools, or variables.
- Right-click in the Test Contents window, and then select Data Correlation | Show accumulated rules. The Save Data Correlation Rule Set wizard opens. The data correlation rules that are generated while you manually edited the test are displayed.
- Clear the check boxes of any rules that you do not want to save, and then click Next.
- Type a file name, and then click Save.
Examine the data correlation rules in the rules editor.
Saving manual data correlation in a rule set file
You can generate data correlation rules based on the data correlation changes made to a performance test. This feature analyzes the data correlation adjustments that you have made to a test and saves those adjustments as a data correlation rule set file. You can use the rule set file to automatically correlate the data for other tests that run against the same application.
Create a performance test. Adjust the data correlation so that the test runs correctly.
- Open a performance test for editing.
- Adjust data correlation as you typically would in the test editor. For example, create or delete references, substitution sites, datapools, or variables.
- Right-click in the Test Contents window, and then select Data Correlation | Save All Manual Correlation in Ruleset file. The test is analyzed to determine the set of data correlation rules that represents the adjustments that you have made to data correlation. The Save Data Correlation Rule Set wizard opens. The data correlation rules are displayed.
- Clear the check boxes of any rules that you do not want to save, and then click Next. Typically, when saving manual data correlation, you save all the generated rules, because the generated rules represent the data correlation required for the test to run correctly.
- Type a file name, and then click Save.
You can use the generated rules file to perform data correlation on other tests that run against the same application.
> View data correlation rule usage
To see a record of all the elements that changed when data correlation rules are applied, open the data correlation rules log. You can use the data correlation rules log to determine which rules worked and which did not. The Data Correlation Rules Log view opens automatically when you apply data correlation rules to a test.
- In the Data Correlation Rules Log view,
consider the following options:
- You can apply data correlation rules when you record a test, or you can recorrelate existing test data.
- You can specify the logging level in the data correlation rules file, or on the Data Correlation and Transformation wizard page.
- You can use the Action log level to debug data correlation rules. If the Action log level does not provide enough data for troubleshooting, use the Detail log level.
- You can view the data correlation actions in the chronological
order. Click the Chronological log view icon
 to view test elements that are created or removed by the data correlation rules.
- When you are sure that the data correlation rules that you wrote work correctly, use the None or Summary log levels to reduce memory, disk-space consumption, and unnecessary entries in the error log.
- Expand the first element of the log, and navigate to the detail to see. Use the icons in the upper-right corner of the view to navigate through the log. For example, to navigate to the corresponding element in the test editor, select a log entry, and then click Go to test element.
Test data sources overview
Use the Test Data Sources window to add or change data correlation for any supported test element.
The test generator attempts to perform automated data correlation. You can also manually correlate request values with other test data. The Test Data Sources window displays the following types of test data that you can substitute from:
- References
- Datapools
- Custom code
- Test variables
- Built-in variables
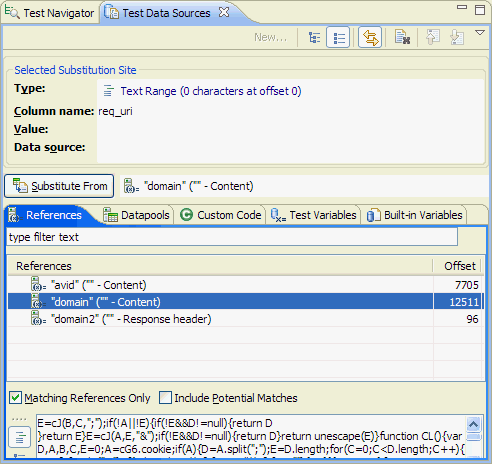
- References
- The data sources that have been created in the test and the potential matches that are available for a selected substitution site. For example, text that is found in a response and used in a subsequent request is automatically created as a reference. Clear the Matching References Only check box to see all the references that occur before the substitution site in the test. Select Include Potential Matches to see a list of locations that might match the substitution site. Replace the type filter text string with keywords to filter the list of references. Select a reference in the References table to display the reference in the pane at the bottom of the window. Use the controls to the left of the preview pane to switch between inline view and tree view.
- Datapools
- The datapools that have been added to the test. To add a new datapool, click the Add new Datapool icon (
 ).
). - Custom Code
- The custom code that is available as data sources for this substitution site, if you have written Test Execution Services (TES) custom code.
- Test Variables
- The test variables and their types that are available as data sources for this substitution site. Replace the type filter text string with keywords to filter the list of test variables.
- Built-in Variables
- The dynamically calculated variables, such as Current Date, Random Number, and Timestamp, that are available as data sources for this substitution site. To create a built-in variable, right-click inside the Built-in Variables page, and select New, or click the New push button at the top of the window.
Detaching the Test Data Sources window
The Test Data Sources window is detachable. To detach the Test Data Sources window, right-click the Test Data Sources tab, and then select Detached. When detached, the Test Data Sources window is always displayed in front of the other windows that make up the workbench.
Correlating a request value with test data
If a test runs without error but does not generate the results that you expect, you might need to correlate a value in a request with other test data. You can correlate a request value with the following types of test data:
- References
- Datapools
- Custom code
- Test variables, and
- Built-in variables
- In the Test Navigator, browse to the test, and double-click it. The test opens in the test editor.
- Locate the value that the other test data will replace.
- Highlight the value: Press and hold the left mouse button and drag your mouse over the value.
- In the Test Data Sources window, click the appropriate tab: References, Datapools, Custom Code, Test Variables, or Built-in Variables. To see all references, clear the Matching Only check box.
- In the Test Data Sources window, select the test data to use. For references and custom code, you can double-click the entry in the Test Data Sources window to find the data source in the test editor.
- Click Substitute From. The value is shown in purple text to indicate that it has been correlated and the correlation is added to the Test Data table, which contains the substitution sites for the page.
Substituting request content with file contents
You can substitute the content portion of a protocol request with the contents of a file. This feature is only supported in certain sections of a test, depending on the protocol. For example, HTTP tests support file content substitution only in the POST data section of a request. SOA tests support file content substitution for MIME and DIME attachments, XML node values and fragments, and text content. File content substitution works in the same manner as other substitutions. All standard test data sources such as test variables, datapools, and references can be used. The data from the source is treated as a full path to a file. The file is opened, its contents are read, and then those contents are used in the substitution.
You must copy the files that contain the substitution content to the agent computers. You must record a test with locations for substitution from a file. For example, record an HTTP test containing multipart MIME data in a POST request.
- Create a data source containing the full path to the file from which you want to substitute content. Specify an absolute path to the file. Use path separator characters appropriate to the operating system of the agent computer running the test. Optionally, specify a character set to use in reading the file. The existence of the file is not validated. If the file cannot be opened when the test runs, a message is written to the test log. If you use path separator characters that are not appropriate for the operating system of the agent computer, the substitution cannot be completed. For example, if you use a path of D:\DataFiles\file1 on an agent computer running Linux, the substitution cannot be completed, because Linux uses forward slashes as path separator characters.
- In the test editor, navigate to the request where you want to substitute content, and then select the request data to substitute.
- Right-click, and then select Substitute | Select Data Source.
- Select the data source containing the path to the file from which you want to substitute.
- Right-click the substitution site, and then select File Contents Substituter.
When the test runs, the content in the protocol request is substituted with the specified file contents.
HTTP POST data is displayed in the test editor in chunks. You can create a file contents substitution in the POST data of an HTTP POST request by selecting the data chunk to correlate, and then clicking Substitute. The test data source that you select is automatically treated as a file contents substituter. The entire data chunk is replaced with the contents of the file when the test runs, even if only a portion of the text in a text data chunk is selected by the substituter.
View references
You can use the Test References window to view, modify, or verify references in a test.
- In the Test Navigator, browse to the test, and double-click the test name. The test opens.
- Optional: To view references in only part of a test, select test elements in Test Contents before continuing.
- In the Test Contents area, click Options.
- Select Display References. The Test References window opens. All references in the test or the selected test elements are displayed in tabular format.
- Do one of these tasks:
Option Description To view details about the references in a test Navigate through the References table to preview the references in the Preview area. Click the Next and Previous icons to move the selection down or up in the list of references. Click the Show as Tree icon to toggle between tree format and list format. Click the Show Usage icon to view the substitution sites that are associated with each reference. Click the Bookmark icon to bookmark a location for later review. To verify regular expressions that are associated with references Select the check box next to each reference to verify, and then click Verify Checked. The verification procedure completes this procedure: - Checks that the regular expression finds the correct content. Regular expressions can stop working if you modify a test.
- Checks that there are no references with duplicate names. Troubleshooting data correlation problems is easier if references have unique names.
- Checks that there are no overlapping correlations.
To find more locations in the test that have the same value as the selected reference Select a reference, and then click Find and Substitute. These locations can be reviewed and substituted interactively as needed. To modify a reference Select a reference, and then click Properties. To use the regular expression assistant to edit the regular expression used to locate a reference - Select a reference, and then click Properties.
- Click the Toggle regular expression assistant push button on the Properties window. The regular expression assistant opens. The response data that is matched by the current reference is automatically copied into the Test regular expression window.
- Click the Captured group tab in the regular expression assistant. The regular expression assistant displays the response content that is matched by the regular expression and the groups that are captured by the regular expression. If no groups are displayed, edit the regular expression accordingly.
To remove a reference Select a reference, and then click the Clear Reference icon. The reference is removed from the test when you close the Test References window. - Click Close to close the Test References window and return to the test in the test editor. When you close or save a test, you are prompted if any changes that you made to the test might affect the integrity of references in the test.
Create a reference or field reference
When you designate a test value as a reference or designate a set of test data as a field reference, you can use the data elsewhere in the test.
A reference, which is typically located in response data, points to a specific value to use in a subsequent test location, typically a request. You can substitute a request value with a reference. This substitution is called data correlation. You can also use a reference as input to an IF-THEN condition in a test or as input to custom Java. code that your test calls.
A field reference points to an entire block of test data. For example, an entire HTTP response can be designated as a field reference. You can use a field reference as input to custom Java code that your test calls.
- In the Test Navigator, browse to the test, and double-click it. The test opens.
- Locate the value or set of data to designate as a reference or field reference.
Different protocols support different references. For HTTP tests, you can create references and field references in these fields:
- A response header value, the Value column of a Response Headers table
- Response content, the Content field
- The Status field
- The Reason field
- Create the reference:
- For response contents, highlight the value. For response header contents, click the row in the Response Headers table, and then click Modify.
- Right-click, and then click Create Reference. The value is highlighted in light blue to indicate that it is an unused reference. When you use it, the highlight changes to dark blue. The reference is given a name automatically. To see the name of the reference, right-click the value, and then select Properties. To edit the regular expression that is used to locate the reference, click the Toggle regular expression assistant push button on the Properties window. The regular expression assistant displays the response content matched by the regular expression and the groups captured by the regular expression.
- To create a field reference, do not highlight the value.
Instead, right-click the value, and then click Create Field
Reference.
- Field references are not automatically given names. To name a field reference, right-click the field reference, and then select Properties. Type a name in the Name field, and then click OK.
Select a reference in a response
When a response contains multiple matches for the regular expression that defines a reference, you can select which match is used subsequently as the data source. You can specify a particular occurrence, or you can specify a random occurrence.
An application under test might return responses that contain multiple matches for a regular expression that defines a reference. For example, a response might contain multiple links to rows of data, where each row represents a different user. You can control which occurrence of the regular expression is used as the data source in subsequent data correlation.
If you edit the Regular Expression that is associated with a reference, and then click Verify or OK, and the new regular expression still connects to the highlighted string in the preview window, then the Specific occurrence number is updated automatically, overwriting any changes.
- In the Test Navigator, browse to the test, and double-click it. The test opens.
- Locate the response containing the reference to specify.
- In the Content field under Test Element Details, right-click the reference, and then select Properties.
- Optional: To edit the regular expression that is used to locate the reference, click the Toggle regular expression assistant push button on the Properties window. The regular expression assistant displays the response content that is matched by the regular expression and the groups that are captured by the regular expression.
- On the Properties page for the reference,
select which Occurrence to use as the data source. By default, the first occurrence of a match for the Regular Expression is used as the data source.
- To specify a particular occurrence, select Specific occurrence number, and then type the number of the match. For example, type 4 to specify the fourth match of the regular expression in the response.
- To specify a random occurrence, select Random occurrence.
- To specify the last occurrence, select Last occurrence.
- Click OK. The occurrence that you specified is used as the data source for data correlation when you run the test.
Correlating multiple fields in a test
Some tests are structured in such a way that you must correlate data for multiple fields. For example, assume that you plan to datapool an item that a virtual user is buying. For the test flow to be correct, you must also datapool all occurrences of that item in the test. You can find and correlate all instances of that item in one procedure. Typically, you use Find More and Substitute in the Show Datapool Candidates window to correlate data for multiple fields. Alternatively, you can use the Test Search page to correlate data for multiple fields.
To find all instances of a field in a test and correlate some or all of the instances with a data source, such as a datapool:
- In the Test Navigator, browse to the test, and double-click the test. The test opens.
- Locate the item or the substitution site to change or create a reference for. If the item is plain text, select the item. If the item is an existing reference, click the highlighted area.
- Right-click, and then click Find | More Substitution Sites.
- Click OK.
- On the Test Search page, select Case sensitive to perform a case-sensitive search or Regular expression to perform a search using regular expressions. In regular expression mode, press Ctrl+spacebar key in Search for text for content assistance. Content assistance lists the regular expression patterns and the content that they match.
- Click More Options, and then select the appropriate options:
- Restrict to elements highlighted in Test Contents
- Search only in elements that are selected in the Test Contents area.
- Highlight found elements in Test Contents
- Highlight found elements in the Test Contents area.
- Recursive
- Searches the child test elements in addition to the element. For example, if you search an HTTP page, select this option to search the requests and responses within the page.
- Match encoded and decoded values (protocol-specific)
- When selected, searches for matches of the unencoded and URL-encoded versions of the specified text. For example, when searching in HTTP data, abc%123 and abc%25123 match.
- Include matches with overlapping data correlation
- Include sites that are contained in, or overlap with, an existing substitution site. If you decide to substitute, the conflicting substitutions are automatically removed.
- Include matching substituters
- Click to return elements that originally matched the search string but have since been substituted. Clear to skip existing substitution sites when results are returned.
- Click Close.
- Click Search. The search results are displayed in the Search view.
- In the Search view, select the matches to substitute, and then right-click the selection.
- Optional: To select all matches, right-click the test name.
- Click Substitute in DataSource View. This action sends the selected matches to the Test Data Sources window.
- In the Test Data Sources window, click the tab that corresponds to the type of data source to use:
Option Description References The data sources that have already been created in the test and the possible matches that are available as data sources for the selected substitution site. For example, text that is found in a response and used in a subsequent request is automatically created as a reference. Clear the Matching References Only check box to see all the references that occur before the substitution site in the test. Datapools The datapools that have been added to the test. To add a new datapool, click the Add new Datapool icon ( ).
Custom Code If you have written test execution services (TES) custom code, the custom code that is available as data sources for this substitution site. Test Variables The test variables and their types that are available as data sources for this substitution site. Built-in Variables The dynamically calculated variables (Current Date, Random Number, and Timestamp) that are available as data sources for this substitution site. To create a new built-in variable, right-click inside the Built-in Variables page, and select New. - Select the data source, and click Substitute From. The Substitute Multiple Items window is displayed, showing information about the data source and substitutions sites that you selected.
- For each site with a selected check box, click Substitute Checked to substitute the data source or clear the check box to skip the site. Click Always Prompt to examine every substitution site one at a time. Click Prompt on overlapping data correlations to examine a site only if the site you are substituting into is contained in, or overlaps with, an another substitution site. If you decide to substitute, the conflicting substitutions are automatically removed.
The selected instances of the field are correlated with the data from the data source.
Guidelines for adjusting data correlation
When you run a test, you might notice that the server is not under the expected load or that your database is not being updated as expected. Incomplete or incorrect data correlation can cause these problems.
To identify data correlation problems:
- Use the Potential Correlation Errors view to find missing or incorrect data correlations.
- Run a test individually or in a schedule with the Log Level for errors, failures, and warnings set to All.
- After the run, open the test log
The data correlation algorithms that are used during test generation are based on well known best practices. However, because these practices continually evolve, various types of errors can occur during automated data correlation:
- Insufficient correlation: Test values that must be correlated are not. Some possible causes follow:
- Two parameters that must be correlated have different names.
- A value must be correlated with a previous value that does not occur in the expected location.
- A parameter or value must be correlated with a previous parameter or value that does not occur in the test because it is a computed value.
- Superfluous correlation: Unrelated test values are correlated.
- Incorrect correlation: Test values that must be correlated are correlated incorrectly.
Insufficient correlation: Parameters have different names or occur in unexpected locations
When two parameters that must be correlated have different names, automated data correlation does not recognize that the two parameters are related. For example, consider this request:
-
http://www.example.com?id=12345
Suppose that this request must be correlated with the server response containing customer_ID=12345, not ID=12345. In this case, the ID parameter must be correlated with customer_ID.
Data correlation typically links a response value that was returned from the server with a subsequent request value. The automated correlation algorithms search in the URL and the POST data for potential matches; however, other schemes for returning parameters are possible. For example, consider this request: http://www.example.com?id=12345. Suppose that this request must be correlated with the server response containing the name and entity pair href name="customer_ID" entity="12345", not ID=12345. In this case, the ID parameter must be correlated with name="customer_ID" and value 12345 must be correlated with entity="12345".
Here are some additional causes of insufficient correlation:
- Siebel uses the star array format. Standard correlation algorithms can neither retrieve from this format nor substitute into this format.
- SOAP designates correlation parameters in external XML files. The correlation algorithms cannot correlate parameters in the external file with parameters in the test.
To manually correlate data in these cases:
- In the test editor, use search or browse to locate the two parameters for correlation.
- Navigate to the parameter that occurs later in the test, and select the parameter. This is the substitution site.
- In the Test Data Sources window, click the References tab.
- Select the data source to use as a reference, and then click Substitute From.
Insufficient correlation: One parameter is unnamed
Sometimes a parameter or value must be correlated with a previous parameter or value that is not named in the test, because it is computed, for example, by a JavaScript program. In this case, in order to correctly correlate the data, you must understand how and where the parameter or value is computed, and then use a custom code block.
For example, consider the web address...
-
http://www.example.com?login_stamp=12345_Apr_11_07
...where the value for login_timestamp is the concatenation of the login ID and the current date. In this case, you must generate a custom code that concatenates the login ID and the date.
For another example, suppose that the server returned the login ID and date as separate entities: href "customer_id=12345" Date="Apr_11_07". In this case, you can put these parameters in separate references and, in subsequent requests that use customer ID and date, substitute them separately.
Superfluous correlation
Automated data correlation is based on pattern matching: A parameter or parameter value is correlated with a subsequent parameter or parameter value with an exact or similar name. But sometimes parameters with exact or similar names are in fact unrelated. In the best case, unneeded correlation is either harmless or adds a slight load that is inappropriate. In the worst case, the application does not expect a correlation and fails during playback.
To remove a superfluous data correlation:
- In the test editor, search or browse to locate the substitution site that must not be correlated. By default, purple letters indicate correlated data.
- Right-click the substitution site.
- Click Remove Substitution.
Incorrect correlation
A parameter that requires data correlation might occur many times throughout a test. For example, a session ID parameter that is used initially when a user logs in might also be used in every subsequent request. If multiple instances of a parameter in a test are not same, the correlation algorithms might use the wrong instance.
With the HTTP Test Generation preferences, you can optimize automatic data correlation for accuracy or for efficiency.
- Accuracy: Each occurrence of a parameter is correlated with the nearest previous occurrence. This is the default setting.
- Efficiency: Each occurrence of a parameter is correlated with a single previous occurrence.
If you do not manually apply a correlation in the Referer field in an HTTP request header, then the Referer field is automatically correlated as needed. If you manually apply a correlation in the Referer field in an HTTP request header, then no automatic correlation is performed.
Incorrect correlations are more likely to happen when Optimize automatic data correlation for execution is set to Efficiency. To fix an incorrect correlation:
- In the test editor, search or browse to locate the value that is incorrectly correlated.
- Right-click the substitution site.
- Click Remove Substitution.
- Right-click the substitution site again.
- Click Substitute, and select the correct parameter.
Find data correlation errors
You can use the Potential Correlation Errors view to find missing or incorrect data correlations.
Run a test or a single-user schedule. The Potential Correlation Errors view does not support multiple-user schedules. If verification points fail while you are running a test, you are prompted to open the Potential Correlation Errors view when the test run is complete.
To find data correlation errors:
- In the Test Navigator, select the result of the test run where you want to find correlation errors.
- Right-click the result, and then select Find Data Correlation Errors. You can choose Missing Correlation, Incorrect Correlation, or All.
- The Potential Correlation Errors view opens. After the test log is processed, the view is populated. Depending on the size of the test log, it can take significant time to populate the view. The potential missing or incorrect data correlations are displayed, in descending order of the likelihood that the correlation is incorrect. Selecting an item in the Potential Correlation Errors view automatically selects the corresponding element in the test editor, so that you can fix the potential error.
- Use the Compare with Test Log toolbar button in the upper-right corner of the view to compare the request or response in the test with the same object in the test log.
- For missing correlations, use the Suggest Fix toolbar button in the upper-right corner of the view to search for other instances of the value in all responses in the test. If a matching value occurs in an earlier response in the test, create a reference in that response.
Disable data correlation
You can disable a data correlation source or a substitution site. When you disable a data source, none of the substitution sites that use the source will be correlated when you run tests. When you disable a substitution site, only that specific substitution site is disabled. Other substitution sites that use the same reference will be correlated when you run tests. You can also disable data correlation entirely for subsequent tests that you record.
To disable a data correlation source or substitution site:
- In the Test Navigator, browse to the test and double-click it. The test displays in the test editor.
- In the Test Contents area, click a request.
- In the Test Element Details area, locate the data correlation source or substitution site.
- Right-click the data value and select Disable from the menu. To re-enable a disabled data source or substitution site, right-click the data value and select Enable from the menu.
The data correlation source or substitution site is disabled.
To disable data correlation for the entire workspace, click...
-
Window | Preferences | Test Generation
... and clear Enable automatic data correlation. Subsequent tests that you record or regenerate will not include data correlation.
Recorrelating test data
If you disabled automatic data correlation before recording a test, you can regenerate the test with automatic data correlation enabled.
- Click...
-
Window | Preferences | Test | Test Generation
- Click the Data Correlation tab.
- Select the types of data correlation to enable, and then click OK.
- In the Test Navigator, browse to the test and double-click it. The test displays in the test editor.
- Click Edit | Re-correlate test data.
The test is regenerated with the types of automatic data correlation that you selected.
Data transformation
You can transform HTTP application specific data such as binary data and encoded data to a more readable format to use data correlation.
View binary data
You can view binary data in tests. Use the binary editor to inspect test data, to determine if the binary data is of interest or should be transformed so that it can be correlated. You can also edit binary data in tests. To edit binary data you need to have in-depth knowledge of the data format in question. Typically, you do not edit binary data in tests.
Record a test containing binary data.
- In the Test Navigator, browse to the test, and double-click it. The test opens.
- Select a test element containing binary data.
- In the Test Element Details area, press the Ctrl key and click in the Content field. Alternately, type Ctrl+Shift+Space. The Test Editor - Content window opens.
- Select the bytes to inspect, and then right-click to manipulate
the selected data.
Option Description Select Use this page to programmatically select binary data by string or by specifying the number of characters to select. Click Null terminated string from caret to make a selection that starts at the current cursor position and ends at the next null character. If you select Select NULL character also, the null character is included in the selection.
Click characters from caret, and type a number to select that number of characters starting from the current cursor position.
Click Selection contains number of characters to select to select the number of characters specified by the current selection in the binary editor. For example, if you have 08 selected in the binary editor, this will select the next eight characters after the 08 byte. This control is not available if no data is selected in the binary editor.
Click Sign to choose signed or unsigned data.
Click Endianness to choose between big endian or little endian representation.
Edit Integer value Use this page to edit data that you have selected in the binary editor. This page is available only when the binary editor is not in read-only mode. Select Update contents from editor selection to update the Value field when you change the selection in the Test Editor window. Clear this check box to prevent the Value field from being updated when you change the selection in the Test Editor window.
Type the new data in the Value field. Select the appropriate base, such as decimal or hexadecimal, from the list.
Click negate to negate the value of the selected data.
Click Size to choose the size, in bytes, of the selected data.
Click Sign to choose signed or unsigned data.
Click Endianness to choose between big endian or little endian representation.
The Preview area shows how the bytes will change in the binary editor after you click Apply or OK.
Show Integer value Use this page to show the integer value of selected binary data in different formats. This page is available only when the binary editor is in read-only mode. Select the appropriate base, such as decimal or hexadecimal, from the list. The input field is not available.
Click Size to choose the size, in bytes, of the selected data.
Click Sign to choose signed or unsigned data.
Click Endianness to choose between big endian or little endian representation.
Binary Padding Use this page to insert and overwrite binary data. Type the data to insert in the Pad with field. Select the appropriate format, such as bytes or ASCII, from the list.
Click Pad selection only to replace the bytes that you have selected in the binary editor. This control is not available if you have not selected any bytes in the binary editor.
Click Number of occurrences, and then type the number of times to repeat the binary padding.
Go to Offset Use this page to move the cursor to a different position in the binary data. Type the offset in the Enter offset field.
Select Make selection with previous and new offset so that the bytes between the current cursor position and new cursor position are selected when you click OK.
Click Absolute or Relative to choose an absolute offset or relative offset. An absolute offset starts with the first byte of data. A relative offset is measured from the current cursor position.
Click Forward or Backward to choose the direction for relative offsets. This control is not available for absolute offsets.
Find/Replace Use this page to search for binary data and to replace binary data, if necessary. This page is available only when the binary editor is not in read-only mode. Type the data to search for in the Find field. Select the appropriate format, such as bytes or ASCII, from the list.
Type the replacement data in the Replace field. Select the appropriate format, such as bytes or ASCII, from the list.
Click Forward or Backward to choose the direction to search from the cursor position.
Click All or Selection to choose between searching all of the binary data or searching only the data selected in the binary editor.
Find Use this page to search for binary data. This page is available only when the binary editor is in read-only mode. Type the data to search for in the Find field. Select the appropriate format, such as bytes or ASCII, from the list.
Click Forward or Backward to choose the direction to search from the cursor position.
Click All or Selection to choose between searching all of the binary data or searching only the data selected in the binary editor.
Encodings Select from the list the encoding to use for displaying binary data. Read-only Click Read-only to toggle between read-only and writable states. If the binary data contains a data-correlation reference, it is read-only and cannot be changed to writable. Paste This page is displayed only if you attempt to paste data from the clipboard into the editor and the data on the clipboard includes characters that are not valid in the current encoding scheme. For example, this page is displayed if you attempt to paste accented characters when the encoding is set to ASCII.
Click Paste only the valid character to paste only the characters that are valid in the current encoding scheme. All characters that are invalid in the current encoding scheme will be discarded.
Click Replace invalid character by 00 byte to paste the string from the clipboard, replacing all characters that are invalid in the current encoding scheme with a null character.
Transforming binary data in tests
You can transform binary data in tests to view the data in a more readable format and to assist with data correlation. Binary data in a test might contain values that must be correlated for the test to play back properly.
Record a test containing binary data.
To transform all the binary data in a test:
- Open a test for editing.
- Click Edit | Re-correlate test and transform data.
- In the Data Correlation and Transformation window, select the Apply data transformation check box.
- From the list, select a transformation to perform:
- To convert the binary data to the equivalent ASCII representation, select the Convert To Ascii Text check box. Characters that are not part of the readable ASCII character set are shown as escaped hexadecimal values.
- To convert the binary serialized representation of a Java. object into XML format, select the Convert Java Serialized Object to XML check box. You can also use this transformation to examine and perform data correlation on tests against applications that use serialized Java objects.
- To transform Adobe Flex objects into XML format, select the Convert AMF to XML check box.
- To transform the Windows Communication Foundation binary code into XML, select the Convert Microsoft WCF-Binary to XML check box.
- To apply built-in data correlation rules, select the Apply
corresponding data correlation rules if transformation succeeds check box, and then click Finish.
To remove data transformation from the test, clear the check boxes in the list of available transformers and generate the test.
Transforming binary data in specific requests
You can transform binary data in requests to view the data in a more readable format.
Record a test containing binary data.
- Open a test for editing.
- In the Test Contents area, select the request containing binary data to transform.
- Scroll to the bottom of the Test Element Details area, and then click the Advanced tab.
- In the Data Transformation area, click Change. The current data transformation is displayed in the Applied Transform field in the Data Transformation area. The Select Transformation Adapter window opens.
- Select the data transformation to perform. To remove data transformation from the request, select [none]. If the application under test uses serialized Java. objects, do not transform individual requests. Instead, configure the product to automatically apply the Convert Java Serialized Object to XML transformation to all binary data. The binary data in the request is transformed using the specified transformation adapter.
Transforming binary data automatically
You can configure the product to automatically transform binary data in tests into more readable formats. Automatically transforming all binary data in a test can increase the time it takes to generate a test. The alternative to automatically transforming all binary data in a test is to transform data in a specific request.
- Click...
-
Window | Preferences | Test | Test Generation | Enable data transformation
- From the list of available transformers, select the transformations to apply to the binary data. If you choose the Convert To Ascii Text transformation on a test containing readable data in a format other than ASCII, that data becomes unreadable. For example, text in languages that use a double-byte character set becomes unreadable.
- Optional: Select Apply corresponding data correlation rules if transformation succeeds to apply built-in rules for Flex applications if the Convert AMF to XML transformation is successful.
- Click OK.
> View or transforming GWT encoded data
When you record an application that is developed on Google Web Toolkit(GWT), the recorded data is encoded. To view the encoded data, open the test editor. You can also transform the encoded data into XML format, which you can use for data correlation.
- Record an application that is based on GWT version 2.4.
- You must have access to the classes that contain the exchanged objects.
- You must add the JAR file containing the classes that are serialized and exchanged between client and server to your project. To add the JAR file, in the Test Navigator view, right-click the project, click Properties, and, on the Library tab add the JAR file.
- To view the encoded data, in the Test Navigator, browse to the test, and double-click it.
- Select a test element or request containing the encoded data. The Content field in the Test Element Details area contains the encoded data.
- To transform the encoded data, click Edit | Re-correlate test and transform data.
- Confirm that the Apply data transformation check box is selected and select Convert GWT RPC to XML.
- Optional: To use data correlation after the transformation is successful, select the Apply corresponding data correlation rules check box.
- Click Finish. The encoded data transforms into XML format.
> Transforming GraniteDS or BlazeDS data
This topic is applicable for IBM Rational Performance Tester version 8.5.1. To test an application that is developed on Granite Data Services (GraniteDS) or Adobe BlazeDS framework, you must deserialize or transform the objects that are encoded in the AMF format to the XML format.
- IBM RPT supports GraniteDS 2.3.2.
- For GraniteDS transformation, you must add the rpt-granite.jar and granite.jar to the class path, along with any other JAR files required for the deserialization process.
- For BlazeDS, you must add the JAR files required for the deserialization process to the class path. To add rpt-granite.jar or any other JAR files to the class path, right-click the project in Test Navigator view and click Properties. Click the Libraries tab, and then click Add External JARs. Browse to PathToTheProduct\IBMIMShared\plugins\com.ibm.rational.test.lt.datatransform.adapters_VersionNumber to select rpt-granite.jar or to any other folder to select other JAR files.
- You must set the JAR files in order. Click the Order
and Export tab and ensure that you have the following order:
- JRE.
- Plug-in Dependencies.
- rpt-granite.jar.
- Any Application JAR files.
- BlazeDS JAR files if you use BlazeDS. For instance, flex-messagin-common.jar and flex-messaging-core.jar.
- granite.jar.
To transform the GraniteDS or BlazeDS data:
- Record the test.
- On the toolbar, click the Re-correlate test and transform data icon.
- Click the Convert Granite Data Service (AMF) to XML check box and click Finish. The AMF data is transformed to XML.
You can now correlate the data.
> Transforming SAP Web DynPro XML to ASCII
This topic is applicable for IBM Rational Performance Tester version 8.5.1. To test applications that are built using the SAP Web DynPro framework and correlate data, you must transform data to the ASCII format. By default, when you generate a test containing Web DynPro XML, IBM RPT transforms data to the ASCII format. If the data is not transformed automatically, you must manually select the transform option and rerun the test.
To manually select the transform option:
- In RPT, click...
-
Window | Preferences | Test | Test Generation
- Select the Convert SAP Web DynPro XML Encoding to Ascii check box.
- Click OK.
> Create custom data transformations
You can create your own data transformations to transform binary data in tests. Data transformations can convert binary data to a more readable format and can assist with data correlation.
To create a data transformation, you must be familiar with developing Java. methods in Eclipse.
To create a data transformation:
- Click File | Switch Workspace | Other, and then type a workspace name to create a new workspace. The product restarts in the new workspace.
- Extract the MyTransformProject.zip archive file. The MyTransformProject.zip archive file contains the MyNewDataTransformFeature and MyTransformProject projects . By default, this file is installed in the C:\Program Files\IBM\IBMIMShared\plugins\com.ibm.rational.test.lt.sampleversion_date\install directory.
- Import the MyNewDataTransformFeature and MyTransformProject projects into the new workspace.
- Click...
-
Window | Open Perspective | Resource
- Open the MyTransformer.java file for editing.
- Implement the transformData and unTransformData methods to create your data transformations.
- Optional: If you need other .jar files to implement your transformations, add the .jar files to a user library.
- Right-click the MyTransformProject project in the Resources view, and then click Build Path | Configure Build Path.
- Click the Libraries tab.
- Click Add Library. The Add Library window opens.
- Select User Library, and then click Next.
- Click User Libraries.
- Click New, and then type a library name.
- Click Add JARs, and the select the .jar files to add.
- Start another copy of the workbench to debug your transformations. To learn more about debugging, see Local Debugging in the Eclipse documentation.
- Click Run | Debug Configurations.
- Select Eclipse Application.
- Click the New launch configuration icon.
- Edit the new configuration, and then click Debug.
- In the copy of the workbench started for debugging, record a test, and then open the test for editing.
- Click Edit | Data Transformation. The Select Transformation Adapter window opens. The MyTransformer transformation is listed along with the default transformations supplied with the product.
- Select the MyTransformer transformation, and then click OK. Data correlation is removed when you apply a transformation. To correlate the test data again, click Edit | Re-correlate test data.
- Right-click MyNewDataTransformFeature, and then click Export.
- Select Plug-in Development | Deployable features, and then click Next. The Deployable features window opens.
- Select MyNewDataTransformFeature.
- On the Destination page, type or click Browse to specify a directory, and then click Finish. The installable feature is exported to the specified directory. The exported files can be compressed into archives to make it easier to copy them to other computers.
Use custom data transformations
After you have created a custom data transformation, you can apply it to binary data in tests. To use a custom data transformation, you must create and install the corresponding feature.
Create a custom data transformation.
To use a custom data transformation:
- To install the feature on computer different from the computer where you created the transformation, click Help | Install New Software.
- On the Available Software window, click Add. The Add Repository window opens.
- Click Local.
- Navigate to the installable feature, and then click OK.
- On the Available Software window, clear the Group items by category check box. MyNewDataTransformFeature is displayed in the list of available software.
- Select MyNewDataTransformFeature, and then click Finish.
Your custom data transformation is available when you click Edit | Data Transformation.
Compound tests
You can create compound tests to help you organize smaller tests into scenarios that can then be run end-to-end. Each of the smaller tests in a compound test can run on a different domain if required, such as a mobile device, or a web browser, and so on.
If you need to combine various tests into a single workflow or end-to-end scenario, you can organize the tests into a compound test. Each of the tests may perform parts of the scenario. Each of the tests may also run in a different domain if required, for example, a web browser or a mobile device, or others. A typical example of a compound test is an online buying workflow. You may have built smaller tests for each part of an online purchase transaction, such as "log on", "log out", "view item", "add to cart", and "check out". You can combine these tests into a single flow in a compound test. When the compound test is run, its individual tests are run in sequence.
The types of tests you can combine into a compound test depend on the testing capabilities you have purchased. If you have purchased only mobile testing capabilities, you can combine tests on mobile applications into a compound test. If you have purchased additional testing capabilities along with mobile testing, you can also combine tests built using Selenium, HTTP tests, Socket tests, Citrix tests or SAP tests into a compound test.
To build the scenario you require in a compound test, you can also add the following annotations:
- Comments
- Synchronization points
- Loops
- Delays
- Transaction folders
- Tests that are mandatory, using the Finally blocks
- Tests to be run in random order, using the Random Selector
Create a compound test
You can create compound tests to help you organize smaller tests into scenarios that can then be run end-to-end. Each of the smaller tests in a compound test can run on a different domain if required, such as a mobile device, or a web browser, and so on.
- Create a test workbench project.
- In the Test Workbench perspective, in the Test Navigator, right-click the test workbench project and click New, and then click Compound Test.
- In the New Compound Test dialog box, specify the name of the compound test and the location where it must be stored. By default, the test is stored in the workspace of the test workbench project you selected. You can select a different project location if desired. The file extension testsuite is added to the file name, and the new compound test is added to the Compound Tests folder of the test workbench project, visible in the Logical View. The new test is also visible in the Resource View, under the test workbench project. The contents and test element details are displayed in the compound test editor in the right panel.
- In the compound test editor, add the components of the compound test. The types of tests you can combine into a compound test depend on the testing capabilities you have purchased. If you have purchased only mobile testing capabilities, you can combine tests on mobile applications into a compound test. If you have purchased additional testing capabilities along with mobile testing, you can also combine tests built using Selenium, HTTP tests, Socket tests, Citrix tests or SAP tests into a compound test.
- To build the scenario you require in a compound test, you can also add the following annotations by clicking Add and selecting the appropriate option:
- Comments
- Synchronization points
- Loops
- Delays
- Transaction folders
- Tests that are mandatory, using the Finally blocks
- Tests to be run in random order, using the Random Selector
- Save your changes.
View compound tests
You can view a compound test in the Compound Test Editor.
When you open a workspace, the tests and projects that reside in the workspace are listed in the Test Navigator.
You can view compound tests in the Logical and Resource Views in the Test Navigator. From any of these views, you can open the test in the Compound Test Editor.
- In the Logical View of the Test Navigator, compound tests are listed in the Compound Tests folder under the project into which they were imported. Double-click the compound test under the Compound Tests folder to open it in the Compound Test Editor. In the Resource View, all tests under a project are shown in the project folder. Double click the compound test under the project folder to open it in the Compound Test Editor.
- In the Java perspective, compound tests under a project are shown under the root project folder. Double click the compound test under the project folder to open it in the Compound Test Editor.
- The Compound Test Editor contains two panels - the Compound Test Elements panel, where the elements of the workflow are listed. Click one of the elements, and its details are displayed int the far right portion of the right panel, which is the Compound Test Element Details panel. Double-click any of the test or the test elements to view its details. The name of the test, test path, source type and execution mode are displayed.
Add tests into a compound test
After creating a compound test, you can add the smaller test pieces that contribute to the larger workflow you are constructing with the compound test. When you run a compound test, each of the tests added to it are invoked in the sequence defined.
You can add many tests of the same type, or different types, to a compound test, depending on the testing capabilities you have purchased. If you have purchased only mobile testing capabilities, you can combine tests on mobile applications into a compound test. If you have purchased additional testing capabilities along with mobile testing, you can also combine tests built using Selenium, HTTP tests, Socket tests, Citrix tests or SAP tests into a compound test.
To add tests to a compound test, complete these steps:
- In the Test Navigator, double-click the compound test to which you want to add a test. The contents of the compound test are shown in the Compound Test Contents panel in the Compound Test editor.
- Do one of the following:
- Click Add to add a test as the first element in the compound test.
- To insert a test before a specific element in the compound test, select the element and click Insert.
- Select the test you want to add to the Compound test, and click OK. The test is added to the compound test, and is displayed as part of the elements of the compound test in the Compound Test Contents panel. When you click the test you added, its details are displayed in the Compound Test Element Details panel in the Compound Test editor.
- Save your changes.
In addition to the tests that you can add to a compound test, you can also add the following elements to construct the workflow you need:
- Comments to document the test
- Delays in the test
- Synchronization points
- Loops
- Transaction folders
- Parts of the test that are mandatory
- Tests to be run in random order
Modify a compound test
You can modify a compound test in the Compound Test Editor. A compound test is a testing workflow comprising smaller tests and other test elements in a certain sequence. You might want to order the tests and test elements to suit your workflow requirement, or add further tests and elements.
- In the Test Navigator, double-click the compound test to modify. Its elements are shown in the Compound Test Contents right panel in the Eclipse Client.
- To add a test or test element at the beginning of the compound test elements list, select the compound test in the Compound Test Contents panel, click Add, and then click Test. To insert a test or test element into the test, select the test element before which the insertion must be made, and click Insert.
- Add or insert the test or test element you need, and click OK. The modified compound test displays its updated elements in the Compound Test Contents right panel.
- Save your changes.
Running compound tests
When you run a compound test, its test elements are run in the order defined in the compound test. When you run a compound test, you are prompted to open the Test Execution perspective, in which details of the test run are displayed. When the test run is complete, the Test Log displays the run results.
- In the Test Navigator, select the compound test you want to run.
- Click the Run As icon on the toolbar. The test runs. To run a launch configuration option, click the arrow beside the Run As icon and select Run Configuration. Select the desired configuration option and run the test. The Confirm Perspective Switch dialog box is opened, prompting you to switch to the Test Execution perspective. Click Yes.
- Select the desired option to run the test. The Test Execution perspective is opened and the test runs. On completion, the test log is displayed.
You can work with the test log by exporting it into a flat file.
Generating compound test result reports
When a compound test run is completed, a Test Log is shown in the Test Execution perspective. You can work with the information in the test log and also generate test result reports.
Export the Test Log
When a compound test run is completed, a Test Log is displayed in the Test Execution perspective. The Test Log displays the following details:
- The General Information tab displays the name of the compound test and its description. The location of the test log file is also shown.
- The Common Properties tab shows the verdict of the test results.
- The Verdict Summary and Verdict List tabs provide a pie chart of verdicts for different components of the test, and a list of the first 20 verdicts. You can view details about the verdicts by clicking the links in the Verdict List tab.
You can export the contents of the test log to a full-text file.
- To export the contents of the test log to a full-text file, right-click the test run result under the Results folder of the compound test, and click Export Test Log.
- In the Export Test Log dialog box, specify where the test log should be exported to, in the Location field.
- Select the format in which the log must be exported, from the list in the Export Format field. You can select either Flat Text - Default Encoding or Flat Text - Unicode Encoding.
- Click Finish. The test log is exported as a full-text file, with the test results run name, to the location you specified.
Generating a functional test report
You can generate a functional test report from the test run results as a HTML file. When you generate a functional test report as a HTML file, the following details are displayed in the report:
- A global summary, which lists the number of tests run, verification points, defects
- A test summary which displays the name of each test, the start and end times and the verdicts.
- In the Test Workbench perspective, test run results are displayed under the Results folder of a project. Right-click the test run result you want to view and click Generate Functional Test Report. The Generate Functional Test Report dialog box is opened.
- Select the parent folder in which the report must be stored.
- By default, the name of the compound test and the date and time stamp is displayed as the name of the report in the Name field. You can change the name.
- Click Next.
- Select the report template to be used. If you select the Common Functional Test Report (XSL) format, the report is generated as a HTML file. If you select the Common Test Functional Report format, you can select either the HTML or PDF output format.
- Click Finish. The report is generated and displayed. The report is listed under the Functional Reports folder under the compound test in the Test Navigator.
Create an executive summary
You can create an executive summary or test statistics report from the test run results. Executive summaries are generated according to the type of test. An executive summary displays the tests and methods that were run, and their success or failure information. This information is shown in summary charts as well as in bar graphs.
- Under the Results folder of the project, right-click the test run result you want to view and click Create Executive Summary. The Generate Functional Test Report dialog box is opened.
- Select the type of test report you want to generate.
- Click Finish. The report is generated and displayed. The report is listed under the Functional Reports folder under the compound test in the Test Navigator.
Add a compound test to a Test Workbench project
You can create a compound test in a test workbench project. If you have an existing compound test, you can import the test to a test workbench project.
Create a compound test in a test workbench project
You can create a compound test in a test workbench project.
- Create a test workbench project.
- In the Test Workbench perspective, in the Test Navigator, right-click the test workbench project and click New, and then click Compound Test.
- In the New Compound Test dialog box, specify the name of the compound test and the location where it must be stored. By default, the test is stored in the workspace of the test workbench project you selected. You can select a different project location if desired. The file extension testsuite is added to the file name, and the new compound test is added to the Compound Tests folder of the test workbench project, visible in the Logical View. The new test is also visible in the Resource View, under the test workbench project. The contents and test element details are displayed in the compound test editor in the right panel.
- In the compound test editor, add the components of the compound test. The types of tests you can combine into a compound test depend on the testing capabilities you have purchased. If you have purchased only mobile testing capabilities, you can combine tests on mobile applications into a compound test. If you have purchased additional testing capabilities along with mobile testing, you can also combine tests built using Selenium, HTTP tests, Socket tests, Citrix tests or SAP tests into a compound test.
- To build the scenario you require in a compound test, you can also add the following annotations by clicking Add and selecting the appropriate option:
- Comments
- Synchronization points
- Loops
- Delays
- Transaction folders
- Tests that are mandatory, using the Finally blocks
- Tests to be run in random order, using the Random Selector
- Save your changes.
Import a compound test into a Test Workbench project
You can import a compound test into a test workbench project.
Procedure
- In the Test Workbench perspective, in the Test Navigator, right-click the test workbench project into which you want to import the compound test and click Import.
- In the Import dialog box, expand General in the source list, select Import test assets with dependencies and then click Next.
- Specify the directory in which the compound test resides. Click Browse. By default, the compound test is imported into the test workbench project folder.
- The compound test assets in the folder you selected are displayed. Select the components you want to import.
- Click Finish. The imported compound test is displayed in the Compound Test Elements panel in the Compound Test editor.
Add compound tests to schedule
This topic is applicable for IBM Rational Performance Tester version 8.5.1. To test the performance of multiple tests, you can add all the tests to a compound test and add the compound test to a user group. When you run a schedule, all the tests in the compound test are run in a sequential order. A user group can be defined locally, which means the parameters to run the user group are defined in the schedule. A user group can be associated with a compound test, which means that the parameters to run that user group are defined in the compound test.
To add a compound test:
- In the schedule editor, add a user group.
- Click the user group and in Behavior, click Use compound test.
- Select a compound test and click OK. If there are no compound tests in the project, click Create, specify a name for the compound test, and click Finish. If there are test variables associated with a compound test and also defined in the schedule, the variables with the compound test take precedence while running the user group.
- Save the test.
Emulating workloads
You emulate a workload by creating a schedule and adding user groups, tests, and other elements to it.
Schedule overview
A schedule can be as simple as one virtual user running one test, or as complicated as hundreds of vusers in different groups, each running different tests at different times.
A schedule is the "engine" that runs a test. However, schedules are much more than simple vehicles for running tests. For example, you can use a schedule to control tests in the following ways:
- Group tests under user groups, to emulate the actions of different types of users
- Set the order in which tests run: sequentially, randomly, or in a weighted order
- Set the number of times that each test runs
- Run tests at a certain rate
- Run tests for a certain time, and increase or decrease vusers during the run
When you first create a schedule, it is displayed with one user group, as shown below. You add user groups, tests, and other items to the schedule to emulate a workload.
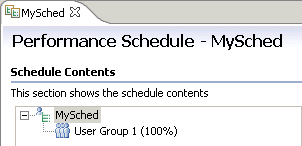 When
you add items to a schedule, they appear in italic type, as shown below. The italic type changes to regular type after you save the schedule.
When
you add items to a schedule, they appear in italic type, as shown below. The italic type changes to regular type after you save the schedule.
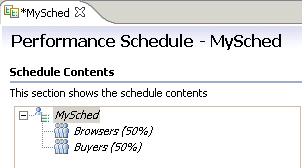
To resize the schedule window, do one of the following:
- Click Ctrl+Alt+> or Ctrl+Alt+< to enlarge or reduce the window.
- Hover at the left side of the Schedule Element Details area. When you see a vertical blue line, right click the line and select a size ratio from the menu.
Create a schedule
By creating a schedule, you can accurately emulate the actions of individual users.
- Right-click the project, and then click New | Performance Schedule.
- Type the name of the schedule, and then click Finish. A new schedule containing one user group is displayed.
- Add user groups and set the locations (agent computers)
on which each user group will run. Although you can run user groups from your workbench computer, doing so affects the accuracy of your tests.
- To add user groups: Right-click the schedule, and then click Add | User Group.
- To set the locations for the user groups: Click a user group, click the Locations tab, and then select Run this group on the following locations.
- Set the loops for the tests (or other schedule elements) to use: Right-click the user group to contain the loop, and click Add | Loop. Loops are used to run many iterations of a test, to run tests at a set rate, and to run tests in stages, which is discussed later.
- Add selectors and their weights: Right-click the schedule element to contain the selector, and click Add | Random Selector. Selectors are used to run a series of tests in random order, thus emulating the varied actions of real users, instead of running each test within a user group sequentially. The weight that you assign each selector determines the statistical probability that its child element is selected during an iteration.
- Add tests to each user group: Right-click the schedule element to contain the test, and click Add | Test.
- Set the stages for the schedule. Each stage lasts for a specific amount of time and contains a specific number of users. By setting stages, you can model workloads that reflect real-world usage
over time. Putting the tests in a stage in an infinite loop prevents
vusers from finishing before the stage ends. To set a stage:
- Open the schedule, and click the User Load tab.
- On the User Load page, click Add. Enter the number of users in the stage and the duration of the stage.
- Click...
-
Window | Preferences | Test | Test Reports
... and verify that Launch Compare report when staged run completes is selected. This selection automatically generates a report that compares each stage.
- Add other schedule elements to refine the schedule structure:
Right-click a schedule element, and click Insert (adds the new element before the selection) or Add (adds the new element after the selection).
<
Element Purpose For more information Synchronization point Used for coordinating the activities in a schedule, such as forcing vusers to wait at a specific point Delay Used to emulate user actions accurately; for example, a user might delay before placing an order Comment Used for your notes and comments regarding the schedule element - Set the schedule options:
<
Tab name Typical setting For more information Resource monitoring Select Enable resource monitoring to enable resource monitoring. - Apache HTTP Server Managed Beans
- Apache Tomcat Managed Beans
- IBM DB2 monitoring
- IBM Tivoli monitoring
- IBM WebSphere Performance Monitoring Infrastructure
- JBoss Application Server Managed Beans
- Java. Virtual Machine Managed Beans
- Oracle Database monitoring
- Oracle WebLogic Server Managed Beans
- SAP NetWeaver Managed Beans
- The rstatd daemon (UNIX)
- Simple Network Management Protocol (SNMP) agents
- Windows Performance Monitor
Response time breakdown Select Enable collection of response time data to enable response time breakdown. You can collect response time breakdown data from HTTP or SOA tests. Think time Use the options on this page to increase, decrease, or randomize the think time. The default setting is to use the recorded think time. Statistics log level Typically, keep the default settings. If you are running a long test, change the sampling rate from the default 5 seconds to a larger interval. Test log level Typically, keep the default setting of Primary test actions. You must have at least this level of logging to create a Page Percentile report and to see page title verification points that you have set. Problem definition log level Change the default settings only when requested to do so by IBM Software Support. Advanced (at the bottom of the Schedule Element Details area) Click Edit Options to set protocol-specific options that apply to all tests in the schedule. Setting protocol-specific options for a schedule is similar to setting protocol-specific options for a user group.
After you create a schedule that describes the behavior for your software system, run the schedule against successive builds of the application under test or with an increasing number of vusers. Then analyze the results that are reported.
Set user loads
By setting stages, you can model workloads over time and change the number of users that perform certain tasks to reflect real-world usage. You can vary the user load and collect performance metrics for each stage independently, which means that a single run can more efficiently accomplish the work of multiple runs that require shutting down and restarting users. Each stage, which lasts a specific amount of time and contains a specific number of users, defines a different load. When a schedule contains stages, you can place the tests in the schedule in an infinite loop, as shown in the following figure. This setting prevents vusers from finishing the stage before the allotted time.
 You can also use the Percentage of users allowed to exit during execution option to specify the number of users that can stop during a stage without stopping the stage or the entire test run.
To add stages to a schedule:
- In the Test Navigator, browse to the schedule and double-click it. The schedule opens. By default, the User Load
tab contains one stage with five users that run until finished. The following figure shows the default User Load tab.

- On the User Load tab, click Add.
- In the Create User Stage window, enter the information for a schedule stage, and click OK.
Option Description Number of users Enter the total number of users in the stage. This is not the number of users to add to or to remove from those currently running; it is the total number of active users at this stage. Stage Duration Enter the length of time (and the time units) for the stage to run. After the Number of users setting is achieved, the users will run for up to this amount of time. When the time expires, the users continue to run if they are needed for the next stage, or, if not, they are stopped. Rate of Change Specify the amount of time to delay, when changing the number of users, between adding or removing each user. Add or removing all users over a time period changes the users in a uniform random distribution over the time specified for changing users, which is the time before the settle and the stage begin. This slight variance closely emulates human behavior.
Add or removing one user every time unit adds the same delay for each user. Although this option does not emulate human behavior as closely as the first option, it is useful when you must adhere to a certain rate because of limitations of the system under test, such as the time it takes for a user to log on to the system.
Settle Time After the desired user population has been reached, a system might still experience a period of flux in reaction to the change in user population. Setting a settle time allows the system to re-establish its steady-state equilibrium so that it can accurately reflect the user population. The Stage Duration starts after the settle time expires. The settle time is not part of the stage duration and the settle-time metrics are not included in the Compare report, which is generated at the end of the run. However, settle time does affect how long a schedule runs, because it adds time to the beginning of each stage. And, although the Compare report does not include the settle-time metrics, these metrics are collected and you can include them by changing the time range of the report.
If your system does not have significant flux or if the stage is long enough that the flux comprises only a minor part of it, you might not need a settle time.
- On the User Load tab, modify the stages as necessary:
- Click Up or Down to change the order of the rows.
- Double-click a row to modify it.
- Enter the Time limit for a user to respond to a stop request value. If a stage contains fewer vusers than its predecessor, the excess users are asked to stop. This value gives a stopped virtual user extra time to complete its current action (such as an HTTP request). If the virtual user cannot complete its action before the time limit expires, it is forced to stop. Note that a long time limit might delay the next stage.
- Enter a value for Percentage of users allowed to exit during execution to specify the percentage of users that can stop during a stage of a test run. The default is 0%, which means if any users stop during a stage, the entire test ends after that stage completes. If you enter a value, the test run can continue to the next stage even if some users stop running. You can specify a value from 0 to 100 with fractions up to one decimal place. Examples of valid percentages include 0.5%, 3%, and 99.1%.
- Examine the User Load Preview section
to verify that the stages are set correctly. The red line segments
indicate that the total number of users has been achieved for the stage and the settle time, if one is specified, has ended. The following figure illustrates a schedule with two 16-minute
stages. The second stage has a 4-minute change rate and a 4-minute
settle time:
You can display a Compare report, which compares the time ranges of each stage, when the run is complete. This report provides a quick side-by-side analysis of how the system under test performs under various user loads. To display a Compare report, right-click the test results; then click Compare All Time Ranges.
To display a Compare report automatically at the end of each staged schedule run, click...
-
Window | Preferences | Test | Test Reports | Launch Compare report when staged run completes
Think time overview
Think time is a delay in the processing of a request to reproduce the time that a human would take to read or examine the data that is displayed from a previous user action. Think time is calculated from the time that a request is received (that is, the display is complete on the monitor) until the time that the user clicks a key or link to perform an action.
Set think time behavior in schedules
You can increase, decrease, or randomize think time in your tests, or you can play it back exactly as recorded.
To set the think time in a schedule:
- In the Test Navigator, browse to the schedule and double-click it. The schedule opens.
- You can set the think time behavior for an entire schedule or you can override the think time behavior for any specific user group.
- To set the think time behavior for the entire schedule, in the Schedule Contents area, click the name of the schedule and click the Think Time tab.
- To override the think time behavior for a specific user group, in the Schedule Contents area, click the name of the user group, click the Options tab, and select the Override think time options check box.
- Set the think time behavior to one of the following options:
Option Description Use the recorded think time. This option does no affect the think time. The time that it takes for a test to play back is the same as the time that it took to record it. So, for example, if you were interrupted for five minutes during recording, the same five-minute think time occurs when you run the test. Specify a fixed think time. Each virtual user's think time is exactly the same value: the value that you type. Although this option does not emulate users accurately, it is useful if you want to play a test back quickly. Increase/decrease the think time by a percentage. In the Think time scale field, specify a percentage by which each virtual user's think time is multiplied. A value of 100 indicates no change in think time. A value of 200 doubles the think times, so that the schedule plays back half as fast as it was recorded. A value of 50 reduces the think times by half, so that the schedule plays back twice as fast. A value of 0 indicates no delays at all. Vary the think time by a random percentage. Each virtual user's think time is randomly generated within the upper and lower bounds of the percentages that you supply. The percentage is based on the recorded think time. For example, if you select a lower limit of 10 and an upper limit of 90, the think times are between 10 percent and 90 percent of the original recorded think time. The random time is distributed uniformly within this range. - To set a maximum think time, select the Limit think times to a maximum value check box and specify a value.
- Save the schedule.
Limiting think times in schedules
You can speed up playback by defining a maximum value for the think times of vusers in schedules.
Set a maximum think time is useful with tests that mimic the actual user's think times. For example, if you are interrupted when you record a test, you do not have to record the test again. Instead, you can set a maximum think time. By setting a maximum, you can truncate all think times that exceed the specified value, without having to search for and edit each long think time. No think time used will be greater than the maximum limit you set, even if you have chosen to vary the think time by a percentage that would exceed this maximum.
- In the Test Navigator, browse to the schedule and double-click it. The schedule opens.
- In the Schedule Contents area, click the name of the schedule.
- Click the Think Time tab and select the Limit think times to a maximum value check box.
- In Maximum think time, type a number and select a time unit.
To restore the original think times, clear the Limit think times to a maximum value check box.
Limiting think times in tests
You can speed up playback and the time that debugging tests requires by defining a maximum value for the think time of a single user test playback.
Limiting think time is especially useful when you are debugging a test. By setting a maximum, you can truncate all think times that exceed the specified value, without having to search for and edit each long think time. No think time will be greater than the maximum you set.
This maximum applies to running individual tests. The limit does not apply to running tests in schedules. When a test is run as part of a schedule, the maximum think time value is ignored.
- In the Test Navigator, click...
-
Window | Preferences | Test | Test Execution
- The default value for maximum think time is 2 seconds. To change the maximum think time value, in Max think time (seconds), change the number. If you do not want to limit the amount of think time during test playback, enter a large number.
- Click Apply, and then click OK.
To restore the original think time default settings, click Restore Defaults.
User group overview
User groups enable you to group tests in a logical order.
With user groups, you can control test execution in several ways:
- Group tests by characteristics. For example, you could have two user groups.a Buyers group and a Browsers group.that represent the types of users on your system.
- Influence the order in which tests are run. When you run a schedule, the first test in each user group runs.in parallel, not sequentially. After the first test in a user group is completed, the second test runs, then the third, and so on.
The following schedule contains one user group.
 If
you run this schedule with 10 users, they are assigned to the only user group.Browsers
and Buyers. When the schedule run starts, the 10 vusers start running
the first test in parallel. As soon as one test is finished, a virtual user moves to the second test. Thus, you have 10 vusers, all starting at the same time and running each test sequentially. This does not give you much
control over the run.
If
you run this schedule with 10 users, they are assigned to the only user group.Browsers
and Buyers. When the schedule run starts, the 10 vusers start running
the first test in parallel. As soon as one test is finished, a virtual user moves to the second test. Thus, you have 10 vusers, all starting at the same time and running each test sequentially. This does not give you much
control over the run.
The following schedule contains the same tests in the same order, but they are divided between two user groups. Conceptually, this schedule is easier to understand, because the user's tasks are grouped logically.the Browsers browse, and the Buyers browse and then bid on a product. But, even more important, this schedule is a more accurate representation of the types of users on your system, because each user group contains tests that represent the actions that they do, and the proportions of the user groups (70% and 30%) represent the proportions of the users on your system.
 If you run this schedule with 10 users, seven are assigned to the Browsers group, and three are assigned to the Buyers group. When the run starts, the seven Browsers and the three Buyers start in parallel. Thus, you have seven Browsers, each running two tests sequentially, and three Buyers, each running three tests sequentially.
Add a user group to a schedule
By defining user groups, you can group related tests and run the tests in parallel.
- In the Test Navigator, browse to the schedule, and double-click it. The schedule opens.
- Right-click the schedule, and then click Add | User Group.
- In Group name, type a descriptive name for the user group.
- Under Group size, select Absolute or Percentage,
and type the number of users or a percentage of users in the group.
Option Description Absolute Specifies a static number of vusers. Type the maximum number of vusers to be able to run. For example, if you type 50, you can run up to 50 vusers each time you run a schedule. Typically, you create an Absolute user group only if the group does not add a workload. For example, if one test prepared a website for use and another test restored the site to its initial state, each test would be in an Absolute user group containing one user. Percentage Specifies a dynamic number of users. Type the percentage of the workload that the user group represents. Typically, you assign user groups a percentage, rather than an absolute number. For example, perhaps 70.0% of your users browse your website, and 30.0% order an item from your website. Set up two user groups in this proportion. Then, at the schedule level, type the initial number of users to run. You can also add users during the run. The schedule distributes the users among the dynamic user groups according to the percentages you specify. You can specify fractional percentages.
- Under Locations, select Run this group on the local computer or Run this group on the following locations.
Option Description Run this group on the local computer The user group runs on your computer. Use this option if the workload is small or if you are testing the schedule. Run this group on the following locations Typically, you run user groups on remote computers. When user groups run on remote computers, the workbench activity on the local computer does not affect the ability to apply load. Run user groups at remote locations in these cases: - When a large number of vusers are running and the local computer does not have enough processor or memory resources to support this load. You can conserve resources by running the users on different locations, so that fewer users run on each computer.
- When a test requires specific client libraries or software. The user group containing this test must run on a computer that has the libraries or software installed.
- To declare a remote location:
- Click Add | Add New. The Add New wizard opens. On the first page of the wizard, you can specify general properties for the remote location.
- In Hostname, type the IP address or the fully qualified host name of the remote computer.
- In Name, type a descriptive name for the remote computer.
- In Deployment Directory, type the directory on the remote computer to store the test assets. The directory, which is created if it does not exist, stores the temporary files that are needed during a schedule run.
- In Operating System, select the operating system of the remote computer, and then click Next.
If you use Processor Value Unit (PVU) licensing capability, you must select the operation system that is PVU licensed. For example, Windows (PVU Licensed) and not Windows.
- Specify the IP aliasing properties for this location. To make it appear as though each virtual user has its own IP address, click Enable IP Aliasing.
- To use IP addresses from all network interfaces at the remote location, click Use IP addresses from all network interfaces.
- To use addresses from a subset of network interfaces,
click Only use IP addresses from the following network interfaces.
Click Add to add the name of an interface and Edit to change the interface name. Specify network interfaces separated by commas, for example, eth0, eth1. If you do not use this form, the connection attempt fails.
- Click Next. On the third page of this wizard, you can specify file locations.
- In File name, type the name of the file to contain information about this computer, and then click Next.
The data stored in the file includes information such as the host name and deployment directory. You can change this information later by opening the Test Navigator and double-clicking the file.
- To add an already declared location:
- Click Add | Add Existing.
- In the Select Location window, select the computer on which the user group will run, and then click OK.
Example
The following schedule shows two user groups. Browsers represent 70.0% of the users, and Buyers represent the remaining 30.0%: 
After you have added user groups to a schedule, add the tests that each user group will run.
Adjusting user groups
You can adjust multiple user groups simultaneously to distribute a load across groups and to set the groups to run on the workbench computer. Typically, when you run performance schedules, user groups run on remote agent computers, not on the local workbench computer.
- In the Test Navigator, browse to the schedule, and double-click it. The schedule opens.
- Under Schedule Contents, select the groups to adjust.
- Under Schedule Element Details,
adjust the group sizes or set all groups to run on the workbench computer.
Option Description Same Size Click to set the selected user groups to the same size. All Percentage Click to distribute the load equally among the selected user groups, based on percentage. All Absolute Click to distribute the load equally among the selected user groups, based on absolute numbers. All Local Click to configure all user groups to run on the workbench computer.
Emulating slower network traffic
You can emulate various WAN connection speeds used for HTTP traffic to determine its effect on response times and throughput. You can set a user group to emulate the speed at which HTTP data is sent and received. By delaying the network uploads and downloads to emulate a slower network connection, the user group mirrors real-world interaction with production servers.
To emulate line speed:
- In the Test Navigator, browse to the schedule and double-click it. The schedule opens.
- In the schedule, click the user group for which you want to define a line speed.
- In the Schedule Element Details area, click the Options tab.
- To declare the line speed value:
- Click Enable line speed control.
- Select the actual line speed, or select Custom values to enter a value.
- Select the required line speed, or select Custom values to enter a value, which must be lower than the actual line speed.
Example
If a user group employs multiple agent computers (locations) that have different real line speed values, to obtain the highest possible accuracy, we recommend that you divide the user group into smaller user groups so that each user group contains agents with the same actual line speed value. However, even if the actual line speeds are different, if they are both much larger than the required line speed, then the inaccuracy will be small, and may even be tolerable.The following example illustrates this difference. The actual line speeds are different (100 Mbps and 10 Mbps) but are both much larger than the desired line speed of 56 Kbps:
The computed line speed delay for a 5000 byte response where the actual line speed is 100 Mbps and the desired line speed is 56 Kbps is 706 ms. The computed line speed delay for a 5000 byte response where the actual line speed is 10 Mbps and the desired line speed is 56 Kbps is 702 ms. In this example, the inaccuracy is only 4 ms.
Running long duration tests
When tests exceed 24 hours, resource consumption issues can cause problems with the SAP and Citrix clients. The long run mode increases the reliability of long duration tests with the SAP and Citrix protocols by running the tests in multiple processes.
Ensure that the test plays back reliably, with no errors, when run as a single test.
For Citrix tests, a new process is created for each virtual tester.
For SAP tests, a new process is started each time the number of test instances reaches a specific value.
The following guidelines improve the success of long duration tests:
- Use agent computers with at least 2GB of RAM and 10GB of free disk space, running the same version of the IBM Rational Performance Tester or RPT Agent. Disable antivirus software, screen savers, and automatic updaters. Avoid using the agent computers during the test.
- Keep individual tests short by avoiding loops of more than 10 iterations within each test, and achieve the desired long run duration by looping within the schedule. Do not exceed 20 or 30 virtual testers per agent computer with a think time above several seconds.
- Use tests with a minimal number of verification points.
For SAP:
- Do not use the Signature theme. Disable all animations in the SAP GUI.
- Any mouse click could be interpreted by a hidden SAP GUI window, which could cause the test to fail.
- Ensure that the Screen Throughput counter remains low (approximately 1 per second per agent).
To enable long run mode:
- In the Test Navigator, browse to the schedule and double-click it. The schedule opens.
- In the schedule, click the schedule element and in the Schedule Element Details area, configure the options
- On the Test Log page, disable Show errors and failures.
- On the Problem Determination page, set the log level to Severe.
- On the Statistics page, set the log level to Schedule Actons or Primary Test Actions, set a sample interval between 15 and 30 minutes, and select only store All Hosts statistics.
- On the Performance Requirements page, disable performance requirements.
- In the schedule, click the user group for which you want to enable the long run mode.
- In the Schedule Element Details area, click the Options tab and click Edit Options.
- To enable long run mode:
- Click Enable long run mode.
- For SAP tests, type a value to specify the Number of test starts per process. Ideally, set this value to 1.5 times the number of virtual testers for the user group.
Running a user group at a remote location
You can run a user group at a remote location (also called an agent computer), rather than on your local computer, to prevent your workbench activity from affecting the ability to apply load.
Before you run a user group at a remote location, verify that:
- IBM Rational Performance Tester Agent is installed on the remote computer. The agent is configured and connected to the RPT workbench.
- Firewall is disabled on the workbench computer or configured to allow incoming connections on the port number 7080.
- A reasonable number of vusers will run at the remote location. When you assign a user group to a remote location, do not overload the remote agent computer. If you exceed the number of vusers that the remote computer can run, the performance measurements of the server will be skewed because they will be affected by the performance of the computer. The test results will reflect the load of the computer more than the load of the server. For best results on a computer with a 1 GHz processor and 1 GB of RAM, do not exceed 1000 concurrent vusers.
- When a large number of vusers are running and the local computer does not have enough processor or memory resources to support this load. You can conserve resources by running the users on different locations, so that fewer users run on each computer.
- When a test requires specific client libraries or software. The user group containing this test must run on a computer that has the libraries or software installed.
- In the Test Navigator, browse to the schedule and double-click it. The schedule opens.
- In the schedule, click the user group to run on a different computer.
- In the Schedule Element Details area, click Run this group on the following locations.
- To declare a remote location:
- Click Add | Add New. The Add New wizard opens. On the first page of the wizard, you can specify general properties for the remote location.
- In Hostname, type the IP address or the fully qualified host name of the remote computer.
- In Name, type a descriptive name for the remote computer.
- In Deployment Directory, type the directory on the remote computer to store the test assets. The directory, which is created if it does not exist, stores the temporary files that are needed during a schedule run.
- In Operating System, select the operating system of the remote computer, and then click Next.
If you use Processor Value Unit (PVU) licensing capability, you must select the operation system that is PVU licensed. For example, Windows (PVU Licensed) and not Windows.
- Specify the IP aliasing properties for this location. To make it appear as though each virtual user has its own IP address, click Enable IP Aliasing.
- To use IP addresses from all network interfaces at the remote location, click Use IP addresses from all network interfaces.
- To use addresses from a subset of network interfaces,
click Only use IP addresses from the following network interfaces.
Click Add to add the name of an interface and Edit to change the interface name. Specify network interfaces separated by commas, for example, eth0, eth1. If you do not use this form, the connection attempt fails.
- Click Next. On the third page of this wizard, you can specify file locations.
- In File name, type the name of the file to contain information about this computer, and then click Next.
The data stored in the file includes information such as the host name and deployment directory. You can change this information later by opening the Test Navigator and double-clicking the file.
- To add an already declared location:
- Click Add | Add Existing.
- In the Select Location window, select the computer on which the user group will run, and then click OK.
Work with agents
If you have a big user load or workload to test, typically a single computer might not be able to process the load efficiently. You need to distribute the load across multiple computers, also called Rational Performance Tester agents. The agents are installed on computers to generate the load on the application.
Use the RPT workbench to distribute the user load. When you distribute the load among agent computers, you should remember the load each agent computer can take efficiently.
Rational Agent Controller is used to gather data for the Response Time Breakdown feature and in support of the startup and control of web services stubs in the SOA protocol. The Load Generation Agent is used to generate load for the application under test by using the vusers.
When installing RPT Agent, you can specify the hostname of the workbench to poll. After the installation, the agent automatically connects to the workbench. To share the agent with multiple workbenches, you can either manually add them to the majordomo.config file located at installationDir/Majordomo or use the Share Agent with New Workbench option.
The RPT workbench automatically deploys test assets required for execution to participating agents.
A typical set up of RPT workbench, RPT agents,
and the system under test is shown here: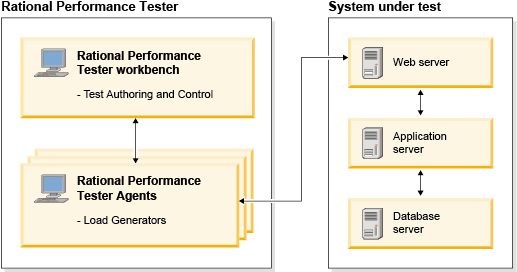
Checking the status of agents
Before running a schedule or test, you can check whether the agents are active and connected to the workbench.
Ensure that the Rational Performance Tester agent is running and points to the correct workbench. When installing the agent, ensure to specify the correct non-secure port number where the workbench listens for the agent. You can view or change the non-secure port number of the current workbench at Windows | Preferences | Test | Server. An agent can be in one of the following statuses:
| Agent status | Description |
|---|---|
| Ready | Majordomo is running on an agent computer and is in regular (default 5 seconds) contact with a workbench. |
| Busy | Agent is participating in the schedule execution. |
| Lost Contact | Agent has not contacted the workbench for the past 10 seconds. |
The majordomo.config file located at installationDir/Majordomo in the RPT agent computer contains the host name and the port number of the workbench the agent polls for work to do. By default, the agent polls for work at the interval of every 5 seconds.
- To check the status of agents, on the toolbar, click
 . The Agent Status window lists the agents that are connected to the workbench and their status.
- To share an agent with other workbenches, in the Agent Status window, select an agent and click Share Agent with New Workbench.
- Specify the host name and port number of the new workbench and click OK.
- To disconnect an agent from the workbench, select an agent and click Disconnect Agent from this Workbench. To disconnect the agent from all the workbenches, you must perform the disconnection from each workbench.
Configure port numbers for agents
If any service, such as an application server, on the workbench computer uses the default port numbers, you can change the port numbers so that agents can communicate through the new port numbers. By default, the port numbers for unsecured and secured ports are 7080 and 7443. The IBM Rational Performance Tester agents poll the workbench using the non-secure port number. To encrypt the communication between the workbench and agents, select Workbench and agent communication is encrypted using TLS/SSL. RPT then uses the secure port number for communicating with agents. The workbench internally sends the secure port number to the agents via messages exchanged over the non-secure port number.
- If you change the non-secure port number, you must configure the agents to poll the new port number. In the RPT computer, open the majordomo.config file located at installationDir/Majordomo and update the port number.
- If two instances of a workbench are opened on one computer, first workbench gets access to port 7080 to communicate to an agent. For the another workbench to access the agent, use a different port number.
- In RPT, click...
-
Windows | Preferences | Test | Server
- Specify the new port numbers and click OK.
You must now update the majordomo.config file for the agents to poll the new port numbers.
Manage the deployment directory for agents
You can choose to delete or keep the deployment directory for agents after schedule execution. By default, Rational Performance Tester does not delete the deployment directory. The deployment directory stores the files required for test execution. If you do not delete the deployment directory, the next time that you run a schedule, RPT only retrieves the test assets that it does not have or that have changed since the last execution. This mechanism reduces the launch time for subsequent test executions.
However, if you have many schedules and the accumulation of files in the deployment directory might create a problem, you can choose to delete the deployment directory on the agent computers. The deletion of the deployment directory depends on the successful completion of a schedule. A schedule execution is deemed successful when all the agents reach a state of inactivity with no active users or when the schedule execution reaches the end of the last stage and then stops.
If the run is stopped manually, the run encounters a severe error, or communication between the agents and workbench stops, the deployment directory is not deleted even if you specify to delete it.
To delete the deployment directory on the agent computers after schedule execution, click...
-
Windows | Preferences | Test | Server | Delete deployment directory on the agent after execution
Configure the high-resolution timer
You can configure agent computers to use a high-resolution timer when collecting performance data. The high-resolution timer ensures that all measurements are precise to within 1 millisecond.
The high-resolution timer is used by default on the Linux operating system. You do not need to configure the high-resolution timer on the Linux operating system. For the Microsoft Windows, AIX , and z/OS operating systems, the high-resolution timer is not used by default.
Enable the high-resolution timer can increase processor usage on Windows agent computers. Typically, processor usage increases by 10% to 25%, but the increase can vary based on workload. Enable the high-resolution timer on Windows agent computers if you are measuring response times less than 15 milliseconds. Enable the high-resolution timer if you are measuring response times of less than 150 milliseconds and need 1 millisecond precision instead of 15 millisecond precision. If you enable the high-resolution timer on Windows agent computers, monitor the processor usage to determine whether the trade-off of higher processor usage is acceptable.
To enable the high-resolution timer on an agent computer:
- In the Test Navigator, open the location that represents the agent computer.
- Click the General Properties tab.
- On the General Properties page, click Add to create a property for the selected location.
- In the New Property window, create a property entry:
- In Property Name, type RPT_VMARGS.
- In Operator, select =.
- In Property Value, type -DrptNanoTime.
- Click OK, and then save the location. The high-resolution timer is enabled for the location.
Add a test to a schedule
By adding a test to a schedule, you can emulate the action of an individual user.
- In the Test Navigator, browse to the schedule and double-click it. The schedule opens.
- Right-click the schedule element that will contain the test, and then click Add | Test.
- In the Select Tests window, expand the project name to display the test to add.
- Click the name of the test, and then click OK. The test is displayed in the schedule.
Add must run tests
In a schedule, you can use the Finally block to specify tests that must be run after the main workload is completed, when the last stage duration is expired, or a schedule is stopped manually. A schedule can contain many user groups. A user group can contain only one Finally block. A Finally block can contain many tests.
- From the Test Navigator, open a schedule.
- Select a user group and click Add | Finally.
- Select the Finally block and click Add | Test Invocation.
- Select the tests to add and click OK.
Assigning variables to schedule and user group
In addition to assigning variables at the test level, you can assign variables at the schedule level and user group level. When you assign variables at the schedule level, all the tests and user groups in the schedule can use the variable initial values, if they have the same variable names. When you initialize variables at the schedule level, all the user groups in the schedule use the variable initial values, except those for which a specific value is defined. If the same variable initial value is defined at the user group level and schedule level, precedence is given to the user group level and then to the schedule level. If the visibility of a test variable is set to This test only, the test does not use the value that is defined at the user group level or schedule level.
- In the Test Navigator view, double-click a schedule to open it.
- To assign a variable at the schedule level or a user group level, in the Schedule Contents area, select a schedule or a user group.
- In the Schedule Elements Details area, click the Variable Initialization tab and click Add.
- Type a variable name and its initial value. If you have already defined the variables at the test level and want to reuse them, click Select existing variables.
- Optional: To use the variables from an existing file, click the Use variable initial values file check box, browse for the file, and click Finish.
- Click Options | Save.
Defining performance requirements in schedules
You can define performance requirements for a schedule to specify acceptable thresholds of performance and to validate service level agreements.
- In the Test Navigator, browse to the schedule and double-click it. The schedule opens.
- In the Schedule Element Details area, click the Performance Requirements tab, and select Enable Performance Requirements. The page contains a table of performance requirements that apply to the schedule. Within the table, the requirements are organized into common requirements, which pertain to all protocols, protocol-specific requirements, and requirements that pertain to resource data being collected.
- Expand the requirements tree, click the requirement to define, and define the requirement as follows:
Option Description Name You can change the name of a performance requirement to improve readability. However, changing a requirement name causes a mismatch between the Performance Requirements report, which uses the changed name, and the other reports, which use the default name. Therefore, when you change a requirement name, be sure to keep track of the original name. Operator Select an operator. Value Type a value. Standard Click to make the requirement standard. If a standard requirement is not met, the schedule run will have a verdict of fail. Clear to make the requirement supplemental. In general, supplemental requirements are used for requirements that are tracked internally. A supplemental requirement cannot cause a run to fail, and supplemental results are restricted to two pages of the Performance Requirements report. - Optionally, select Hide Undefined Requirements to hide the shaded rows. Shading indicates that a requirement is not defined.
- Select a requirement and click Clear to remove its definition. The requirement is still available and can be redefined.
Example
You can define performance requirements in a test, if your protocol supports it, or in a schedule. When you define a requirement in a test, the requirement is defined individually for each test element.even if you select multiple test elements. When you define a requirement in a schedule, the requirement is applied to the aggregate of test elements.For example, assume that you select every page in a test and define this requirement: Average response time for page [ms] [For Run] must be less than 5 seconds. This means that if one page in the test has a response time of 6 seconds, the requirement on that page fails. The other pages, which have a response time of less than 5 seconds, pass.
Assume that you open a schedule and define this requirement: Average response time for all pages [ms] [For Run] must be less than 5 seconds. This measures the average response time for all of the pages. One page can have a response time of 30 seconds, but if enough pages have sufficiently low response times to counter the negative effect of that one page, the requirement passes.
Repeating tests in a schedule
By adding a loop to a schedule, you can repeat a test for a number of iterations and set the rate for running a test. If the loop contains a synchronization point, the synchronization point is released after the first iteration of the loop and stays released for all further iterations.
A schedule containing only user groups and tests runs each test in a user group sequentially. Loops provide more sophisticated control than running a simple sequence of consecutive tests.
You can set a loop within a schedule or a test. The following table shows the advantages of both methods:
| Loop location | Results |
|---|---|
| Schedule | Loops in schedules are easy to locate and modify.
Loops in schedules close the server connection at the end of each iteration and reopen it at the beginning of the next iteration. This action models the behavior of a user closing and reopening a browser. Use this method to run a test at a set rate. |
| Test | Loops in tests can be more granular, and thus
provide a higher level of control.
Loops in tests reuse the server connection during each loop iteration. Use this method, with loops that have high iteration counts, to stress test a server. |
To add a loop to a schedule:
- In the Test Navigator, browse to the schedule and double-click it. The schedule opens.
- Click the item to be the parent of the loop, and then click Add | Loop.
- In the Schedule Element Details area, type the number of iterations for the loop to repeat.
Option Description Count-based Runs for the number of iterations that you select. Time-based Runs at least for the time that you specify. The loop always finishes the iteration. For example, if you select a time of 1 second and a loop takes 10 seconds to run, the loop finishes one iteration, and then checks the time. Infinite Runs until the schedule duration ends. Use this option to gather performance data over time: set an infinite loop, and then set the schedule to stop after a specific time. - To maintain a set transaction rate for all schedule items that are children of this loop:
- Select Control the rate of iterations.
- In the Iteration rate field, type a number, and select a time unit. This sets the actual rate.
- Select or clear the Randomly vary the delay
between iterations check box. Selecting this check box
causes the delay to vary slightly. This option models users more accurately,
because the iterations are spread out randomly over a certain period
of time.
Statistically, the Randomly vary the delay between iterations option sets delay amounts at random from a negative exponential distribution with the same mean as the fixed delay value. The negative exponential distribution has a long "tail," which means that a very small number of delays will have very large values. Therefore, make sure that the application you are testing is not negatively affected by long periods of inactivity (such as a timeout that disconnects the user).
- Select or clear the Delay before the first iteration of the loop check box. Selecting this check box staggers the first delay in each iteration so that you get a realistic mix at the first iteration.
Example
The following schedule contains two loops. Note that the Browse and Bid tests, which are controlled by the loop, must be children of the loop. 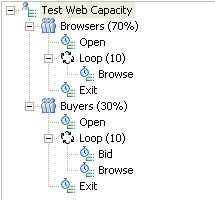
Delaying vusers or actions
By adding a delay to a schedule or a compound test, you can emulate user actions more accurately.
- In the Test Navigator, browse to the schedule or compound test and double-click it.
- Right-click the schedule or test element to be delayed, and then click Add | Delay.
- In the Element Details area, type the length and the time units of the delay.
Example
After you add a delay, you generally add the schedule or test elements that the delay controls. The elements are at the same level as the delay.they are not children of the delay.The following schedule shows three delays. The Browsers delay 10 seconds between each browse action. The Buyers delay 30 seconds between each Browse action and one minute before they decide to bid on an item.
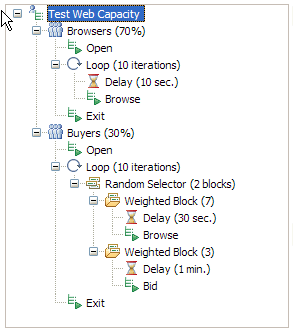
Running tests at a set rate
To run a test at a set rate, you add a loop to the schedule to control the iteration rate, and then add tests to the loop. The tests, which are children of the loop, are controlled by the loop. If the loop contains a synchronization point, the synchronization point is released after the first iteration of the loop and stays released for all further iterations.
To add a loop that controls the iteration rate for running tests:
- In the Test Navigator, browse to the schedule and double-click it. The schedule opens.
- Click the element that will be the parent of the loop, and then click Add | Loop.
- In the Schedule Element Details area, type the number of iterations that the loop will repeat.
- To continue executing the loop even after a request to stop the schedule execution is issued, select the Uninterruptible iteration check box. The schedule execution stops after the current loop iteration is complete. This check box is available only for schedules.
- To maintain a set transaction rate for all schedule items that are children of this loop, select the Control the rate of iteration check box.
- At Iteration rate, type a number and select a time unit. This sets the actual rate.
- Select or clear the Randomly vary the delay
between iterations check box. Selecting this check box
causes the delay to vary slightly. This option models your users more accurately because rather than delaying iterations at fixed intervals,
the delay amounts are varied randomly while maintaining the same average
iteration rate.
Statistically, the Randomly vary the delay between iterations option sets delay amounts at random from a negative exponential distribution with the same mean as the fixed delay value. The negative exponential distribution has a long "tail," which means that a very small number of delays will have very large values. Therefore, make sure that the application you are testing is not negatively affected by long periods of inactivity (such as a timeout that disconnects the user).
- Select or clear the Delay before the first iteration of the loop check box. Selecting this check box staggers the first delay in each iteration, so that you get a realistic mix at the first iteration.
After you have added the loop, you add the schedule items, usually tests, that the loop controls.
Running tests in random order
A schedule containing only user groups and tests will run each test in a user group sequentially. By adding a random selector to a schedule, you can repeat a series of tests in random order, thus emulating the varied actions of real users.
To add a random selector to a schedule:
- In the Test Navigator, browse to the schedule and double-click it. The schedule opens.
- Click the name of the schedule element to contain the random selector, and then click Add | Random Selector.
- In the Schedule Element Details area, add the number of iterations to loop.
Think of yourself as a "random selector." You are blindfolded, and you have a bucket containing 10 red balls and 10 green balls. You have a 50% chance of picking a red ball, and a 50% chance of picking a green ball. You pick a ball randomly.it is red. You then replace the ball in the bucket. Every time you pick a ball, you have a 50% chance of getting a red ball. Because the ball is replaced after each selection, the bucket always contains 10 red balls and 10 green balls. It is even possible (but unlikely) that you will pick a red ball every time.
- Set the weight of the random selector. The weight determines
the statistical probability that a specific element will be selected.
- Right-click the random selector and click Add | Weighted Block.
- In the Weight field, type an integer. This integer shows the relative proportion that each test runs.
Assume that a random selector contains two tests: Browse and Bid. You assign Browse a weight of 7 and Bid a weight of 3. Each time the loop is processed, Browse has a 70% chance of being selected, and Bid has a 30% chance of being selected.
Example
When a selector contains many different weights, you can mathematically determine the likelihood that a block will be executed. To do this, add the weights together and divide the weight for each block by that total.For example, assume a selector contains six blocks set to the following weight:
- two blocks set to a weight of 1
- one block set to a weight of 2
- two blocks set to a weight of 5
- one block set to a weight of 9
<
| Weight of block | Likelihood of block being selected |
|---|---|
| 1 (two blocks) | 1/23. = 0.0435, or about 4.35% (for each block) |
| 2 | 2/23 = 0.0870, or about 8.70% |
| 5 (two blocks) | 5/23 = 0.2174, or about 21.74% (for each block) |
| 9 | 9/23 = 0.3913, or about 39.13% |
Add a transaction to a schedule
A transaction is a specific group of test elements whose performance you are interested in. When viewing the test results, you can view performance data about any transactions that you have added.
You can add a transaction to a test or to a schedule.
To put a group of schedule elements into a transaction:
- In the Test Navigator, browse to the schedule and double-click it. The schedule opens.
- In the schedule, select the test elements to group together. Use Shift+click to select multiple contiguous elements; use Control+click to select multiple noncontiguous elements; each noncontiguous element is put in a separate transaction.
- Click Add (to place the transaction after the selected element) or Insert (to place the transaction immediately before the selected element or block), and click Transaction.
- In the Schedule Element Details area, give the transaction a meaningful name. This is useful in the Transactions report, which lists transactions by name.
You can now use the Add or Up and Down buttons to add the tests or elements to the transaction.
Synchronize users
Inserting a synchronization point enables you to coordinate the activities of a number of vusers by pausing and resuming activities. You can synchronize all vusers at the beginning of a schedule and stagger the release times so that the users do not overload the system. Synchronization points are also useful in stress testing. You can insert a synchronization point into a schedule or a test. The advantage of inserting a synchronization point into a schedule is that the synchronization point is more visible than in a test. Also, you can define release options and select a timeout for a synchronization point set in a schedule.
Synchronization points within loops are not reset. In other words, once a synchronization point has been released (in the first iteration of a loop) it stays released for all further iterations.
To insert a synchronization point into a schedule:
- In the Test Navigator, browse to the schedule and double-click it. The schedule opens.
- Right-click the element just below the place to add the synchronization point, and then click Insert | Synchronization point.
- Enter a name for the synchronization point, or select the name of an existing synchronization point to modify its release type. The synchronization point opens in the schedule for you to set its attributes.

- Set the release type; that is, whether you want the users to be released at the same time or at staggered times. Use the Together release
type when you are preforming a stress test on the system. Use the Staggered release
type when you want the users released in such a way that they will not overwhelm the system.
Option Description Together Releases all users at once from a synchronization point. The default restart time is 0, which means that when the last user reaches the synchronization point, all users are released together immediately. To delay the users, enter a number in the Restart Time field. For example, if you set the restart time to 4 seconds, after all of the users reach the synchronization point (or the timeout occurs), they wait 4 seconds, and then they are all released.
Staggered Releases the users one by one from a synchronization point. The amount of time that each user waits to be released is chosen at random and is uniformly distributed within the range that you set in the Minimum time and the Maximum time fields.
For example, if the Minimum time is 1 second and the Maximum time is 4 seconds, after the users reach the synchronization point (or the timeout occurs), each user waits between 1 and 4 seconds after being released. All users are distributed randomly between 1 and 4 seconds.
- Set the timeout period. The timeout period begins when the first virtual user reaches the synchronization point. If all the users that are associated with the synchronization point do not reach
it when the timeout period ends, any users at the synchronization point are released. A timeout of 0 means that there is no timeout.
Set a timeout is useful, because one user might encounter a problem that prevents him from reaching the synchronization point. You do not want to hold up all users because of a problem with one user.
A user reaching a synchronization point after a timeout is not held. However, the user is delayed if the Minimum time and Maximum time are set.
Emulating network traffic from multiple hosts
By default, when you run a schedule, each virtual user has the same IP address. However, you can make each virtual user appear as though it is running on its own host. To do this, you configure IP aliases on the host computer, and enable IP aliasing in the schedule. When you run the schedule, the network traffic will appear to be generated by multiple hosts. To avoid IP conflicts, the IPs have to be legitimate, available within the same subnet, and blocked for distribution.
Configure IP aliases for a remote Windows location
To make it appear that a virtual user has its own IP address during a schedule run, configure IP aliases for each Windows remote location.
- Click Start | Settings | Control Panel | Network Connection.
- Open the network interface to associate the IP aliases with. In most cases this is the Local Area Connection. Click Properties.
- Scroll down to Internet Protocol (TCP/IP), and click Properties.
- You must be using static IP addresses to create IP aliases on this host. Therefore, confirm that Use the following IP address is selected, and then click Advanced.
- Create the IP aliases:
- Click Add in the IP Addresses area of the IP Settings page to specify the IP address of the new alias. Make sure that the address is valid for the network and is not being used by another host.
- Enter the IP address and the subnet mask of the new alias.
- After you create the alias, click OK in each previous dialog box to complete the configuration.
- Set the schedule so that the vusers will use IP aliases during a run
When you run the schedule, it will give the impression that the network traffic is being generated from multiple hosts.
You can insert custom code into your test to retrieve the runtime IP addresses of each virtual user.
To add multiple IP aliases, use the netsh command, as shown in the following example:
netsh -c Interface ip add address name="Gig Ethernet" addr=10.10.0.21 mask=255.255.0.0
The ntcmds.chm file, typically located in C:\WINDOWS\Help, contains more details about the netsh command. When you are finished with the IP aliases, use the following command to remove them:
netsh -c Interface ip delete address name="Gig Ethernet" addr=10.10.0.21
You can also use a batch file to add and delete the aliases.
Configure IP aliases for a remote Linux location
To make it appear that a virtual user has its own IP address during a schedule run, configure IP aliases for each Linux location.
- Use the ip(8) command to create an IP alias.
The following example attaches the IP address 9.37.207.29 to the eth0 network interface:
# ip address add 9.37.207.29 dev eth0
To create a large number of aliases on a Redhat Linux platform, follow the instructions in the file /etc/sysconfig/network-scripts/ifup-aliases.
The following example deletes the alias:
# ip address del 9.37.207.29 dev eth0
- Set the schedule so that the vusers will use the IP aliases during a run
When you run the schedule, it will give the impression that the network traffic is being generated from multiple hosts.
You can insert custom code into your test to retrieve the runtime IP addresses of each virtual user.
Configure IP aliases for a remote AIX location
To make it appear that a virtual user has its own IP address during a schedule run, configure IP aliases at each remote AIX location
- Use the ifconfig command to create an IP alias. To have the alias created when the system starts, add the ifconfig command to the /etc/rc.net script.
The following example creates an alias on the en1 network interface. The alias must be defined on the same subnet as the network interface.
# ifconfig en1 alias 9.37.207.29 netmask 255.255.255.0 up
The following example deletes the alias:
# ifconfig en1 delete 9.37.207.29
- Set the schedule so that the vusers will use the IP aliases during a run
When you run the schedule, it will give the impression that the network traffic is being generated from multiple hosts.
You can insert custom code into your test to retrieve the runtime IP addresses of each virtual user.
Enable vusers to use IP aliases
After you have configured aliases at on remote computers, you set the schedule so that the vusers can use the configured IP aliases.
Before you can enable vusers to use IP aliases, you must:
- Configure the aliases at the remote location.
- Add the remote location to the user group.
To set the schedule so that the vusers will use the IP aliases during a run:
- In the Test Navigator, browse to the schedule and double-click it. The schedule opens.
- Click the user group whose vusers will use aliasing.
- Click Run this group on the following locations. The list of locations shows whether IP aliasing is enabled at that location.
- To change whether IP aliasing is enabled or disabled, click a row in the table, and then click Edit.
- On the IP aliasing page, click Enable IP Aliasing.
Option Select when Use IP addresses from all network interfaces You have one network interface, or you have multiple interfaces and want to use them all. Only use IP addresses from the following network interfaces You want to use some, but not all, network interfaces. Select the check box next to the interfaces to use. Click Add to add a new network interface. Typically, you enter an interface name in the form eth0 (Windows and Linux) or en0 (AIX ).
Monitoring resource data
You can use resource monitoring to capture data, such as processor or memory usage, while running a test schedule.
Resource monitoring can provide a comprehensive view of a system under test, to aid in problem determination. You can monitor the system under test or the agents by using these technologies:
- Apache HTTP Server Managed Beans
- Apache Tomcat Managed Beans
- IBM Tivoli monitoring agents
- IBMDB2 snapshot monitors
- The IBMWebSphere Performance Monitoring Infrastructure
- JBoss Application Server Managed Beans
- Java. Virtual Machine Managed Beans
- Oracle Database monitors
- Oracle WebLogic Server Managed Beans
- SAP NetWeaver Managed Beans
- Simple Network Management Protocol (SNMP) agents
- Windows Performance Monitor
To use resource monitoring, you must enable resource monitoring in the test schedule and add data sources.
Enable resource monitoring
You can enable resource monitoring to capture system resource data such as processor or memory usage.
To capture accurate resource monitoring data, you must ensure that the clocks on all computers are synchronized. If you do not synchronize the clocks on the workbench and on all of the computers involved in a test, resource counters will be displayed inaccurately (with respect to time) in the reports. (There are a number of tools that are available at no cost on the web to help you accomplish synchronization.) Valid resource monitoring data sources include these technologies:
- Apache HTTP Server Managed Beans
- Apache Tomcat Managed Beans
- IBM Tivoli monitoring agents
- IBMDB2 snapshot monitors
- The IBMWebSphere Performance Monitoring Infrastructure
- JBoss Application Server Managed Beans
- Java. Virtual Machine Managed Beans
- Oracle Database monitors
- Oracle WebLogic Server Managed Beans
- SAP NetWeaver Managed Beans
- Simple Network Management Protocol (SNMP) agents
- the UNIX rstatd monitor
- Windows Performance Monitor
- Open a schedule in the editor.
- In the Schedule Element Details area, click the Resource Monitoring tab.
- Click Enable resource monitoring. This activates the Data Source table.
- If this is a new schedule, the Data Source table is empty. If you have previously added resource monitoring data sources to this schedule, edit or remove them. Clicking Remove does not delete the data source from the file system; it merely removes it from this view. Other test schedules or applications might still use the data source.
- If you have existing locations in your workspace, you can click Add to add and configure them. If you do not configure the existing location, you are warned in the Data Source table that it is Not Configured.
- Select Ignore invalid resources when executing the schedule to suppress error messages about resource monitoring data sources. These errors can occur if the data sources are unreachable or invalid. If you select this option, you must view logs to see the error messages.
You have enabled resource monitoring.
You must specify the data sources. Configuration changes that you make for a particular data source are stored with that location. This configuration storage means that you have to set up a data source only once. If you export a schedule, it contains the data source configuration information. This data might include potentially sensitive information, such as stored passwords.
Enable resource monitoring on Windows Vista, Windows 7, and Windows Server 2008
The Windows Vista, Windows 7, and Windows Server 2008 operating systems include security features that are not found in previous versions of Windows. You must adjust the security settings to collect resource monitoring data. To enable the resource monitoring feature on Windows Vista, Windows 7, or Windows Server 2008, you must start the Remote Registry service, disable the remote User Account Control, and configure the firewall.
- Start the Remote Registry service. The Remote
Registry service is disabled by default on Windows Vista, Windows 7, and Windows Server 2008. This service must be running to collect resource monitoring data.
- Open the Administrative Tools Control Panel.
- Open Services.
- On the Remote Registry service entry, click Start.
- Optional: To launch the Remote Registry service automatically every time the operating system starts, right-click the Remote Registry service, and then click Properties, and set the Startup type to Automatic.
- Disable the remote User Access Control (UAC). When a user authenticates remotely, the UAC grants the user only standard privileges, even if the supplied credentials are in the Administrators
group. To work around this, modify the LocalAccountTokenFilterPolicy
registry key.
- Click Start | Run, and type regedit to open the Registry Editor.
- Navigate to HKEY_LOCAL_MACHINE\Software\Microsoft\Windows\CurrentVersion\Policies\System.
- Right-click the LocalAccountTokenFilterPolicy key, and select Modify; then change the value to 1.
- If the LocalAccountTokenFilterPolicy key does not exist,
right-click the right window, and select New DWord; then type the name LocalAccountTokenFilterPolicy, and set its value to 1.
To reset these remote authentication settings to their original state, set this key to 0.
- Restart the computer.
- Configure the firewall. The firewall blocks
remote administrative requests by default.
- Open the Firewall Control Panel.
- Click Change settings.
- Click the Exceptions tab.
- Select the Remote Administration option.
- Restart the computer.
- Check that the Remote Registry path is accessible.
- Open the Administrative Tools Control Panel.
- Open Local Security Policy.
- Expand Local Policies.
- Select Security Options.
- In the Policy column, right-click Network access: Remotely accessible registry paths and sub-paths and select Properties.
- Ensure that Software\Microsoft\Windows NT\CurrentVersion\Perflib is displayed in the list. If not, add Software\Microsoft\Windows NT\CurrentVersion\Perflib to the list.
Add sources for resource monitoring data
If you enable resource monitoring, you must specify the sources of resource monitoring data.
- Open a schedule for editing.
- At the bottom of the Resource Monitoring page, click Add. You might need to scroll down in the view. The Create and manage configurations wizard opens.
- Do one of these steps:
- To create a resource monitoring location, click Create new resource monitoring location.
- To add an existing location or to create a resource monitoring location that is based on an existing location, click Create or add a resource monitoring location from an existing source.
- Type an IP address or the fully qualified host name. This address or host name is for the node to monitor, not the Tivoli Enterprise Monitoring Server. You can choose the types of data sources.
- Select from these data sources:
- Apache HTTP Server Monitoring
- Apache Tomcat Application Server Monitoring
- IBM DB2 Monitoring
- IBM Tivoli Monitoring
- IBM WebSphere PMI Monitoring
- JBoss Application Server Monitoring
- JVM Monitoring
- Oracle Database Monitoring
- Oracle WebLogic Server Monitoring
- SAP NetWeaver Web Application Server Monitoring
- SNMP Monitoring
- UNIX rstatd monitor
- Windows Performance Monitor
Configure the data sources.
Add Apache HTTP Server sources
To capture resource monitoring data from Apache HTTP Server, you must configure the data source.
The Java. Management Extensions must be configured on the server that is running Apache HTTP Server. After installing Apache HTTP Server on Microsoft Windows, run the Configure Tomcat shortcut. Click the Java tab, and then edit the Java Options. The following lines are sample Java options:
-Dcom.sun.management.jmxremote
-Dcom.sun.management.jmxremote.port=8880
-Dcom.sun.management.jmxremote.ssl=false
-Dcom.sun.management.jmxremote.authenticate=false
On Linux, set environment variable CATALINA_OPTS in either TOMCAT_HOME/bin/setenv.sh or TOMCAT_HOME/bin/catalina.sh file. For example,
export CATALINA_OPTS="-Dcom.sun.management.jmxremote=true
                      -Dcom.sun.management.jmxremote.port=8686
                      -Dcom.sun.management.jmxremote.ssl=false
                      -Dcom.sun.management.jmxremote.authenticate=false
                      -Djava.rmi.server.hostname=your.server.domain.com"
Then, restart Apache HTTP Server.
- On the Location page, specify the connection and authentication information for the server that runs Apache HTTP Server. If you have to change the port that is used to communicate with the server, change the information in Connection. Typically, your Apache HTTP Server system administrator specifies this information. The port number must match the port that you specified when configuring Java Management Extensions on the server.
- If administrative security is enabled on the server, select Administrative
security enabled.
- Type the user ID and password for Apache HTTP Server in Authentication.
- Select Save Password to save your password locally. If you do not save your password, you might be prompted for it (depending on the host system configuration) when you edit the configured location or when you run test schedules that use the location.
- On the Resource page, select the type of data to capture. The tree view shows the counter groups and counters that are available from the application server. Be selective; monitoring all possible resource data requires substantial amounts of memory. Hold your mouse pointer over a counter to see details about what the counter measures.
- Configure the options on the Options page.
- Click Reset counters at start of run (client side reset only) to set the counters to 0 at the start of a schedule run. This does not change the actual values of the counters on the application server. Instead, the recorded values of the counters are corrected to start at 0.
- In Polling Interval, specify in seconds the interval for collecting resource data. For example, if you accept the default setting of 5 seconds, counter information is collected at 5-second intervals from the specified host during the schedule run.
- In Timeout Interval specify in seconds the time to wait for a response. If the resource monitoring host does not respond within this amount of time during a schedule run, an error is logged.
Add Apache Tomcat sources
To capture resource monitoring data from Apache Tomcat, you must configure the data source.
The Java. Management Extensions must be configured on the server that is running Apache Tomcat. After installing Apache Tomcat on Microsoft Windows, run the Configure Tomcat shortcut. Click the Java tab, and then edit the Java Options. Following are sample Java options:
-Dcom.sun.management.jmxremote
-Dcom.sun.management.jmxremote.port=8880
-Dcom.sun.management.jmxremote.ssl=false
-Dcom.sun.management.jmxremote.authenticate=false
On Linux, set the environment variable CATALINA_OPTS in either TOMCAT_HOME/bin/setenv.sh or TOMCAT_HOME/bin/catalina.sh file. For example,
export CATALINA_OPTS="-Dcom.sun.management.jmxremote=true
                      -Dcom.sun.management.jmxremote.port=8686
                      -Dcom.sun.management.jmxremote.ssl=false
                      -Dcom.sun.management.jmxremote.authenticate=false
                      -Djava.rmi.server.hostname=your.server.domain.com"
Then, restart Apache Tomcat.
- On the Location page, specify the connection and authentication information for the server that runs Apache Tomcat. If you need to change the port that is used to communicate with the server, change the information in Connection. Typically, your Tomcat system administrator specifies this information. The port number must match the port that you specified when configuring Java Management Extensions on the server.
- If administrative security is enabled on the server, select Administrative
security enabled.
- Type the user ID and password for Apache Tomcat in Authentication.
- Select Save Password to save your password locally. If you do not save your password, you might be prompted for it (depending on the host system configuration) when you edit the configured location or when you run test schedules that use the location.
- On the Resource page, select the type of data to capture. The tree view shows the counter groups and counters that are available from the application server. Be selective; monitoring all possible resource data requires substantial amounts of memory. Hold your mouse pointer over a counter to see details about what that counter measures.
- Configure the options on the Options page.
- In Polling Interval specify in seconds the interval for collecting resource data. For example, if you accept the default of 5 seconds, counter information is collected at 5-second intervals from the specified host during the schedule run.
- In Timeout Interval specify in seconds the time to wait for a response. If the resource monitoring host does not respond within this amount of time during a schedule run, an error is logged.
Add IBM DB2 sources
To capture resource monitoring data from IBM DB2 , you must configure the data source.
Your DB2 administrator must turn on the snapshot monitor switches for the resource monitoring data to collect. If the monitor switches are off, none of the resource counter groups will contain counters. For more information on the DB2 snapshot monitor, see these topics in the DB2 documentation:System monitor switches and Snapshot monitor.
To configure the DB2 data source:
- On the Location page, specify the connection and authentication information for the instance of DB2 to use to capture resource monitoring data. If you need to change the port that is used to communicate with the computer that is running DB2, change the information in Connection. Typically, your DB2 system administrator specifies this information.
- Under Database Settings, type a name in Database Name and partition number in Partition number. If the instance of DB2 to monitor uses the Database Partitioning Feature (DPF), then change the partition number to the partition to monitor. Otherwise, leave the partition number set to the default, 0.
- Type the user ID and password for DB2 in Authentication. To collect resource monitoring data from DB2, the specified user account must have SYSADM,
SYSCTRL, SYSMAINT, or SYSMON authority.
- Select Save Password to save your password locally. If you do not save your password, you might be prompted for it (depending on the host system configuration) when you edit the configured location or when you run test schedules that use the location.
- Optional: On the Monitoring Status page, click Check Monitoring Status to determine
the state of the monitor switches on the DB2 server. The states of the following monitor
switches are checked:
- DFT_MON_BUFPOOL
- Buffer pool switch
- DFT_MON_LOCK
- Lock switch
- DFT_MON_SORT
- Sort switch
- DFT_MON_STMT
- Statement switch
- DFT_MON_TABLE
- Table switch
- DFT_MON_TIMESTAMP
- Timestamp switch
- DFT_MON_UOW
- Unit of work switch
- On the Resource page, select the type of data to capture. The tree view shows the database server and its counter groups and counters. Be selective; monitoring all possible resource data requires substantial amounts of memory. Clear the Show only selected counters check box to see all available counters. Hold your mouse pointer over a counter to see details about what that counter measures.
- Configure the options on the Options page.
- In Polling Interval specify in seconds the interval, for collecting resource data. For example, if you accept the default of 5 seconds, counter information is collected at 5-second intervals from the specified host during the schedule run.
- In Timeout Interval specify in seconds the time to wait for a response. If the resource monitoring host does not respond within this amount of time during a schedule run, an error is logged.
Add IBM Tivoli Monitoring sources
To capture resource monitoring data from an IBM Tivoli Enterprise Monitoring Server, you must configure the data source.
To configure the IBM Tivoli Monitoring source:
- On the Tivoli Enterprise Monitoring Server page, specify the monitoring server to use to capture resource monitoring data.
- Type the IP address or the fully qualified host name of the monitoring server in the Host field on the Tivoli Enterprise Monitoring Server page. This is different from the Host field at the top of the Create and manage configurations wizard.
- Type the user ID and password for the monitoring server in Authentication.
- Change the Connection information if needed. Typically, your Tivoli system administrator will specify this information.
- Select Save Password to save your password locally. If you do not save your password, you might be prompted for it (depending on the host system configuration) when editing the configured location or when running test schedules that use the location.
- On the Resource page, select the type of data to capture. The tree view shows the host and all of its available IBM Tivoli Monitoring agents, and their respective counter groups and counters. Be selective; monitoring all possible resource data requires substantial amounts of memory. Clear the Show only selected counters check box to see all available counters. Hold your mouse pointer over a counter to see details about what that counter measures.
- Configure time intervals on the Options page.
- Type the Polling Interval in seconds, for collecting resource data. For example, if you accept the default of 5 seconds, counter information will be collected at 5-second intervals from the specified host during the schedule run.
- Type the Timeout Interval in seconds. If the resource monitoring host does not respond within this amount of time during a schedule run, an error will be logged.
Add IBM WebSphere Performance Monitoring Infrastructure sources
To capture resource monitoring data from the IBM WebSphere Performance Monitoring Infrastructure, you must configure the data source.
To configure the IBM WebSphere Performance Monitoring Infrastructure data source:
- On the Location page, specify the connection and authentication information for the instance of WebSphere Application Server to use to capture resource monitoring data. If you need to change the SOAP port used to communicate with the computer that is running WebSphere Application Server, change the Connection information. Typically, your WebSphere system administrator will specify this information.
- If administrative security is enabled on the computer that is running WebSphere Application
Server, select Administrative security enabled.
- Type the user ID and password for WebSphere Application Server in Authentication.
- Select Save Password to save your password locally. If you do not save your password, you might be prompted for it (depending on the host system configuration) when you edit the configured location or when you run test schedules that use the location.
- On the Resource page, select the type of data to capture. The tree view shows the application server and its counter groups and counters. Be selective; monitoring all possible resource data requires substantial amounts of memory. Clear the Show only selected counters check box to see all available counters. Hold your mouse pointer over a counter to see details about what that counter measures.
- Configure the options on the Options page.
- Click Reset counters at start of run (client side reset only) to set the counters to 0 at the start of a schedule run. This does not change the actual values of the counters on the application server. Instead, the recorded values of the counters are corrected to start at 0. For example, if you monitor the ServletRequestCount counter, it starts at 0 instead of its previous value.
- Type the Polling Interval in seconds, for collecting resource data. For example, if you accept the default of 5 seconds, counter information will be collected at 5-second intervals from the specified host during the schedule run.
- Type the Timeout Interval in seconds. If the resource monitoring host does not respond within this amount of time during a schedule run, an error will be logged.
Add Java Virtual Machine sources
To capture resource monitoring data from a Java. Virtual Machine (JVM), you must configure the data source.
The Java Management Extensions must be configured on the server that is running the JVM. Following are sample arguments to pass to the JVM:
-Dcom.sun.management.jmxremote
-Dcom.sun.management.jmxremote.port=8880
-Dcom.sun.management.jmxremote.ssl=false
-Dcom.sun.management.jmxremote.authenticate=false
- On the Location page, specify the connection and authentication information for the computer that is running the JVM. If you need to change the port that is used to communicate with the server, change the information in Connection. The port number must match the port that you specified when configuring Java Management Extensions on the server.
- If administrative security is enabled on the JVM computer, select Administrative security enabled.
- Type the user ID and password in Authentication.
- Select Save Password to save your password locally. If you do not save your password, you might be prompted for it (depending on the host system configuration) when you edit the configured location or when you run test schedules that use the location.
- On the Resource page, select the type of data to capture. The tree view shows the counter groups and counters that are available from the computer running the JVM. Be selective; monitoring all possible resource data requires substantial amounts of memory. Hold your mouse pointer over a counter to see details about what that counter measures.
- Configure the options on the Options page.
- In Polling Interval specify in seconds the interval for collecting resource data. For example, if you accept the default of 5 seconds, counter information is collected at 5-second intervals from the specified host during the schedule run.
- In Timeout Interval specify in seconds the time to wait for a response. If the resource monitoring host does not respond within this amount of time during a schedule run, an error is logged.
Add JBoss Application Server sources
To capture resource monitoring data from JBoss Application Server, you must configure the data source.
Before you can capture resource monitoring data from JBoss Application Server, you must specify the path to the JBoss client file, jbossall-client.jar on the JBoss Client Preferences page. The JBoss client file is provided with JBoss, not with Rational Performance Tester. The version of the JBoss client file must match the version of JBoss Application Server running on the server under test.
To configure the JBoss Application Server data source:
- On the Location page, specify the connection and authentication information for the instance of JBoss Application Server to use to capture resource monitoring data. If you need to change the SOAP port used to communicate with the computer that is running JBoss Application Server, change the Connection information. Typically, your JBoss system administrator specifies this information.
- If administrative security is enabled on the computer that is running JBoss Application Server, select Administrative
security enabled.
- Type the user ID and password for JBoss Application Server in Authentication.
- Select Save Password to save your password locally. If you do not save your password, you might be prompted for it (depending on the host system configuration) when you edit the configured location or when you run test schedules that use the location.
- On the Resource page, select the type of data to capture. The tree view shows the application server and its counter groups and counters. Be selective; monitoring all possible resource data requires substantial amounts of memory. Clear the Show only selected counters check box to see all available counters. Hold your mouse pointer over a counter to see details about what that counter measures.
- Configure the options on the Options page.
- Type the Polling Interval in seconds, for collecting resource data. For example, if you accept the default of 5 seconds, counter information will be collected at 5-second intervals from the specified host during the schedule run.
- Type the Timeout Interval in seconds. If the resource monitoring host does not respond within this amount of time during a schedule run, an error will be logged.
Add Microsoft Windows Performance Monitor sources
To capture resource monitoring data from Microsoft Windows Performance Monitor, you must configure the data source.
The Windows Performance Monitor option is enabled only for Microsoft Windows computers. If you are monitoring a non-Windows computer, this option is disabled.
To configure the Windows Performance Monitor data source:
- On the Location page, type the user ID, password, and domain.
The domain is optional, required only if you need to perform cross-domain
authentication.
The user ID must correspond to a user that is a member of the Performance Monitor Users group or the Administrators group on the computer from which you want to collect resource monitoring data. If the user is not in the Performance Monitor Users group or the Administrators group on the computer to monitor, no Windows Performance Monitor data is collected.
- Select Save Password to save your password locally. If you do not save your password, you might be prompted for it (depending on the host system configuration) when editing the configured location or when running test schedules that use the location.
- On the Resource page, select the type of data to capture. The tree view shows the host and all of its respective counter groups and counters. To see all the available counters, clear the Show only selected counters check box. Be selective; monitoring all possible resource data requires substantial amounts of memory. Hold your mouse pointer over a counter to see details about what that counter measures.
- Configure time intervals on the Options page.
- Type the Polling Interval in seconds, for collecting resource data. For example, if you accept the default of 5 seconds, counter information will be collected at 5-second intervals from the specified host during the schedule run.
- Type the Timeout Interval in seconds. If the resource monitoring host does not respond within this amount of time during a schedule run, an error is logged.
The host to monitor must be accessible through the Windows network. Resource monitoring data is collected using the net use command to establish a connection to remote computers. File and printer sharing must be enabled on the computer running the Windows operating system. Simple File Sharing, where remote connections are processed as access by the Guest user, must be disabled. In addition, system policies must not be set so that remote connections are processed as access by the Guest user. For example, if the Network security: Sharing and security model for local accounts policy is set to Guest only - local user authenticate as Guest and the Accounts: Guest account status policy is set to Enabled, then remote connections are processed as access by the Guest user. In that case, resource monitoring data is not collected.
Typically, if you are able to connect to a shared hard disk drive on the remote host from the workbench, then you will also be able to collect resource monitoring data from Windows Performance Monitor on the remote host. If file and printer sharing is not enabled on the remote host and you attempt to set up resource monitoring in a schedule, the following message is displayed:
IWAY0241E The host name IP_address is either not a known host or is not a Windows host.
To enable Windows file and printer sharing:
- Open the Network Connections Control Panel.
- Right-click the Local Area Connection (or the currently active network adapter).
- In the menu, click Properties.
- Select...
-
File and Printer Sharing for Microsoft Networks in This connection uses the following items.
- Click OK.
Add Oracle Database sources
To capture resource monitoring data from Oracle Database, you must configure the data source.
Before you can capture resource monitoring data from Oracle Database, you must specify the path to the Oracle Database client file, ojdbc6.jar on the Oracle Database Client Preferences page. The Oracle Database client file is provided with Oracle Database, not with Rational Performance Tester. The version of the Oracle Database client file must match the version of Oracle Database that is running on the server under test.
- On the Location page, specify the connection and authentication information for the server that runs Oracle Database. If you have to change the port that is used to communicate with the server, change the information in Connection. Typically, your Oracle Database system administrator specifies this information.
- In Database Name, type the name of the database to monitor.
- On the Resource page, select the type of data to capture. The tree view shows the counter groups and counters that are available from the application server. Be selective; monitoring all possible resource data requires substantial amounts of memory. Hold your mouse pointer over a counter to see details about what that counter measures.
- Configure the options on the Options page.
- In Polling Interval, specify in seconds the interval for collecting resource data. For example, if you accept the default setting of 5 seconds, counter information is collected at 5-second intervals from the specified host during the schedule run.
- In Timeout Interval, specify in seconds the time to wait for a response. If the resource monitoring host does not respond within this amount of time during a schedule run, an error is logged.
- Optional: Clear the Keep cursors open during runtime check box to allow database cursors to close while tests run. By default, Keep cursors open during runtime is selected, which prevents database cursors from being closed while tests run.
Add Oracle WebLogic Server sources
To capture resource monitoring data from Oracle WebLogic Server, you must configure the data source.
To capture resource monitoring data from Oracle WebLogic Server, you must specify the path to the client files:
- wljmxclient.jar
- wljmsclient.jar
- wlclient.jar
- On the Location page, specify the connection and authentication information for the computer that runs the Administration Server instance of Oracle WebLogic Server for the domain. If you need to change the port that is used to communicate with the Administration Server for the domain, change the information in Connection. Typically, your WebLogic system administrator specifies this information. An Oracle WebLogic domain consists of one or more Oracle WebLogic Server instances. One server is the Administration Server. To collect resource monitoring from an Oracle WebLogic domain that consisting of multiple servers, the specified host must be the Administration Server. The Administration Server is also known as the domain controller.
- If administrative security is enabled on the Administration
Server, select Administrative security enabled.
- Type the user ID and password for Oracle WebLogic Server in Authentication.
- Select Save Password to save your password locally. If you do not save your password, you might be prompted for it (depending on the host system configuration) when you edit the configured location or when you run test schedules that use the location.
- On the Resource page, select the type of data to capture. The tree view shows the application servers that the Administration Server manages and their counter groups and counters. Be selective; monitoring all possible resource data requires substantial amounts of memory. Clear the Show only selected counters check box to see all available counters. Hold your mouse pointer over a counter to see details about what that counter measures.
- Configure the options on the Options page.
- In Polling Interval specify in seconds the interval for collecting resource data. For example, if you accept the default of 5 seconds, counter information is collected at 5-second intervals from the specified host during the schedule run.
- In Timeout Interval specify in seconds the time to wait for a response. If the resource monitoring host does not respond within this amount of time during a schedule run, an error is logged.
Add SAP NetWeaver sources
To capture resource monitoring data from SAP NetWeaver, you must configure the data source.
Before you can capture resource monitoring data from SAP NetWeaver, you must specify the path to the client files:
- com_sap_pj_jmx.jar
- exception.jar
- logging.jar
- sapj2eeclient.jar
The resource monitoring feature was tested on SAP NetWeaver 7.0 (2004s). Resource monitoring from other versions of SAP NetWeaver might not be supported.
- On the Location page, specify the connection and authentication information for the instance of SAP NetWeaver to use to capture resource monitoring data. If you need to change the port for communicating with the computer that is running SAP NetWeaver, change the Connection information. Typically, your SAP NetWeaver system administrator specifies this information. Use the P4 port to communicate with the computer that is running SAP NetWeaver. The default value of the P4 port is 50004. For more information about port numbers, see the SAP NetWeaver documentation.
- Ensure that Administrative security enabled is selected.
- Type the user ID and password for SAP NetWeaver in Authentication. To capture resource monitoring data from SAP NetWeaver, use an account with administrator rights.
- Select Save Password to save your password locally. If you do not save your password, you might be prompted for it (depending on the host system configuration) when you edit the configured location or when you run test schedules that use the location.
- On the Resource page, select the type of data to capture. The tree view shows the application server and its counter groups and counters. Be selective; monitoring all possible resource data requires substantial amounts of memory. Clear the Show only selected counters check box to see all available counters. Hold your mouse pointer over a counter to see details about what that counter measures.
- Configure the options on the Options page. Type the Polling Interval in seconds, for collecting resource data. For example, if you accept the default setting of 5 seconds, counter information will be collected at 5-second intervals from the specified host during the schedule run.
Add Simple Network Management Protocol sources
To capture resource monitoring data from a Simple Network Management Protocol (SNMP) agent, you must configure the data source.
- On the Location page, specify the connection and authentication information for the SNMP agent.
- In MIB path, type or browse to the management information base (MIB) file. Typically, MIB files are supplied by manufacturers of devices that support SNMP.
- On the Resource page, select the type of data to capture. The tree view shows the counter groups and counters that are available from the application server. Be selective; monitoring all possible resource data requires substantial amounts of memory. Hold your mouse pointer over a counter to see details about what that counter measures.
- Configure the options on the Options page.
- Click Reset counters at start of run (client side reset only) to set the counters to 0 at the start of a schedule run. This setting does not change the actual values of the counters on the device that runs the SNMP agent. Instead, the recorded values of the counters are corrected to start at 0.
- In Polling Interval, specify in seconds the interval for collecting resource data. For example, if you accept the default setting of 5 seconds, counter information is collected at 5-second intervals from the specified host during the schedule run.
- In Timeout Interval, specify in seconds the time to wait for a response. If the resource monitoring host does not respond within this amount of time during a schedule run, an error is logged.
Add UNIX rstatd sources
To capture resource monitoring data from the UNIX rstatd daemon, you must configure the data source. UNIX rstatd is bundled with most Linux distributions.
To collect resource monitoring data from UNIX rstatd, the portmapper service must be enabled on the host computer. To determine whether the portmapper service is enabled, type the following on the command line of the host computer:
rpcinfo -p localhost
The portmapper service is listed in the output of the rpcinfo command. If it is not, contact your system administrator for help with installing or configuring the portmapper service.
- On the Resource Monitoring tab of the schedule editor, click Enable resource monitoring, and then click the Add button.
- Click Next and type the hostname of the computer to monitor.
- In Data Sources, click UNIX rstatd monitor,
and on the Locations tab, specify the connection parameters:
- Click UDP or TCP protocol.
- To use a different port number, click Use port and type the port number.
- On the Resource tab, select the type of data to capture. The tree view shows all available performance counters, with a default set of counters preselected. To see all available counters, clear the Show only selected counters check box. Be selective; monitoring all possible resource data requires substantial amounts of memory. Hold your mouse pointer over a counter to see details about what that counter measures.
- Configure time intervals on the Options tab.
- In Polling Interval, type a time value in seconds for collecting resource data. For example, if you accept the default of 5 seconds, counter information will be collected at 5-second intervals from the specified host during the schedule run.
- In Timeout Interval, type a time value in seconds. If the resource monitoring host does not respond within this amount of time during a schedule run, an error is logged.
Monitoring response time breakdown
You can use response time breakdown to see statistics on any page element that is captured while running a test schedule or imported from historical data.
Response time breakdown is a type of application monitoring that shows how much time was spent in each part of the system under test as the system was exercised. The response time breakdown view is associated with a page element (URL) from a particular execution of a test or schedule. This view shows the "insides" of the system under test, because the data collection mechanisms are on the systems under test, not the load drivers. Response time breakdown provides information down to the Java. EE method level for applications that are running on IBM WebSphere Application Server or BEA WebLogic Server, as well as calls from Java EE methods to plain old Java objects (POJOs).
You can collect response time breakdown data from HTTP and SOA tests. Response time breakdown does not apply to other protocols, such as SAP.
Typically, you capture response time breakdown in real time in development, or test, environments, rather than production environments. To capture response time breakdown data, you must enable it in a test or schedule and configure the amount of data to be captured.
The data collection infrastructure collects response time breakdown data. Each application server on which the application runs and from which you want to collect data must have the data collection infrastructure installed and running. In addition, each application server must be configured, or instrumented, to use the data collection infrastructure. See the installation guide to learn more about installing the data collection infrastructure.
IBM Rational Performance Tester provides limited ability to collect response time breakdown data. You can collect response time breakdown data for up to four processor cores on one application tier. For enhanced response time breakdown collection, contact your Rational account representative to learn more about IBM Rational Application Performance Analyzer.
Rational Application Performance Analyzer is a version of RPT that is licensed for extended response time breakdown data collection. To install, configure, or use Rational Application Performance Analyzer, follow the documentation for RPT.
Enable response time breakdown collection
You can enable response time breakdown collection to see how much time is spent in each part of the application as it runs.
To collect response time breakdown, the data collection infrastructure must be installed, configured, and running on all computers that are used in the distributed application under test. If you enable response time breakdown collection for a test and the remote computers are not running the data collection infrastructure, the following error is displayed: IWAY0159E The data collection infrastructure does not appear to be running on hostname. Please ensure that it is running and try again. To collect response time breakdown, do not run the Agent Controller in secure mode.
- Open a schedule in the editor.
- In the Schedule Element Details area, click the Response Time Breakdown tab.
- Select Enable collection of response time data. This activates the test list, the location list, and Options.
- Click Add.
- To add a new response time breakdown location, select Add New.
- To add an existing response time breakdown location, select Add Existing.
You have enabled response time breakdown data collection.
Set logging detail levels.
Enable response time breakdown collection on Windows Vista, Windows 7, and Windows Server 2008
Microsoft Windows Vista, Windows 7, and Windows Server 2008 include security features that are not in previous versions of Windows. You must adjust the security settings of these operating systems to collect response time breakdown data. The default security settings do not allow response time breakdown collection. By default, the firewall blocks inbound connection attempts. You must create an inbound connection rule to allow the Agent Controller to connect to the computer.
To collect response time breakdown, the data collection infrastructure must be installed, configured, and running on all computers that are used in the distributed application under test. If you enable response time breakdown collection for a test and the remote computers are not running the data collection infrastructure, the following error is displayed: IWAY0159E The data collection infrastructure does not appear to be running on hostname. Please ensure that it is running and try again.
- Open the Windows Administrative Tools Control Panel, and click Local Security Policy. The Local Security Policy window opens.
- Expand Windows Firewall with Advanced Security.
- Expand Windows Firewall with Advanced Security - Local Group Policy Object.
- Select Inbound Rules. Right-click the pane on the right, and select New Rule;
then complete these steps:

- On the Rule Type page, select Port; then click Next.
- On the Protocol and Port page, select TCP, and enter these ports: 10002, 10003, 10004, 10005, 10006; then click Next.
- On the Action page, ensure that Allow the Connection is selected; then click Next.
- On the Profile page, select all profiles; then click Next.
- On the Name page, type a name, for example, Remote Agent Controller, and click Finish.
- Right-click the new rule, and select Enable Rule.
Set logging levels
To limit the amount of response time breakdown data collected, adjust logging levels.
To set logging levels, you need to have a schedule where you have enabled response time breakdown data collection.
- Open a schedule in the editor.
- In the Schedule Element Details area, click the Response Time Breakdown tab.
- Choose a Detail level of Low, Medium, or High.
- If you set the detail level to High or Medium,
also click Only sample information from a subset of users to prevent the log from getting too large.
- Click Fixed number of users, and type a number to specify that the given number of users from each group is sampled. Unless you have specific reasons to collect data from multiple users, select Fixed number of users, and specify one user per user group.
- You can also click Percentage of users, and specify a percentage. That percentage is sampled from each user group, but at least one user is sampled from each user group.
Now you can run schedules and capture response time breakdown data.
Enable response time breakdown collection for specific page elements
You can enable response time breakdown for specific pages or page elements to see how much time is spent in each part of the application as the schedule runs. Enabling response time breakdown collection for only certain page elements can be useful if you want to minimize the amount of collected data. Enable response time breakdown collection for a whole test or schedule can require substantial amounts of memory.
To collect response time breakdown, the data collection infrastructure must be installed, configured, and running on all computers that are used in the distributed application under test.
If you enable response time breakdown collection for a test and the application servers are not running the data collection infrastructure, the following error is displayed: IWAY0159E The data collection infrastructure does not appear to be running on hostname. Please ensure that it is running and try again.
- Open a test in the editor.
- Expand the list under Test Contents to display the pages or page elements of interest.
- Select the pages or page elements to collect response time breakdown data for. Under Test Element Details, select Enable response time breakdown. You might need to scroll down in the test editor view to display the Enable response time breakdown check box. The Enable response time breakdown check box
is displayed only for elements that support response time breakdown data collection. The specific elements that support response time breakdown vary depending on the protocol (HTTP, SAP, Citrix, and so
on).
Restricting the scope of the response time breakdown collection improves performance and memory utilization. Enable response time breakdown at as fine-grained a level as possible. Enable response time breakdown at too broad a scope can greatly increase the time spent in areas with a large number of Java. EE interactions. You are prompted to select an existing response time breakdown location or to add a new response time breakdown location.
- To add other response time breakdown locations, click Add on the Advanced page.
- To add a new response time breakdown location, select Add New.
- To add an existing response time breakdown location, select Add Existing.
You have enabled response time breakdown data collection for the specified page elements.
Filtering POJO packages, methods, and classes
You can filter selected plain old Java. object (POJO) packages, methods, and classes from response time breakdown collection.
Create a test or schedule that is enabled for response time breakdown collection.
- Open the location usedd for response time breakdown collection.
- Click the General Properties tab.
- Click Add to create a new property.
- In the New Property window, type RTB_POJO_EXCLUDE for the Property Name.
- In Property Value, type a semicolon-separated list of the POJO packages, methods, and classes to filter. Use an asterisk (*) for a wildcard character. When you run the test again, the POJO methods and classes that you selected are filtered from response time breakdown collection.
Example
Assume that the RTB_POJO_EXCLUDE property has this property value:com.ibm._js*;com.ibm.websphere.samples.plantsbywebspherewar.*;com.ibm.websphere.samples.plantsbywebsphereejb.Util.debug. All packages with names that start with com.ibm._js, the com.ibm.websphere.samples.plantsbywebspherewar package, and the com.ibm.websphere.samples.plantsbywebsphereejb.Util.debug method are excluded from response time breakdown results.Set log and statistic levels
Within a schedule, you set the size and sampling rate of the test log and the problem determination log, as well as the statistics displayed during a run.
Set the statistics displayed during a run
You can set the type of data that you see during a run, the sampling rate for that data, and whether data is collected from all users or a representative sample.
To set the level of statistics logging:
- In the Test Navigator, browse to the schedule and double-click it. The schedule opens.
- In the Schedule Contents area, click the name of the schedule.
- On the Statistics page, set Statistics log level to one of the following options:
Option Description None No statistics are displayed during the run, and any report that depends on statistics is not generated. At the end of the run, you see only a Summary report containing three items: the time the run took, whether the results were on the local computer (or, if a remote location, which one), and the status of the run, which is Complete. Schedule Actions Select this option if you are interested only in the number of users. Schedule actions report the number of active and completed users in the run. Primary Test Actions Select this option to limit the processing required by the workbench. Primary test actions include all schedule actions plus: - For HTTP tests, HTTP page-related actions (attempts, hits, and verification points).
- For SAP tests, SAP screens.
- For Citrix tests, all keyboard and mouse actions.
- For socket tests, this option does not apply.
Secondary Test Actions Select this option to limit the processing required by the workbench. Secondary test actions include all primary test actions plus HTTP page element.related actions. - For HTTP tests, HTTP page element.related actions.
- For SAP tests, SAP screen element.related actions.
- For Citrix tests tests, statistics are identical to Primary Test Actions.
- For socket Send and Receive actions, the exchanged data is also available in the test log, by means of attachments.
All For HTTP, SAP, and Citrix tests, provides statistics for all actions. For socket Send and Receive actions, the exchanged data is also available in the test log, by means of attachments.
- In Statistics sample interval, type a number and select a time unit. When you run a schedule, the reports show such information as response time during a specific interval, the frequency of requests being transferred during an interval, and average response trend during an interval. You set this interval here.
- To set a sampling rate, select Only sample information from a subset of users, then select one of the following options. The number or the percentage that you specify is applied to each user group. If you are running user groups at remote locations, the number or percentage that you select is distributed evenly among the remote locations.
Option Description Fixed number of users The number is applied to each user group. Assume that your schedule contains two user groups. One group contains four users, and one group contains 1000 users. If you specify 2 for this option, two users are sampled from each group. Percentage of users The percentage is applied to each user group.but at least one user will be sampled from each group. Assume that your schedule contains two user groups. One group contains four users, and one group contains 1000 users. If your sampling rate is 10%, one user is sampled from the first group, and 100 users are sampled from the second group. If your sampling rate is 25%, one user is sampled from the first group, and 250 users are sampled from the second group. - Typically, you should select Only store All
Hosts statistics. Selecting this option reduces
the amount of statistical data stored, thus enabling you to test a larger load over a longer period of time with significantly less memory usage. Although you will not be able to analyze data from each computer that adds to your test, this data is generally not of interest.
However, if you are running a test over different WANs.and if you are interested in seeing the data from each remote computer.you should clear this box.
Set the data that the test log collects
The test log shows the events that occurred during a run. By setting the level of information that is collected for a schedule run, you can control whether you receive individual response-time statistics for Page Percentile reports and information about verification points. You can set the level of detail for each type of event: errors, warnings, and other events.
The level of information collection directly affects log sizes. Depending on the setting that you select, the logs can become quite large. By limiting the log level and collecting the information from a representative sample of users, you can decrease your log size and still have sufficient information for analysis.
For example, if you are debugging a test, you might set all three What to Log fields to All or Action Details. These settings produce large test logs, especially if your tests are long or you are running a large number of users. Large test logs, in turn, increase the test log transfer time, and might even cause your computer to run out of disk space or the agent computer to run out of memory. To reduce transfer times and the likelihood of running out of disk space, sample information from a very small subset of users; smaller even than the default of 5 users per user group. A fixed sampling rate samples the same number of vusers from each group. A percentage sampling rate samples a percentage of vusers from each group, but guarantees that at least one user is sampled from a group.
To set the amount of information collected in the test log and the rate of sampling:
- In the Test Navigator, browse to the schedule, and double-click it. The schedule opens.
- In the Schedule Contents area, click the name of the schedule.
- On the Test Log page, select the types of events to collect under What to Log. You can collect errors only, errors and warnings, or all events. In other words, Also show warnings and And also show all other types are unavailable until you select Show errors and failures. Similarly, And also show all other types is unavailable until you select Also show warnings. If none of the What to Log check boxes are selected, no test log events are collected.
- For each type of event, set the Log Level to one of the following options:
Option Description Schedule Actions Collects events that correspond to actions executed in the schedule: - The overall schedule verdict. The verdict can be one of these values:
- Pass indicates that all verification points matched or received the expected response. For example, a response code verification point is set to PASS when the recorded response code is received during playback. If your test does not contain verification points, PASS means that all primary requests in the test were successful.
- Fail indicates that at least one verification point did not match the expected response or that the expected response was not received.
- Error indicates one of the following results: a primary request was not successfully sent to the server, no response was received from the server for a primary request, or the primary request response was incomplete or could not be parsed.
- The start and stop time of the schedule, each user group, each virtual user, and each test invocation.
- The start and stop time of each loop iteration, if loops are set in the schedule.
- The start and stop time of each selector, if selectors are set.
Primary Test Actions Typically, you set data collection at this level. Primary test actions include schedule actions, plus the following actions: - Test verdict, test start, and test stop events.
- Loop iteration start and loop iteration stop events, if loops are present in the test.
- Transaction start and stop events, if transactions are present in the test.
- For HTTP tests, Page title verification points. With this option you can see any page title verification points that you have set.
The following events are collected:
- The page verdict. You see a page verdict only if a connection problem occurs or if you have set verification points. Any failures or errors are rolled up to the test verdict level.
- The start and stop time of each page.
- The start and stop time of each loop, and the number of iterations of each loop, if you have set loops within a page.
- The start and stop time of each transaction, and the duration of each transaction, if you have set page-level transactions in your test.
- For SAP tests, SAP screen information, such as SAP screen title verification points.
- For Citrix tests, connection elements, window events, and image synchronizations
- For socket tests, connect, send, receive, and close elements.
Secondary Test Actions Secondary test actions include primary test actions, plus this information: - For HTTP tests, request-level events. To collect information about response code or response size verification points that you have set,
set data collection at this level of detail or greater.
- The time that the first byte and last byte were sent.
- The time that the first byte and last byte were received.
- The character set of the response data.
- Expected and actual values of page-level verification points that you have defined.
- HTTP think events.
- The start and stop time of each transaction, and the duration of each transaction, if you have set request-level transactions in your test.
- For SAP tests, SAP element information (primarily Set Property or Call Method actions).
- For Citrix tests, synchronization points, delays, text elements, and logoff elements.
- For socket tests, this option does not apply.
Action Details Action details include secondary test actions, plus this information: - For HTTP tests, request and response data; for example, HTTP headers and any request data.
- For SAP tests, think time information.
- For Citrix tests, think time information, mouse actions, and keyboard actions.
- For socket tests, this option does not apply.
All For HTTP, SAP, and Citrix tests, All and Action Details provide the same information. For socket send and receive actions, the exchanged data is also available in the test log, by means of attachments.
- The overall schedule verdict. The verdict can be one of these values:
- To set a sampling rate, select Only sample information from a subset of users. The number or the percentage that you select is applied to each user group. If you are running
user groups at remote locations (that is, on agent computers), the number or percentage that you select is distributed evenly among each location.
Option Description Fixed number of users The number is applied to each user group. Assume that your schedule contains two user groups. One group contains four users, and one group contains 1000 users. If you specify 2 for this option, two users are sampled from each group. Percentage of users The percentage is applied to each user group.but at least one user will be sampled from each group. Assume that your schedule contains two user groups. One group contains four users, and one group contains 1000 users. If your sampling rate is 10%, one user is sampled from the first group, and 100 users are sampled from the second group. If your sampling rate is 25%, one user is sampled from the first group, and 250 users are sampled from the second group.
Example
The default setting, to log all errors and warnings, as well as primary test actions, fits most purposes. However, you can log any type of information, from no information to all information from all users, although neither is a typical situation.
- To see only errors and warnings, set the first twoWhat to Log check boxes to All and clear the third check box, And also show all other types, to avoid logging successful events.
- To check a schedule's structure, when you are not interested in the test execution results, set all three What to Log boxes
to Schedule Actions.
Both choices, as well as the default setting, will limit the size of the test log and reduce the total time to run the schedule by significantly shortening the test log transfer time at the end of a test.
Set the problem determination level
You can set the level of information that is saved in the problem determination log during a run. By default, only warnings and severe errors are logged. Typically, you change this log level only when requested to do so by IBM Software Support.
The problem determination logs contain internal information about the playback engine. These logs are particularly useful for debugging problems such as Kerberos authentication, SSL negotiation, and resource constraints on an agent. The log files are named CommonBaseEvents00.log and are located in the deployment directory. For example, if you play back a schedule on an agent and set C:\Agent as the deployment directory, the problem determination log files are in a directory similar to C:\Agent\deployment_root\rptUser\A1E14699848784C00D2DEB73763646462\CommonBaseEvents00.log. If a large amount of log information is generated, multiple CommonBaseEvents files are created.
To set the level of problem-determination logging and the sampling rate:
- In the Test Navigator, browse to the schedule and double-click it. The schedule opens.
- In the Schedule Contents area, click the name of the schedule.
- On the Problem Determination page, set Problem determination log level to one of the following options:
Option Description All, Finest, Finer, Fine Set these options only if you are requested to do so by technical support. Config Logs static configuration messages. Configuration messages, which include hardware specifications or system profiles, require no corrective action. Info Logs informational messages. Informational messages, which include system state, require no corrective action. Warning Logs warning messages. This is the default setting. Warning messages, which might indicate potential problems, require no corrective action. Severe Logs critical and unrecoverable errors. Critical and unrecoverable messages interrupt normal program execution, and you need to take corrective action. None Turns logging off. - To set a sampling rate, select Only sample information from a subset of users. The number or the percentage that you select is applied to each user group. If you are running
user groups from remote locations, the number or percentage that you select is distributed evenly among the remote locations.
Option Description Fixed number of users The number is applied to each user group. Assume that your schedule contains two user groups. One group contains four users, and one group contains 1000 users. If you specify 2 for this option, two users are sampled from each group. Percentage of users The percentage is applied to each user group.but at least one user will be sampled from each group. Assume that your schedule contains two user groups. One group contains four users, and one group contains 1000 users. If your sampling rate is 10%, one user is sampled from the first group, and 100 users are sampled from the second group. If your sampling rate is 25%, one user is sampled from the first group, and 250 users are sampled from the second group.
When a user group runs on your local computer, the problem determination logs are in the deployment_root directory in your workspace. When a user group runs at a remote location, which is the typical use case, each remote location has a deployment directory, which you define and which is listed on the Locations page for that user group.
Common Base Event XML logs from remote locations use Universal Coordinated Time (UTC), also called Zulu time, which is likely different from your local time. For example, eastern standard time (EST) is 5 hours behind UTC time.
To view the problem determination log, open the log file in an XML editor. Select the log whose timestamp matches the problem run. The most recent log has the suffix 00.log.
Running schedules
After you have added the user groups, tests, and other items to a schedule, and you are satisfied that it represents a realistic workload, you run the schedule.
Running a schedule or test
You can run a test locally with one user or a schedule with a default launch configuration.
- In the Test Navigator, expand the project until you locate the schedule or test.
- Right-click the schedule or test, and then click Run As | Performance Schedule or Run As | Test.
When you run a schedule or test in this way, Rational Test Workbench automatically sets up a simple launch configuration. A test runs on the local computer, with one user. A schedule runs with the user groups and the locations that you have set. However, the execution results have a default name (the same as the schedule or test, with a suffix) and are stored in a default location.
After you run a test or a schedule, the Performance Test Runs view opens. In this view, you can add comments about the selected result and view the settings that were used to run the schedule. To add comments, in the lower left panel of the Performance Test Runs view, click User Comments. The comments that you enter are displayed on the Summary page of performance reports. To view the settings that were used for a schedule run, click Schedule Settings. The Performance Test Runs View Schedule Settings page displays and shows the statistics and test log settings that were used for the run.
You can configure a schedule or test. A typical reason for setting up a configuration is to control where the execution results are stored.
Adjusting delays in HTTP tests
You can configure HTTP tests to use client-side processing delays. Client-side processing delays wait for the first character or last character that is received in a response for a previous request in order to better emulate the work done on the client computer. You can also scale the recorded delays in HTTP tests to change the rate at which a test runs.
Configure HTTP client delays
You can configure delays for HTTP requests to emulate client-side processing delays. Applications that use client-side Javascript, such as Web 2.0 applications, often incur significant delays due to processing done on the client. You can emulate this client-side processing in HTTP tests. Running an HTTP test too quickly can cause unexpectedly low page response times to be reported, and can generate excessive load on the server under test.
To configure HTTP client delays:
- In the Test Navigator, browse to the test and double-click it. The test opens.
- Click the name of the test.
- Click HTTP Options.
- On the HTTP options page, select Enable new client processing delays.
- Under Test Contents, select the request on which to enable client processing delays.
- Under Test Element Details, click the Advanced tab.
- Under Client Processing Delay, click Request. A test editor window opens, listing the previous requests in the test.
- Select the request to wait for, and then click OK.
- For Release when, select First Character Received or Last Character Received.
- Optional: Type any Additional delay to add in milliseconds.
Overriding the HTTP connection timeout value
By default, HTTP page connections use a timeout value of 190 seconds, which might not be sufficient for some applications. You can override the page connection timeout value for specific pages in a test.
To configure the HTTP connection timeout:
- In the Test Navigator view, browse to the test and double-click it. The test opens.
- Under Test Contents, select the request on which to enable client processing delays.
- Under Test Element Details, click the Advanced tab.
- Under Connection Timeout, select Override timeout value and specify the timeout delay.
Playing back HTTP tests faster than the recorded rate
If the client computer used for recording an HTTP test was slower than required, or if you want to emulate a faster client computer, you can increase the playback rate without altering the actual values in the recorded test by reducing the client delays proportionately.
Similarly, you can slow down the client by increasing the client delays.
Each request in a recorded test includes a programmatically
calculated delay before the request is issued. This delay is a statistical
emulation of user behavior. To see a delay in a test, click a request,
and examine the Test Element Details area: 
You can scale the delay in these requests to change the rate that a test runs. This scaling occurs at the test level.
To scale the delays:
- In the Test Navigator, browse to the test and double-click it. The test opens.
- Click the name of the test.
- In the Test Element Details area, select a scaling
percentage. Move the slider to scale the speed at which the HTTP requests are sent. You can specify a range from no delays to twice the recorded length. This scale is applied to all requests in the test.
If you increase playback speed dramatically, requests might occur out of order. To correct this problem, decrease playback speed until the test runs correctly.

You can also set a maximum HTTP delay: Click...
-
Window | Preferences | Test | Test Generation | HTTP Test Generation | Protocol tab
... and enter a value for Maximum Request Delay. Although requests larger than this value are truncated in the generated test, the recorded test still contains the original values.
Set a launch configuration
Instead of using the default launch configuration, you can specify the file name for the execution results, the name of the folder for the execution results, and, for a test, the number of users. You generally run a schedule by right-clicking it and selecting Run | Run Performance Schedule. However, you should set a launch configuration when:
- You want to specify a name for the execution results, or you want them in a separate folder.
- You plan to run a test outside of a schedule, and you want to run the test with more than one user.
- You want the launch configuration to appear in your toolbar menu.
- You want the launch configuration to be available to other users.
To set a launch configuration for a schedule or test:
- In the Test Navigator, expand the project until you locate the schedule or test.
- Right-click the schedule or test, and then click Run | Run. If the Perspectives page is displayed, keep the defaults.
- In the Configurations area on the left, click Performance Schedule, and then click New. A test configuration,
initially named New_configuration, is created. Typically, you supply a configuration name that is similar
to the schedule name.
At this point, you can run the schedule if you click Run. However, you will not have created a meaningful configuration.
- Click the Execution Results tab and type a file name for the execution results (the default is the name of the test or schedule). Performance Tester appends a time stamp to this name. Select Override existing Execution Results resource to overwrite the file each time that you run the configuration.
- If you are setting the configuration for a test that you will run outside a schedule, click the Users tab and enter the number of users to emulate.
- Click the Common tab to inspect or modify your run preferences.
- For Type of launch configuration, select one of the following options:
Option Description Local This launch configuration is stored in your workspace, and it is not visible to other users. Shared Other users have access to the launch configuration; you are asked where to store it. - For Display in favorites menu, select one or more of the following options:
Option Description Run The configuration is displayed in your Run toolbar menu. If you select a toolbar menu at all, this is the logical choice for a schedule or test. Debug The launch configuration is displayed in your Debug toolbar menu. Profile The configuration is displayed in your Profile toolbar menu. - Verify that Launch in background is selected. If you do not run the configuration in the background, you cannot do anything in Eclipse until it finishes running the configuration.
- Click Apply, and then click Run to run the configured schedule or test, or click Close to save the configuration and run it later.
Running a configured schedule
If you do not use the default launch configuration, you can configure the schedule and then run it.
You must configure the schedule before you run it.
- In the Test Navigator, expand the project until you locate the schedule.
- Right-click the schedule, and then click Run | Run.
- In the Configurations area on the left, click Test Schedule, and then click the name of the schedule to run.
- Click Run.
While the schedule is running, the reports are updated in real time, and you can see the changes.
Configure multiple host names for a location
You can run several locations on the same computer by configuring multiple host names for a location. This configuration affects all tests running at that location; all tests will run with the configured port.
To configure multiple host names for a location:
- Open the hosts file, which maps IP addresses to hosts, with an ASCII editor. On Windows, the hosts file is in C:\\Windows\system32\drivers\etc\hosts. On Linux, the hosts file is in \etc\hosts
- At the end of the hosts
file, add your IP mappings. Use one IP address, but map it to two
(or more) logical host names. For example, you could
add map the IP address 123.4.5.6. to two logical hosts, as show in the bottom two lines:
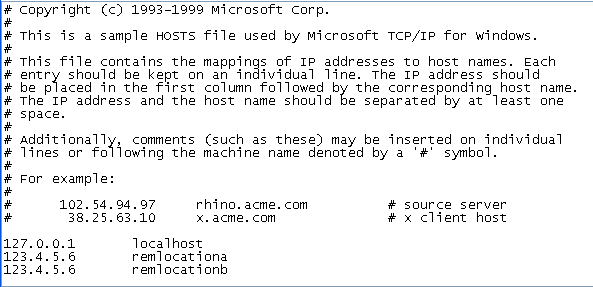
- Create two deployment
locations that have names identical to the names you added in the hosts file:
- Open the schedule containing the user group to run on multiple hosts.
- Open the user group, and click the Location tab.
- Click Add | Add New, and enter the location data. Make
sure the locations have different directories (in this example, they are tempa and tempb).

- Click Finish.
Automating tests
You can run a schedule from the command line. You can also set preferences to export results after the run completes from the command line or from the workbench. Together, these features let you run tests and analyze results without opening the workbench. You can even write scripts to process the exported results.
Running a test or schedule from the command line
You can run a test or schedule from the command line outside of the Eclipse workspace and automatically export the results.
Verify that a supported Java executable file (java.exe) is in your path before you attempt to run a test or schedule from the command line. A supported Java executable file is provided with the product:
- On UNIX operating systems, the executable file is installed by default in the /opt/IBM/SDP/jdk/bin/ directory.
- On Windows operating systems, the executable file is installed by default in the C:\Program Files\IBM\SDP\jdk\bin\ directory.
- On Linux, an X server must be available, even when run from the command line.
- To run a test or schedule from the command line, go to the directory containing the cmdline.bat and cmdline.sh files. On Windows operating systems, this directory is typically C:\\IBM\IBMIMShared\plugins\com.ibm.rational.test.lt.cmdlineexecuteversion_date.
- Issue the following command:
cmdline -workspace workspace_full_path -project proj_rel_path -eclipsehome eclipse_full_path -plugins plugin_full_path -schedule sched_rel_path -suite suite_rel_path -varfile variable_file_full_path -servicename service -serviceargs service_args -configfile file_full_path -results result_file -overwrite {true | false} -quiet -users nn -vmargs JVM_args -exportlog log_full_path -exportstats stats_full_path -exportstatreportlist stats_list -usercomments "any user comment" If a value contains spaces, enclose the value in quotation marks. To see the online help for this command, while you are in the directory containing the .bat file, type cmdline -help.
The following table explains each option:
Option Description -workspace Required. The complete path to the Eclipse workspace. -project Required. The path, including the file name, of the project relative to the workspace. -eclipsehome Required. The complete path to the directory containing eclipse.exe. -plugins Required. The complete path to the folder containing the plug-ins. Typically, on Windows operating systems this folder location is C:\\IBM\IBMIMShared\plugins. -schedule Optional, but you must specify the -schedule option, the -suite option, or the -servicename option. The path including the file name of the schedule to run relative to the project. -suite Optional, but you must specify the -schedule option, the -suite option, or the -servicename option. The path including the file name of the test to run relative to the project. -varfile Optional. The complete path to the XML file containing the variable name and value pairs. -servicename Optional, but you must specify the -schedule option, the -suite option, or the -servicename option. The name of the service to run. Instead of running a performance test, the specified service is run when it becomes available. -serviceargs Optional. The series of arguments to pass to the service specified by the -servicename option. For example, -serviceargs "-myserviceparm1 myserviceparm1value". The values are in quotation marks because they contain spaces. -configfile Optional. The complete path to a file containing the parameters for a test or schedule run. Each parameter must be on a single line. To create a configuration file, use an editor that does not wrap lines. Any parameters, whether required or optional, can be set in the configuration file. Command line parameters override the values in this file. The file must be in the UTF-8 format. Do not use quotation marks in this file, even for values that contain spaces.
-results Optional. The name of the results file. The default result file is the test or schedule name with a time stamp appended. -overwrite Optional. Determines whether a results file with the same name is overwritten. The default value, true, means that the results file is overwritten. -quiet Optional. Turns off any message output from the launcher and returns to the command shell when the run or the attempt is complete. -users Optional. Overrides the default number of vusers in the run. For a schedule, the default is the number of users specified in the schedule editor. For a test, the default is one user. This option creates a new copy of the schedule containing the specified number of users. -vmargs Optional. Java virtual machine arguments to pass in. For example, -vmargs "-debug -Xmx512m". The values are in quotation marks because they contain spaces. -exportlog Optional. The complete path to a file in which to store the exported HTTP test log. -exportstats Optional. The complete path to a directory in which to store exported statistical report data. The statistical report data is stored in comma-separated values (CSV) format, with the file name derived from the report name. If the -exportstatreportlist option is not specified, the reports specified on the Export Reports page of the Performance Test Report preferences are exported. -exportstatreportlist Optional. A comma-separated list of absolute paths to custom report format files (.view files) to use when exporting statistical report data with the -exportstats option. This parameter overrides workspace preferences. For example, -exportstatreportlist c:/customreport.view,c:/customreport2.view. -usercomments This command is available with version 8.5.1 or later. Optional. Add text within double quotation mark to display it in the User Comments row of the report. - Messages are displayed to indicate when the test or schedule is launched and when it is completed, unless you include the -quiet option.
- Issuing the command locks the workspace. To check the progress of the test or schedule during the run, invoke another workspace and open the project through that workspace.
Example
The configuration file must contain information in option=value pairs. Although paths that contain spaces must be enclosed in quotation marks on the command line, do not enclose spaces in quotation marks in the configuration file. A sample configuration file looks as follows:
workspace=D:\My Workspace
eclipsehome=C:\\IBM\SDP
plugins=C:\\IBM\IBMIMShared\plugins
project=myProject
schedule=mySchedule.testsuite
After you run the test or schedule, you may want to export the results.
Export report counters automatically
You can change the test preferences so that report counters are automatically exported at the end of a run. This option is useful when you run a schedule from the command line because you can automatically export results without opening the workbench.
To automatically export report counters to a CSV file when a test or schedule is complete:
- Open the Preferences page: Click...
-
Windows | Preferences
- Open the Export Reports page: In the Preferences window, expand Test and Performance Test Reports, and then select Export Reports.
- In the Export Reports window, select the options as follows:
Option Description Export reports when run completes from Select Command line - Simple CSV format, Command line - Full CSV format, Workbench - Simple CSV format, or Workbench - Full CSV format, or any combination of those. If you select Command line - Simple CSV format, you can also select Print simple CSV reports to command line to display the exported data on the command line (standard output) as well as export it to the CSV file. The file is displayed after the command line run has completed. Include counter details in Simple CSV format Includes the result name, node name, and time range for that data. Typically, you do not include these details unless you are exporting customized reports that include counters from specific test runs. Select reports to export Expand the tree, if necessary, to display the type of report to export. If you select more than one report, each report is exported to a separate CSV file in the Test Runs directory. - Click Apply.
The CSV file is called results_file_name.report_name.csv. It contains metadata about the test run, a blank line, and then lists each counter and its last value. Each counter is on a separate line.
Controlling cache sizes
If you use an infinite loop and the number of cached responses in a test increases exponentially, you can set a limit to cache for a user group in the schedule. When the cache limit is reached, the least-recently accessed cached entry is released to accommodate a new entry. Also, when a test follows another test in the schedule, you can clear the cache before a test starts.
- To clear the cache before a test starts, from the Test Navigator, open a test.
- Click the HTTP Options tab and select the Clear page cache when the test starts check box.
- To set a limit to the number of cache entries, in the Test Navigator, navigate to a schedule and double-click it to open it.
- Click the user group for which you want set the cache limit.
- Click the Options tab and then click Edit Options.
- Select the Set cache size limit check box and, in the Maximum cache size field, type a numeric value. This value indicates the number of entries allowed for a user.
- Click OK and save the schedule.
Increasing memory allocation
The vusers that access your web server require memory to prepare requests, send requests, and receive responses. Because the amount of memory is not automatically set on remote computers, you might receive an out-of-memory error. To correct this situation, increase the memory allocation for that computer.
If you receive an out-of-memory error when you run a test or schedule, override the default amount of memory that is allocated for that computer. To do this, set the RPT_VMARGS property, which overrides RPT_DEFAULT_MEMORY_SIZE. After the first successful execution, IBM Rational Performance Tester automatically sets value for RPT_DEFAULT_MEMORY_SIZE, which represents the maximum heap that will be specified by RPT in subsequent executions.
Ensure there is at least one successful execution after all locations are created so RPT_DEFAULT_MEMORY_SIZE exists.
If you see out-of-memory issues, it is a good practice to first check the javacore* file. You can also look at the results and verify that the server is responding correctly because many times errors can lead to excessive resource consumption. You can also monitor memory usage with Task Manager or other tools at varying user load levels such as 10, 50, 100, 500 or 1000 users and use that data to make an estimate of the memory needs per virtual user and then project memory requirements for larger user loads. In some cases the best solution is to add another agent.
RPT sets heap size for RPT_DEFAULT_MEMORY_SIZE based on the bit-type of the JRE:
- For 32-bit Java Runtime Environment (JREs), RPT sets 70% of the size of physical memory to RPT_DEFAULT_MEMORY_SIZE. Typically, the maximum limit is set to 1200m.
- For 64-bit JREs, some workloads might perform better with a lesser heap size than 70% of physical memory up to a maximum of 12000m.
To increase the memory allocation on a remote computer:
- In the Test Navigator (from your local computer),
expand the project until you find the deployment location to change. Deployment locations are represented by the icon.
- Right-click the deployment location, and then click Open.
- Under Property Groups, click the General Properties link, and then click Add.
- In the New Property window:
- In the Property Name field, type RPT_VMARGS.
- In the Operator field, confirm that the operator is =.
- In the Property Value field, type -Xmxnnnnm, where nnnn is the amount of memory, in megabytes, and then click OK.
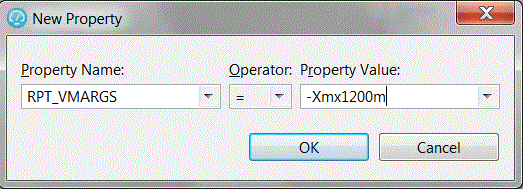
It is a good practice is to monitor memory usage with Task Manager or other tools at varying user load levels such as 10, 50, 100, 500 or 1000 users and use that data to make an estimate of the memory needs per virtual user and then project memory requirements for larger user loads. In some cases the best solution is to add another agent.
If you have increased the available memory and you still receive out-of-memory errors, add more remote computers for your user groups.
Change the number of vusers during a run
If the number of vusers initially defined is incorrect, you can change the number of users. The change can be applied to one stage or to all remaining stages in the schedule.
- Click
 in the Performance Test Runs view, which displays details of the run.
- In the Run Test window, type the number of vusers to add or remove, and then select the scope of the change.
Option Description Add users If a schedule contains only percentage groups, the vusers are added by proportion. Assume that your schedule contains three user groups, assigned at 20%, 30%, and 50%. If you add 10 vusers, two added are to the first group, three are added to the second group, and five are added to the third group. If a schedule contains both absolute and percentage groups, the absolute groups are assigned first. Assume that your schedule has one user group that is fixed at 10 users and only one virtual user is running in that group. You add 100 vusers. Nine vusers are added to the absolute group, and the remaining vusers are apportioned among the percentage groups.
Remove users Users are removed proportionately from user groups according to each user group's percentage value. The time at which users are asked to stop is controlled by the Change rate that you set in the schedule. Apply to all remaining stages Click to apply the change to all remaining stages in the schedule run, and clear to apply the change only to the current stage. - Click Finish.
Releasing vusers from synchronization points
To record the response time of the system under test at different points, you can release vusers either all together or in staggered intervals. You can release vusers from synchronization points during a run.
You must have inserted synchronization points to a test or schedule.
- Open the Performance Test Runs view, which shows the details of the run.
- Click the Display Manage Synchronization Points
Dialog icon
 . A list of the synchronization points in the run opens.
- Click the synchronization points to release, and then click OK.
Typically, the virtual user wait time is based on the time that the last user arrives at the synchronization point. However, if a virtual user arrives after you manually release a synchronization point, the user wait time is instead based on the time at which the synchronization point was released.
Change the stage duration during a run
You can increase or decrease the duration of the current stage during a schedule run.
You can change the duration of a stage that is set to run for a specified time. You cannot change the duration of a stage that is set to run until the work is complete. You can change the duration of a stage when the status is Running. You cannot change the duration of a stage when the status is Ramping or Settle Time.
- In the Performance Test Runs view, click the Change stage duration push button. The Change Stage Duration window opens.
- Type the new stage duration in Run for specified period of time. Type a value that is longer than the amount of time that has elapsed for the current stage. Use the list to change the time units.
- Click OK.
Change the log level during a run
You can change the log level to determine problems during a run. By default, only warnings and severe errors are logged. Typically, you change this level only when requested to do so by IBM Software Support. Although the test log provides general information about problems that occur during a run, you might need to investigate certain problems further by examining a detailed trace of the run. In general, change the problem determination level only when asked to by technical support. However, under certain conditions, you might want to change the problem determination level. For example, if problems occur when a run reaches a certain number of users, you might increase the level to Config, which is the most detailed level that you will generally use
To change the log level during a run:
- Start the run and in the Performance Test Runs view, click the Change Log Level
 icon.
icon.
- To change the log level, select any of the following options:
Option Description All, Finest, Finer, Fine Set these options only if you are requested to do so by technical support. Config Logs static configuration messages. Configuration messages, which include hardware specifications or system profiles, require no corrective action. Info Logs informational messages. Informational messages, which include system state, require no corrective action. Warning Logs warning messages. This is the default setting. Warning messages, which might indicate potential problems, require no corrective action. Severe Logs critical and unrecoverable errors. Critical and unrecoverable messages interrupt normal program execution, and you need to take corrective action. None Turns logging off. - Click Finish.
When a user group runs on your local computer, the problem determination logs are in the deployment_root directory in your workspace. When a user group runs at a remote location, which is the typical use case, each remote location has a deployment directory, which you define and which is listed on the Locations page for that user group.
Common Base Event XML logs from remote locations use Universal Coordinated Time (UTC), also called Zulu time, which is likely different from your local time. For example, eastern standard time (EST) is 5 hours behind UTC time.
To view the problem determination log, open the log file in an XML editor. Select the log whose timestamp matches the problem run. The most recent log has the suffix 00.log.
Interrupting a run
You can stop a test run before it is complete. For example, you might detect serious problems in the run and not want to wait for it to finish. When stopping the test run, you can choose to save the results and the test log of the run.
- During a test run, in the Performance Test Runs view, click
 .
.
- In Timeout, type a number and select a time unit. If you are running HTTP tests and are interested in the results, you might select a duration that is long enough for a page to return.
- Optional: Select Collect Test Results and History to collect the results and the test log, which enable you to run the reports that evaluate the run.
- Optional: Clear the Execute Finally blocks check box to stop the execution of test in the Finally block when the test is stopped manually.
- Click OK.
Change the number of vusers during a run
During a run, you can increase or decrease the number of vusers that was defined in the schedule. You can apply the change to the current stage or to all the remaining stages in the schedule.
You must run a schedule to change the number of vusers.
- In the Test Navigator view, double-click a schedule and click Run from the schedule editor.
- Click Execution Control | Change Number of Users.
- To add users, type the number of users to add. To remove users, click Remove users, and type the number of users to remove.
- If a schedule contains only percentage groups, the vusers are added by proportion. Assume that your schedule contains three user groups, assigned at 20%, 30%, and 50%. If you add 10 vusers, two are added to the first group, three are added to the second group, and five are added to the third group.
- If a schedule contains both absolute and percentage groups, the absolute groups are assigned first. Assume that your schedule has one user group that is fixed at 10 users and only one virtual user is running in that group. You add 100 vusers. Nine vusers are added to the absolute group, and the remaining vusers are apportioned among the percentage groups.
- Users are removed proportionately from user groups according to each user group's percentage value. The time at which users are asked to stop is controlled by the change rate that you set in the schedule.
- Optional: To apply the change to all remaining stages in the schedule run, select the Apply to all remaining stages check box. Clear the check box to apply the change only to the current stage.
- Click OK. To see the number of users executed, check the Summary tab of the performance report.
Change the stage duration during a run
After you specify the user load for different stages in a schedule, you can change the stage duration during a run based on your requirements.
Ensure that a schedule is running. You can change the duration of a stage that is set to run for a specified time; however, you cannot change the duration of a stage that is set to run until the work is complete. You can change the duration of a stage when the status is Running, but you cannot change the duration when the status is Ramping or Settle Time.
- In the Performance Test Run Dashboard, click Execution Control | Change stage duration.
- In the Run for specified period of time field, type the new stage duration. Type a value that is longer than the amount of time that has elapsed for the current stage. Use the list to change the time units.
Releasing vusers from synchronization points
To record the response time of the system under test at different points, you can release vusers either all together or in staggered intervals. You can release vusers from synchronization points during a run.
Add at least one synchronization point to the schedule.
- During a run, click Execution Control | Manage Synchronization Points.
- Select the synchronization points to release, and then click Release.
Change log levels during a run
To view more detailed information about a test or schedule while it is running, you can change the log level. The log level is also set on the Problem Determination tab of the schedule. By default, only warnings and severe errors are logged. Typically, you change this level only when requested to do so by IBM Software Support.
- Run a test or schedule and click Execution control | Change log level.
- To change the log level, select any of the following options:
Option Description All, Finest, Finer, Fine Set these options only if you are requested to do so by technical support. Config Logs static configuration messages. Configuration messages, which include hardware specifications or system profiles, require no corrective action. Info Logs informational messages. Informational messages, which include system state, require no corrective action. Warning Logs warning messages. This is the default setting. Warning messages, which might indicate potential problems, require no corrective action. Severe Logs critical and unrecoverable errors. Critical and unrecoverable messages interrupt normal program execution, and you need to take corrective action. None Turns logging off. - Click OK.
When a user group runs on your local computer, the problem determination logs are in the deployment_root directory in your workspace. When a user group runs at a remote location, which is the typical use case, each remote location has a deployment directory, which you define and which is listed on the Locations page for that user group.
Common Base Event XML logs from remote locations use Universal Coordinated Time (UTC), also called Zulu time, which is likely different from your local time. For example, eastern standard time (EST) is 5 hours behind UTC time.
To view the problem determination log, open the log file in an XML editor. Select the log whose timestamp matches the problem run. The most recent log has the suffix 00.log.
Stopping test runs
You can stop a test run before it is complete. For example, you might detect serious problems in the run and not want to wait for it to finish. When stopping the test run, you can choose to save the results and the test log of the run.
- During a test run, click Execution control | Stop Test Run.
- In the Timeout field, type a number and select a time unit. If you are running HTTP tests and are interested in the results, consider selecting a duration that is long enough for a page to return.
- Optional: To collect the results and the test log until the time the test ran, select the Collect Test Results and History check box. Typically, the partially run report is useful for debugging specific issues. If you do not select the check box, the report is not generated.
- Optional: Clear the Execute Finally blocks check box to stop the execution of the test in the Finally block when the test is stopped manually.
- Click OK.
Debugging HTTP tests
If a test does not behave as expected during playback, you can use the protocol data and test log to assist in debugging the test.
HTTP debugging overview
If a test is not behaving as expected, you can use the Protocol Data view to debug the test. This view can be useful after you record a test, after you make changes to an existing test by adding datapools or data correlation, or after you make changes to the system under test.
The Protocol Data view displays data that was recorded or played back. The Protocol Data view can also display data in real time as tests and schedules run. To see recorded data, click a test element in the test editor. To see data played back after running tests, click an element in the test log. The Protocol Data view updates accordingly. Substituted data is highlighted on the Request, Response Headers and Response Content pages when you view test log or test editor elements that use data correlation. The Protocol Data view contains these pages:
- Request
- This page displays all request data sent to a server. This includes the URL of the requested resource, request headers, cookies, and form data.
- Response Headers
- This page displays the response status line and header fields that are received from a server.
- Response Contents
- This page displays the response contents, in text form, that is received from a server.
- Browser
- This page attempts to display the response contents as a web browser would display the contents. Because the protocol data is used instead of data from a live web server, playback might be successful even though the Browser page might not render the contents exactly as a web browser would. Pages that might not display correctly include those that have resources cached on a web server and those that use Javascript and framesets extensively.
- Event Log
- This page displays event summary information for each HTTP page in the test. After a run, when you select a particular user from the test log, the page displays information about that user.
- During a run, the page displays real-time information if real-time
protocol data support is enabled. To enable this support, click...
-
Window | Preferences | Test | HTTP Protocol Data View | Enable real-time protocol data support
Watching a virtual user during a test run
The Browser page in the Protocol Data view displays browser results during an individual HTTP test run. The Browser page displays each page in real time.
Verify that real-time support is enabled. Click...
-
Window | Preferences | Test | HTTP Protocol Data View
- Verify that Enable real-time protocol data support is selected.
- Select which page you want the Protocol Data view to display by default. The Browser page renders the visual data, and the Event Log page displays a table of page titles, response times, verification point failures, and unexpected response codes. You can switch between the pages when you watch the user.
- In the Test Navigator, browse to an HTTP test and double-click it. The test opens.
- Click Run | Run As | Test.
- In the Protocol Data view, click the Browser tab. The HTTP pages are displayed. Because the protocol data is used, the Browser page might not render the contents exactly as a web browser would render the contents. But even if an HTTP page does not display correctly, you can still use the information on the Request, Response Headers, Response Content, and Event Log pages to help you debug the test.
- Use the playback buttons in the Protocol Data view to control the real-time browser display. The playback buttons control only the Protocol Data view. They do not pause or stop test execution. If you pause the real-time browser display and then click Play, the page displayed in the Browser window is the next page loaded by the playback engine. Use the Back and Forward buttons to control the display of pages that have already been loaded. If a problem occurs during playback, pause the test and use the Back and Forward buttons to move to the page where the problem occurred. The Request, Response Headers, and Response Content pages show the information for the primary request.
The information on each page is updated in real time as you run the test. The Event Log page shows the response time, verification point failures, unexpected response codes, and messages for each request. All of the other pages in the Protocol Data view display an Event Log summary bar while tests are running. The Event Log summary bar shows the number of verification point failures, unexpected response codes, and messages for the current page request.

An unexpected response code is defined as a response code not in the 200 or 300 range. Response codes outside the 200 and 300 range that were recorded or that are represented in a response code verification point are not considered unexpected. For example, a response code of 404, "Not Found," is an unexpected response code, unless there is an associated response code verification point. If a 404 response code occurred while recording and then during playback the response code is also 404, this is not considered unexpected. Messages include data correlation failures and custom code messages.
All pages in the Protocol Data view are active and updated while a test is running. Any of the events in the Event Log summary bar might indicate playback failures that require further investigation. After a test runs, you can also view the test log to debug the test.
Watching a virtual user during a schedule run
During a schedule run, you can select any virtual user and watch that user's real-time browser. Watching the real-time browser lets you investigate the status of individual vusers while they are running. You can determine whether a run is valid despite the occurrence of individual virtual user failures. Watching a virtual user during a run is useful in the following situations:
- It enables you to quickly verify that vusers are receiving the data that you expect. Assume to verify that vusers use different datapool data during a schedule run. You can select a virtual user during the run and see the real-time data for that user. You can then select another virtual user and see that user's data.
- It confirms whether a schedule run is valid despite the occurrence of failures. Assume that you are running a schedule that takes several hours to complete. Intermittent failures occur during the run. To find out whether these failures are significant enough to interrupt the run, you can investigate the activities of vusers that are running at each location (agent computer). You can decide whether to allow the schedule to run to completion.
- It enables you to investigate errors during a run. Assume that you have confirmed that a schedule is running successfully, despite the errors of a few vusers. However, you want to find the specific vusers with verification point failures and see what each virtual user is doing when the failure occurs. To do so, start monitoring different vusers until you find one who is experiencing failures. The Verification Point report is helpful for narrowing down which user groups are experiencing failures. When the virtual user has been identified and monitoring has started, use the Event Log page to see the error details for this user.
To watch a virtual user during a schedule run:
- Run the schedule: Right-click the schedule, and then click Run | Run Schedule.
- In the Protocol Data view, click
 (Watch Virtual User icon).
- In the Select Virtual User to Watch window, select the user group containing the user.
- Select the virtual user number in the user group or at a particular location (agent) on which the user group runs, and click OK.
Option Description Specify a user inside this user group The window lists the ranges of active users in the group. Specify a user number within the listed ranges. This option is useful when you want to watch any user, or a particular user, in a specific user group. This might be the case if you have run the schedule before, examined the test log, and know the number of the virtual user to see.
For example, a schedule that uses a datapool of user names might run correctly for the first 10 users but issue verification point failures for the remaining users. In this case, you watch user number 11.
Indexed user on location Select this option to see a user running at a specific location. Enter an index between 1 and the number of users at that location. This number is mapped to a virtual user number, which is displayed in the title of the Event Log tab. You enter an indexed number rather than a specific user number because not only are the actual user numbers spread out between locations (User 1 might be at Location A, Users 2 and 3 at Location B, and so on) but also a user's location can vary from run to run (User 3 might run on Location A during one run and Location B during the next run).
- In the Protocol Data view, click the Browser tab. Only pages loaded while watching the virtual user are displayed; pages that have been loaded before live rendering began are not available. However, the data that you see is also available in the test log after the run completes. This data is always available, regardless of the test log preferences that you set in the schedule.
- Click an icon for the virtual user.
<
You can even add vusers during the run and watch the added users.Icon Description  (Pause)
 (Play)
 (Back)
 (Forward)
Navigation actions, which let you move among pages.  (Stop Watching)
Stop monitoring the current user. Clicking this icon does not stop the user from running. (Watch Virtual User)
Change from one user to another.
Replaying a virtual user after a run completes
After you create a schedule, run it with a small number of users and watch their activity to verify that the schedule is behaving as expected. You can compare the visual data that is rendered as well as the events that are logged for each user.
- Open the schedule, click the Test Log tab,
and set each Log Level to All. This setting makes sure that the virtual user that you select will have complete test log data.
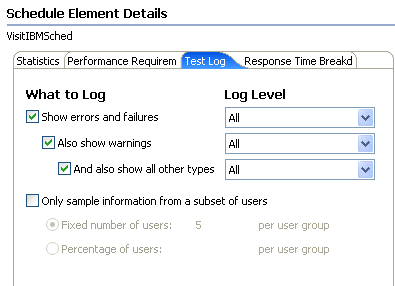
- Verify that the schedule contains a small number of vusers.
- Open the schedule, click the User Load tab and set a small number of users. Setting a small number of users prevents the log from becoming unwieldy, which can occur when the log level is All.
- If you are running a fixed number of users, select each user group and set the numbers so that the total is equal to that in the User Load tab.
- Save the schedule and click Run to run the schedule with the limited number of users.
- After the schedule completes, open the test log: Right-click the schedule run, and select Display test log.
- In the test log, click the Events tab, expand the test log to display the vusers, and select a virtual user to watch.
- In the Protocol Data view, click Replay (
 ). The virtual user's pages, which were loaded
during the run, are redisplayed. Each page pauses the number of seconds
that you set in the Replay Delay preference
(Window | Preferences | Test | HTTP Protocol Data View).
). The virtual user's pages, which were loaded
during the run, are redisplayed. Each page pauses the number of seconds
that you set in the Replay Delay preference
(Window | Preferences | Test | HTTP Protocol Data View).
- To stop replaying, click Stop Replay (
 ).
).
View the playback summary of a virtual user
The Event Log page in the Protocol Data view provides a summary of what happened during an HTTP test run. A complete summary is always available for a test. The information available for a schedule depends on its logging level. The amount of information that you see in the Event Log depends on the amount of information that is collected by the test log. When you run a test, all logging is automatically enabled, therefore the Event Log contains complete details. When you run a schedule, however, you select a Log Level setting, and the amount of detail that the Event Log contains depends on this setting.
If your schedule run is not large, select the setting All for all types of events. For large schedule runs, do not use the All setting, because of the time and space required to transfer large amounts of log detail to your computer after a run is completed. Instead, define a special schedule for debugging tests with the log levels set to All. Limit this schedule to a single test (or a small number of tests) and to a small number of user groups or loop iterations. After you are satisfied that a test is performing correctly, you can move it to a schedule that emulates a realistic workload.
To view the Event Log information:
- In the Test Navigator, open a schedule or test.
- Run the schedule or test: Click Run | Run As, and select Performance Test or Performance Schedule.
- In the Protocol Data view, click the Event Log tab.
- If you are running a test, the Event Log page is immediately populated.
- If you are running a schedule, wait until the run is complete. Right-click on the report and select Display test log. Select a virtual user in the test log. The Event Log page shows the summary of events for that user.
The first column has an arrow to indicate the page that is currently displayed in the other Protocol Data view windows: Request, Response Headers, Response Content, and Browser.
The second column shows the status of the page:
<
Symbol Meaning Green check All requests for the page are successful and that there are no warnings. Red X The page contains requests with failed verdicts or unexpected response codes. Typically, failed verdicts are verification point failures. Unexpected response codes are codes outside the 200 and 300 range that were not recorded as such or that are not represented in associated verification points. Yellow warning symbol The page contains messages but no failure verdicts or unexpected response codes. - Double-click an entry in the Event Log to open the Event Details window. The Event Details window shows a list of events for the page that is highlighted in the Event Log. The Name and Parent columns show the name and parent request for each event. The Text field shows details for each event.

The Go To menu at the top of the Event Details window lets you jump to the corresponding event in the test or the test log. This is useful for obtaining more contextual information about the error shown in the table.
- Leave the Event Details window open, and click other pages in the Event Log, or use the Forward and Back buttons to navigate to other pages in the Event Log. The Event Details window is updated to show the events for the page that is selected in the Event Log.
The information in the Event Details window supplements the information in the test log. To see more information about a particular event, view the test log after the test finishes running. With the test log, you can see an event in context. The test log also provides links to the recorded test.
Inspecting HTTP test logs in the Protocol Data view
To verify that a test is performing as you intend, use the Protocol Data view, which displays the HTML details that were generated during a schedule run. If problems occur in a test run, you can also compare the data retrieved during the run with the recorded data.
Set the detail level. The amount of detail that you can see in the Protocol Data view depends on the Test Log settings in the schedule If you plan to use the Protocol Data view and your schedule run is not large, select the setting All for all types of events. For large schedule runs, do not use the All setting, because of the time and space required to transfer large amounts of log detail to your computer after a run is completed. You might create a special schedule for Protocol Data view runs with the log levels set to All. Limit this schedule to a single test (or a small number of tests) and to a small number of user groups or loop iterations. After you are satisfied that a test is performing correctly, you can move it to a schedule that emulates a realistic workload.
- In the Test Navigator, right-click the results to inspect, and click Display Test Log. The results have the same name as the test or schedule with a time stamp appended.
- In the editing area, click the Protocol Data tab to open the view.
If you cannot locate the Protocol Data tab, click...
-
Window | Show View | Protocol Data
- In the Protocol Data view, click the tab for the type of contents or view to display: Request, Response Headers, Response Contents, or Browser, or Event Log. Substituted data is highlighted on the Request, Response Headers and Response Content pages when you view test log or test editor elements that use data correlation.
- In the Events hierarchy area of the test log, click the line containing the detail to view. The detail is displayed in the Protocol Data view.
User groups, vusers, and some HTTP requests are processed in parallel. The test log reflects the order of execution, rather than the recording order or the order of user groups in schedules. Therefore, the order of page requests in the test might be different from the order in the test log, and the order of user groups in the test log might be different from the order in the schedule. However, the order of pages in a test and the order of tests inside a user group are the same in the test log as in the corresponding test and schedule.
If you have problems during playback, you can compare the data that you recorded with the data retrieved during the run.
Manage HTTP information in the Protocol Data view
Several actions can be performed on the text displayed in the Protocol Data view. You can save the text from the Protocol Data view pages to a text file for use in other applications. You can search for text in the protocol data. You can compare the data retrieved during a run with the recorded data from an HTTP test. Typically, you compare a request or response from the test log to its corresponding data in the recorded test. You can also compare requests or responses from different vusers in one test log.
To export HTTP data from the Protocol Data view to a text file:
- In the Test Navigator, right-click the results to export, and click Display Test Log. The results have the same name as the test or schedule with a timestamp appended.
- In the editing area, click the Protocol Data tab to open the view.
- Click the button that corresponds to the data to export: Request, Request Headers, or Response Content. You cannot export data from the Browser page.
- Optional: To export only a portion of the text,
select the text, and click the appropriate option from the menu:
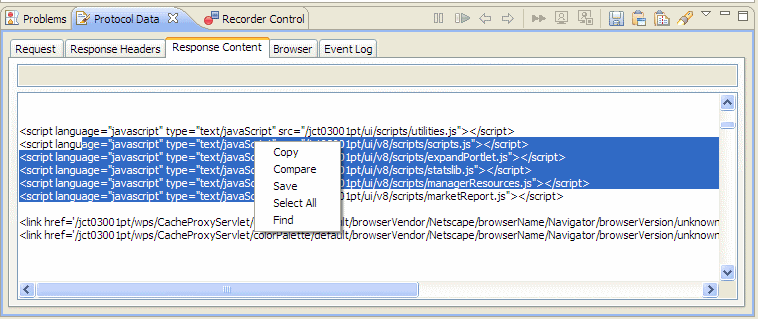
- Select one of the following options from the toolbar:
The text is saved in the default (locale-specific) encoding that is set on your computer. Keep this default locale setting unless your text contains non-Latin characters.Option Description  Save to protocol data
Saves the entire text on the page to a text file within or outside of your workspace.  Copy to clipboard
Copies the entire text on the page to the clipboard.  Compare
to clipboard
Compare
to clipboard
Compares the entire text on the page to the contents of the clipboard. To compare the playback data with the recorded data, view the protocol data in the test log and select Copy to clipboard. Then, use the element link in the details section of the test log to navigate directly to the associated recorded element, and select Compare to clipboard.  Find
Find
Searches the data in that test log page. You cannot replace data in the test log. - Optional: Click the menu on the toolbar
 to save the file in Unicode.
Debugging Citrix tests
The Citrix dashboard is an optional panel that displays detailed information and control commands for each virtual user during the run of a schedule. This is useful for debugging your tests and allows you to pause, interact, resume, or stop the execution of individual virtual user sessions.
Enable the Citrix monitoring panel
With the optional Citrix monitoring panel, you can monitor detailed information during the run of a schedule and debug your tests. To use the Citrix monitoring panel, you must enable it in the schedule.
The Citrix monitoring panel is available only during the run of a schedule. Enable the option requires that you create a location for it in the project.
The Citrix monitoring panel uses resources; therefore use the monitoring panel only for debugging and test development. For actual performance testing, disable the panel.
To enable the Citrix monitoring panel in a schedule:
- Open a schedule containing a user group with at least one Citrix test.
- Select the user group, and on the Schedule Element Details pane, click the Options tab, and then click Edit Options. The Protocol-specific Options window opens.
- If several types of tests are available in the user group, click the Citrix Options tab.
- Select Enable monitoring panel.
- Optional: Select Enable log file generation if you want to keep a log file of the debug session. After the run, you can locate the log file in the file system, in the deployment_root directory of the workspace directory.
- Click OK, and save the schedule.
During the next run of the schedule, the Citrix session window displays the monitoring panel, with which you can debug and control the progress of each virtual tester.
Debugging tests with the Citrix monitoring panel
When enabled, the Citrix monitoring panel provides the ability to pause your tests during a run and to provide manual input. It also provides a comparison view to compare expected window events with the actual window events received during the test. This capability can be useful when you are debugging your tests.
To display the Citrix monitoring panel during performance schedule runs, first enable the panel in the performance schedule.
The Citrix monitoring panel uses resources; therefore, use the panel only for debugging and test development. For actual performance testing, disable the panel so that the results are accurate.
- With the monitoring panel option enabled, run the schedule. A window opens with the vusers running Citrix clients on multiple pages. Click a tab to display the corresponding virtual user.
- Click the Monitoring tab to display
the monitoring panel. The monitoring panel displays the following information:
- Monitoring Panel
- This panel displays information about the execution of each virtual user.
- Pool Name
- Displays the name of the virtual user pool. There is one pool per location and user group.
- Active Virtual Users
- Displays the number of vusers currently active. This value is updated permanently during the run of the schedule.
- User Action Rate
- Displays the number of Citrix user key or mouse actions that were simulated during the last 5 second interval.
- Total Elapsed Time
- Displays the total time elapsed since the start of the schedule run.
- Current Action
- Displays the last user action executed in the test.
- Timeouts
- Displays the number of synchronization timeouts for the virtual user. The color represents the status of the timeout:
- Green: ok.
- Yellow: a timeout occurred on a conditional synchronization.
- Red: a timeout occurred on a mandatory synchronization.
- Elapsed Time
- Displays the time elapsed since the start of the virtual user run.
- Status
- Displays the execution status of the virtual user.
- Select a virtual user and click one of the following buttons to interact with the execution of the test.
- Go To
- Click to display the Citrix session of the selected virtual user.
- Pause or Play
- Click to pause or resume the execution of the selected virtual user. You can also pause the execution by setting breakpoints in the test.
- Step
- When the test is on pause, click to execute each user input action in the test, step by step. To pause test execution, you can either click the Pause button or set breakpoints in the test. Click Play to resume the test.
- Interact
- When the test is on pause, click to allow manual actions in the virtual user session. Use this feature if a test fails to synchronize or gets stuck in an unexpected state. To pause test execution, you can either click the Pause button or set breakpoints in the test. Click Play again to resume the test execution at the point where it was paused.
- Stop
- Click to stop the execution of the selected virtual user. When all vusers are stopped, the schedule ends.
- When you have finished interacting with the Citrix session, click Play to resume the execution.
Set Citrix breakpoints
When the Citrix monitoring panel is enabled, you can define breakpoints in the test to pause the running of a user-input action. This capability is useful when you are debugging a Citrix test.
For the breakpoints to have any effect, the test must be running in a schedule with the Citrix monitoring panel enabled.
Breakpoints can be defined on these user-input test elements: mouse actions, key actions, text inputs, and logoff elements. When a breakpoint is encountered, the test pauses before the user input element is run.
- Open a Citrix test in the test editor and select a user input element.
- In the Test Element Details area, select Stop test execution on this element when the monitoring panel is enabled. Alternatively, you can right-click the user input element, and select Toggle Breakpoint.
- Add the test to a schedule and run the schedule with the monitoring dashboard enabled. During the run, the virtual user pauses at the breakpoint.
- When the test is paused, click Interact to perform manual actions inside the Citrix session or Step to run the test step by step.
- When you have finished, click Play to resume the test run. If there are multiple breakpoints in the test, the run resumes until the next breakpoint is encountered.
RPT logs
Rational Performance Tester uses logs to store different types of information, which you can use to determine the reason for a test failure.
RPT has the following logs:
Test logs
The test log contains a historical record of events that occurred during a test run or a schedule run, as well as the status of each verification point. The test log sets a verdict for each run as follows:
- Pass indicates that all verification points matched or received the expected response. For example, a response code verification point is set to PASS when the recorded response code is received during playback. If your test does not contain verification points, PASS means that all primary requests in the test were successful.
- Fail indicates that at least one verification point did not match the expected response or that the expected response was not received.
- Error indicates one of the following results: a primary request was not successfully sent to the server, no response was received from the server for a primary request, or the primary request response was incomplete or could not be parsed.
- The verdict is set to Inconclusive only if you provide custom code that defines a verdict of Inconclusive.
The test log file is stored in binary format with a .executiondlr file name extension in the project directory of your workspace. You can also view the test log in the user interface.
Problem determination logs
You can set the level of information that is saved in the problem determination log during a run. By default, only warnings and severe errors are logged. Typically, you change this log level only when requested to do so by IBM Software Support.The problem determination logs contain internal information about the playback engine. These logs are particularly useful for debugging problems such as Kerberos authentication, SSL negotiation, and resource constraints on an agent. The log files are named CommonBaseEvents00.log and are located in the deployment directory. For example, if you play back a schedule on an agent and set C:\Agent as the deployment directory, the problem determination log files are in a directory similar to C:\Agent\deployment_root\rptUser\A1E14699848784C00D2DEB73763646462\CommonBaseEvents00.log. If a large amount of log information is generated, multiple CommonBaseEvents files are created.
Agent logs
When you start the load generation agent, a majordomo.log file is created in the %temp% directory on a Microsoft Windows operating system. When you start the Rational Agent Controller, a servicelog.log file is created in the installationDirectory\AgentController\config directory.
These log files contain information about the agent operations. Typically, you use this file when asked to by IBM Software Support.
Error logs
If an error message is displayed when you run tests, try looking up the error message in the Performance testing error messages section of the online help. Only the most common error messages are listed. If no error message is displayed when you encounter a problem, open the error log by clicking Window | Show View | Error Log. If the workbench shuts down while running tests, restart the workbench and examine the error log. By default, warning and error messages are logged. You can increase the default logging level by clicking Window | Preferences | Logging. The log file is stored in the .metadata directory of your workspace.
View reports after a run
Reports are generated and displayed automatically after a run. Each test result begins with the name of the schedule or test, and ends with the timestamp of the run in brackets. In version 8.5.1 or later, for a service test report, you can choose not to generate a report automatically after a run by clicking Window | Preferences | Test | Performance Test Reports | Service Test Reports and clearing the Functional Test Report generation after Test execution.
- In the Test Navigator, expand the project until you locate the run.
- Do either of the following:
- To view the default report, double-click the run. To change the default report, open the Default Report Preferences page: Click...
-
Window | Preferences | Test | Performance Test Reports | Default Report
- To view another report, right-click the test run, click Display
Report, and then select the report to display.
You can also view reports remotely from a web browser.
- To view the default report, double-click the run. To change the default report, open the Default Report Preferences page: Click...
Access reports remotely
Before executing a schedule or test, you can enable an option so that you can access reports remotely from a web browser. After you change a report, the changes are saved to the workspace.
- On the Rational Performance Tester workbench,
click...
-
Windows | Preferences | Test | Performance Test Reports | Web Reports
- To enable remote access to reports, select the Allow remote access from a web browser check box.
- To enable the remote control of schedule execution tasks, select the Allow control of schedule execution from the web browser check box.
- Optional: By default, the non-secure port number for web reports is 8080. If this port number is used by another service, you can type another port number.
- Optional: To provide security for web reports,
select the Security is required to access reports check box.
- By default, the secure port number for web reports is 8443. If this port number is used by another service, you can type another port number.
- Select the User authentication is required to access reports check box and specify the login credentials. You must use the same login credentials to access reports remotely.
- Click OK.
- To access reports remotely, on another computer, open a web browser and type...
-
http://host_name:port_number/RPTWeb/WebAnalytics/
To access a secured report, type...
-
https://host_name:port_number/RPTWeb/WebAnalytics/
...and specify the login credentials if you have set it. The host name is the RPT workbench computer name and the port number is as specified in...
-
Windows | Preferences | Test | Performance Test Reports | Web Reports
Switching report viewers
.If you are unable to install Mozilla Firefox on a Windows 32-bit computer that has Rational Performance Tester workbench, you can either view the web reports remotely from another computer or switch to the earlier style of report viewer (Performance Test Results Viewer) on the Windows 32-bit computer.
- Click...
-
Window | Preferences | General | Editor | File Associations
- In the File types section, click *.trcmxmi.
- In the Associated editors section,
select a report type:
- To use the earlier report viewer click Performance Test Results Viewer.
- To use web reports, click ,Performance Test Run Dashboard.
- Click Default and click OK.
Evaluating results in the Eclipse viewer
To determine the performance of the recorded application, you can evaluate the results that are generated dynamically during a run. After the run too, you can regenerate the results for viewing and analysis.
Comparing results within and among runs
You can create a report that compares different nodes or time ranges within a single run. You can also create a report that compares the results of different runs. To quickly create a report that compares the results of different runs, select the runs in the Test Navigator, right-click, and then select Compare.
To create a more complex comparison, such as comparing results from nodes or time ranges, first select the base run, and then select the runs to compare with the base run:
- In the Test Navigator, right-click the run to serve as the basis for comparison, and click Compare.
- In the Compare results window, click Add. This adds another run to compare with the base run.
- In the Add New Run to Compare window, do the following:
- Expand the Select Run tree and locate the run to add to the report.
- Select a location to compare. The All Hosts location combines the results from all locations. The other locations that are listed are the remote locations where the user groups ran.
- Select a time range to compare. Default Time Range, which is always available, compares the results from the beginning to the end of the run. However, if you have defined time ranges in the run, they are listed as well.
- Click OK.
- Optional: Click Add to add another run, and repeat the previous steps. Use the Up and Down buttons to reorder the results, and Remove to remove the results from the report.
- Select the Automatically abbreviate run names in report to improve readability. The report abbreviates the run names but contains a legend that fully identifies each run.
- Click Finish to create a report in the default report format for the protocol, which is sufficient for most purposes.
- Optional: Click Next to create a report in another report format.
Comparing schedule stages
When you are running a schedule containing stages, time ranges are automatically created for each stage. You can display a report that compares these stages, and you also can set preferences to display the report automatically at the end of a staged run. The Compare report compares the time ranges of each stage. This report provides a quick side-by-side analysis of how the system under test performs under various user loads.
To display a Compare report:
In the Test Navigator, right-click the test results and click Compare All Time Ranges.
Compare All Time Ranges is unavailable if the schedule had only one stage.
Display this report automatically at the completion of a run: Click...
-
Window | Preferences | Test | Performance Test Reports | Launch Compare report when staged run completes
View stage results in real time
When you run a schedule containing stages, you can analyze results for each stage in real time. You can set preferences to control how stage results are displayed in real time.
- Click...
-
Window | Preferences | Test | Performance Test Reports
- Under Staged Run Report Focus Behavior, select one of these options:
Option Description Remain focused on default time range Select this option to view a report for the complete time range instead of for the active stage. You can still manually change focus to any completed stage, and you can view and compare reports for any completed stage. Focus report on active time range Automatically change the report to focus on the active stage. You can view and compare reports for the active stage and for any completed stages. This is the default behavior. Add active time range to a comparison report for all time ranges Automatically add the active stage to a comparison report that also includes results for all completed stages. You can view and compare reports for the active stage and any completed stages. Open a new report on the active time range Automatically open a new report each time a stage begins. You can view and compare reports for the active stage and any completed stages. - Click OK, and then run tests as you would normally.
Generating functional test reports
You can generate functional test reports of your tests, which summarize the pass or fail verdicts of elements in the test log. Functional reports are generated from the test run as HTML files that use predefined report designs.
Before you can generate a functional report, you must successfully run a test or schedule and produce a test run.
The following report types are available:
- Extensible Stylesheet Language Transformation (XSLT) reports: These reports are faster to generate, but do not contain graphs.
- Business Intelligence and Reporting Tools (BIRT) report: These reports contain graphs but are slower to generate. You can customize and create your own BIRT report designs in the Report Design perspective of the workbench. BIRT report generation is not supported when the workbench is running in a VMWare Windows image.
If you use your own XSLT style sheets, verify that the style sheets contain this line: <xsl:param name="languagePack" select="'default'"/>
- In the Test Navigator, select a test run or runs. You can use the Ctrl key to select multiple test runs or schedule runs. You cannot generate a functional report containing more than 5000 calls or objects.
- In the Test Runs view, right-click the test runs and select Generate Functional Test Reports. This opens the Generate HTML Functional Test Report wizard.
- Select the location in the workspace where you want to generate the functional report, and type the Functional report base name. A time stamp and the type of report is appended to this base name when the report is generated. If you want to keep the temporary XML file that is created to generate the report for debugging purposes, select Keep intermediate XML data.
- Click Next.
- Select a predefined report designs or click Add to add a custom BIRT report design or an XSLT style sheet.
- Common Functional Test Report: This produces a generic functional test report for all test protocols.
- SAP Functional Report: This produces a functional test report for SAP tests.
- Services - Failed events: This produces a functional test report for web service tests. The report contains only failed events. Events with other verdicts are not shown in the report.
- Services - Failed tests: This produces a functional test report for web service tests. The report contains only failed tests. Tests with other verdicts or other event types are not shown in the report.
- Services - Full: This produces a functional test report for web service tests. The report contains detailed information on all events.
- Services - Summary: This produces a brief summary functional test report for web service tests.
- Services - Truncated: This produces a functional test report for web service tests. The report contains detailed information on all events, but truncates XML contents after 500 characters.
- Click Finish.
The functional reports are generated as HTML files in the specified location in the workspace.
Customize reports
You can customize reports to specifically investigate a performance problem in more detail than what is provided in the default reports.
Set custom and conditional report colors
Not only can you customize colors in your reports, but you can also make the report colors change when they match a formula that you set.
- In the Test Navigator, expand the project until you locate the run. Each run begins with the name of the schedule or test, and ends with the date of the run in brackets.
- Double-click the run. The default report opens.
- Right-click the graphic to modify, and then click Customize Colors. The Customize Colors window opens.
- Select one of the following:
Option Description Use default palette Click to use the predefined color combinations on the Performance Test Reports preference page (Window | Preferences | Test | Performance Test Reports). Define simple palette Click to define a simple array of colors. The first color is assigned to the first graphic element. The second color is assigned to the second graphic element, and so on. Define conditional palettes Click to define a color that is used when a graphic matches an expression (for example, you can make a bar turn red when its value is >= 1000 ms, or a table cell turn green when its value = "Passed"). - Click OK.
- To apply the palette to all results opened with this report, save the report (File | Save). When you open other results with the saved report, the palette is applied to the result.
You have now assigned custom colors to a report. If you have defined a conditional palette, you can open the report during a run and see it change colors when it satisfies the values that you have set. To return to the default report colors, click...
-
Window | Preferences | Test | Performance Test Reports | Restore Defaults
Change the default appearance of reports
You can change the report default settings for typeface, color, and graph style of reports, and whether a Compare report automatically opens when a staged run ends. You can also display a warning when changing Page Percentile report options will cause data to be lost.
- Click...
-
Window | Preferences | Test | Performance Test Reports | Legacy Reports
- In the Test Reports window, select the options to change:
- Title color
- Click the color button to set the color of the report titles.
- Title font
- Click Change to set the typeface and the size for the report titles.
- Use thin bars on bar chart
- Select to display graph bars that do not touch; clear to display graph bars that touch.
- Use 3D bars on bar chart and pie chart
- Select to display three-dimensional bars.
- Use symbols on line chart
- If your report is long with many data points, you typically clear this box. When there are many data points, the symbols obscure the trends and make the data hard to interpret.
- Time range markers highlight full areas
- Select to apply background highlights to reports.
- Use alternating background on tables
- Select to give every other table row a gray background. The alternating background helps make the tables easy to read.
- Data gradient
- The default of None displays reports in neutral colors, which generally will suit your needs. You can also select a brown, gray, or red-green-blue color scheme. Select 256 color supported only if you have problems with the other data gradients.
- Marker gradient
- When you are modeling a workload over time, select a contrasting color palette for markers to distinguish them from the data gradient that you have selected. Markers separate the time ranges displayed on line charts.
To return to the default appearance of reports, click Restore Defaults.
Customize the appearance of report graphs
You can change the appearance of a table, bar chart, and line chart during the current session. To apply the change to all instances of that report, save the report. You can also change certain defaults.
- In the Test Navigator, expand the project until you locate the run. Each run begins with the name of the schedule or test, and ends with the date of the run in brackets.
- Double-click the run. The default report opens.
- Right-click the graph to modify, and then click Customize. The Graphic Configuration window opens.
- The controls in the Graphic Configuration window differ
depending on the graphic type: bar chart, line chart, or table. For each graphic type, only the applicable controls are displayed. You can adjust the following controls:
Option Description Graphic spans full width Select to force the graphic to use the entire width of the view. Sort labels Select to sort the data alphabetically by label (left to right for charts, top to bottom for tables). X Label Select to edit the default X axis label (line charts only). X Multiplie Select to change the multiplier value for the X axis (line charts only). X Min Select to change the minimum value that is displayed on the X axis (line charts only). X Max Select to change the maximum value that is displayed on the X axis (line charts only). X Sliding Scale Select to see a "window" of data displayed on the X axis. This is useful when viewing results during a test run (line charts only). Display Run Time By default Display Run Time is selected so that the time at the start of the test is displayed as zero. Clear to display time in UNIX epoch format (the number of milliseconds since the UNIX epoch on January 1, 1970; line charts only). Summary Table Select to collapse the table to summary style. Because this removes column headings, this is useful only for tables where the row label completely describes the corresponding values (tables only). Sort Columns Select to sort the columns left to right alphabetically by header label (tables only). Invert Table Rows/Columns Select to swap the columns and rows in the table (tables only). Y Label Select to edit the default Y axis label (charts only). Y Multiplier Select to change the multiplier value for the Y axis (charts only). Y Min Select to change the minimum value that is displayed on the Y axis (charts only). Y Max Select to change the maximum value that is displayed on the Y axis (charts only). Show Legend Clear to disable the chart legend, which matches data labels with the colors or geometric shapes of the displayed data (charts only). Use Symbols Select to display symbols at data points; clear to remove symbols (line charts only). Click... -
Window | Preferences | Test | Performance Test Reports | Use symbols on line chart
Draw Thick Lines Select to display thick graph lines; clear to display thin graph lines (line charts only). Show Time Range Markers Select to display vertical markers between the user load stages of a schedule (line charts only). Show Gridlines Select to display vertical grid lines (line charts only). Use Thin Bars Select to display graph bars that do not touch; clear to display graph bars that touch (bar charts only). Click... -
Window | Preferences | Test | Performance Test Reports | Use thin bars on bar chart
Use 3D Bars Select to enable three-dimensional bars (bar charts only). Click... -
Window | Preferences | Test | Performance Test Reports | Use 3D bars on bar chart and pie chart
Height Select to specify the graphic height in pixels (charts only). Note that if you enter a value that is too small, the graphic might not be displayed at all. Width Select to specify the graphic width in pixels (charts only). Note that if you enter a value that is too small, the graphic might not be displayed at all.
Example
The scope of the change depends on whether you change one report only, save the report, or change the report preferences. Assume to make bar graphs three dimensional:
- To change one bar chart for one session, select the report, click Customize, and select Use 3D Bars.
- To change every instance of a bar chart, select the report, click Customize, select Use 3D Bars, and save the report. For example, if you change the Overall bar chart in the HTTP report and then save it, every Overall bar chart in every HTTP report is changed.
- Click...
-
Window | Preferences | Test | Performance Test Reports | Use 3D bars on bar chart and pie chart
To return to the default appearance of report graphs, click...
-
Window | Preferences | Test | Performance Test Reports | Restore Defaults
Change the report displayed during a run
Use this page to select the default report that opens during a run. Typically, you select Determine default report based on protocols in test, which determines the protocols that you are testing and automatically opens the appropriate protocol-specific reports.
- Open the Default Report Preferences page: Window | Preferences | Test | Performance Test Reports | Default Report.
- In the Default Report window, select Determine default report based on protocols in test or a specific default report to display a customized report or if the default reports do not meet your needs. Note, however, that you will have to change this setting when you record other protocols.
- Click Apply, and then click OK.
Change information in a report
To gather additional information for diagnosing performance problems, you can change the information that appears in a report. You do this by adding or removing report counters. If you save the changes, the report will contain these updates the next time that you generate it.
- In the Test Navigator, expand the project until you locate the run whose information you want to change. Each run begins with the name of the schedule or test, and ends with the date of the run in brackets.
- Double-click the run to display the default report. To display another report, right-click the run, click Display report, and then open the report to change.
- Select the report page to change, right-click the report area, click Add/Remove Performance Counters, and select or clear the counter to change.
- In the counter window, select or clear the counters to display in the report. The report is immediately updated, and if you save the changes upon exiting, the report will contain these updates the next time that you generate it.
Filtering results
By filtering the results displayed in a report, you can remove unnecessary data and focus on the data that is significant to you. If you save the changes, the report will contain these updates the next time that you generate it.
- To apply a filter, do the following:
- In the Test Navigator, double-click the results to filter. The report opens.
- Hover over the graph or report to be filtered, right-click, and then select Apply Filter.
- If you have already applied filters to the results, you most likely want to edit a specific filter. To do so:
- Open the Performance Test Runs view, and expand the tree.
- Select the filter to edit.
- In the Performance Counter Filter window, select one of the following options:
Option Description Filter by count Display the specified number of items. For example, if you select this option and then type 15, the report will show the 15 items with the highest values (Show highest values) or the 15 items with the lowest values (Show lowest values). Filter by value Display items based on a comparison with the specified value. For example, if you select this option and then type 15, the report will show all of the items that are higher than 15 (Show counters above filter values) or lower than 15 (Show counters below filter value). Filter by label Display items that match the specified label. If you are filtering a table, the label is usually a page, and is listed in the left column. If you are filtering a graph, the label is a legend in the graph. - If you are filtering a table by count or value, the Primary counter for table filtering lists the counters in the heading of the table that you are filtering. Select a primary counter. If a value is removed by the primary filter, all other data occupying the same row as the removed value is also removed. This maintains the integrity of the results.
- If you are filtering by label and a report has unlabeled
columns, the Label Index is available to indicate
which column you are filtering.
For example, the following table has two columns: the first for the page name and the second for the page element URL. You would enter a label index of 1 or 2.
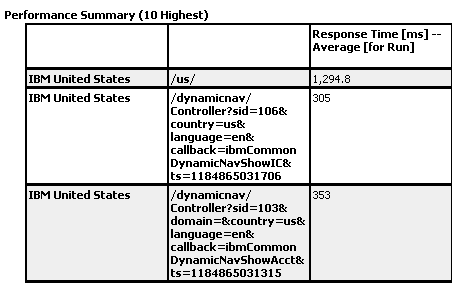
- Click OK. The report is immediately updated, and if you save the changes upon exiting, the report will contain these updates the next time that you generate it.
Reports and graphs that are filtered are marked as filtered, so that you are aware of the filtering when you reopen them.
- To remove a filter, hover over the filtered graphic, right-click, and select Remove All Filters.
- To remove a specific filter, open the Performance Test Runs view, expand the report that has the filter, right-click the filter, and select Delete.
Evaluating results for a specific time range
After you run a schedule, you can further adjust the time ranges in a report. The aggregated results are recomputed to take into account only the data collected during the time range that you specify. To recalculate results for particular start and stop times, you can specify a time range for a report. For example, you can enter custom start and stop times to:
- Filter out data from the ramp-up or ramp-down phases of test runs. This enables you to focus on the time periods when the maximum number of vusers are active.
- Adjust a stage's time range to account for incorrect settle time.
- Focus on time periods when response time exceeds a certain level, regardless of the number of users.
To adjust the time range in a report:
- In the Test Navigator view, expand the project until you locate the run to evaluate. Each run begins with the name of the schedule or test, and ends with the date of the run in brackets.
- Double-click the run to display the default report. To select another report, right-click the run in the Test Navigator, and select Display Report.
- Right-click the graph or table to change. From the pop-up menu, select Change Time Range. The Select Time Range wizard page opens.
- Click New Time Range. This adds a new time range to the list shown under Available Time Ranges.
- Edit the Start Time and End Time entries. Any value between 0.0 and End of run is valid for the Start Time. To automatically select the time range that includes the maximum number of vusers in the test only, click Set to Steady State.
- Click Finish. The current report refreshes, zooming the time axis, to show data only from the specified time range. Aggregate results are recalculated to reflect only data from the selected time range. Also, response time breakdown results are recalculated to reflect only data from the selected time range.
The newly specified time range is stored with the report. To return the report to the complete time range, right-click the report, select Change Time Range and then select Default Time Range from the list of Available Time Ranges.
Create a custom report
In special situations, if the default reports do not meet your needs, you might want to create a custom report.
Before you create a custom report, determine the ways in which your custom report will be different from.or similar to.the system-supplied reports. You can use a system-supplied report as a template and modify it by adding and removing counters. You can also create a report from scratch. The help topic Reference | General reference for performance testing | Reports and counters | protocol_name counters explains the counters for your protocol.
- Click File | New | Test Report.
- In the Name field of the Test Report window, type the name of the new report.
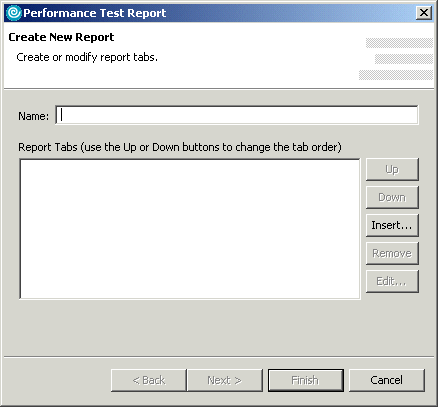
- The Report Tabs list is empty because you are creating a new report (rather than editing a report). Click Insert to enter information about the tab.
- In the Report Tab window, in the Title field, type the name of the new tab.

- Select a tab for an existing report as a template, or select a custom tab based on the general format for your new report:
- The Performance Tab, Summary Tab, Page Throughput Tab, Server Health tabs, and Response vs. Time tabs all are included in the Performance report.
- The Page Element Throughput Tab and the Page Element Summary Tab are included in the Page Element report.
- The Transaction Throughput Tab and the Transaction Summary Tab are included in the Transaction report.
- The Verification Point Summary Tab is included in the Verification Points report.
- The Custom Tab (n graphics) option creates a new tab with the indicated number of graphics. Tables are considered graphics.
- Click Next.
- The number of wizard pages that you see, and the information that they contain, depend on the template you selected. You will see
two wizard pages for each graphic. You select the graphic type (bar
chart, line chart, or table) in the first window. You select the counters
in the second window.
- Type the title of the tab.
- If necessary, change the graphic type. The graphic type selected depends on your template. For example, if you chose Performance Tab, the title of the tab is Performance and the graphic type is Bar Chart, which is the type of chart that the Performance tab displays.

- Click Next. Although you can click Add to filter the report now, it is best to create the report first, and filter the data after you examine the report. You can filter a report by count, by value, or by label.
- The data on this page depends on the graphic type that you selected. For example, Performance report pages contain default performance counters, Summary report pages contain the default summary
counters, and so on.
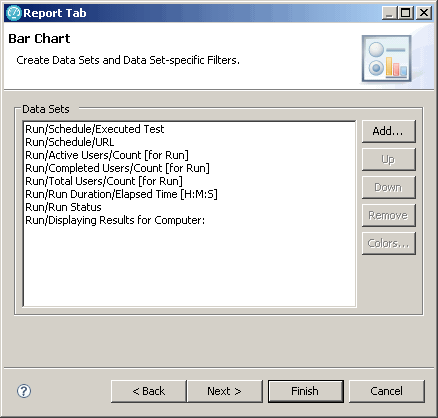
- To add new counters, click the Add button, and select the type of counters to add. The Add/Remove Counters wizard opens for you to select the counters to include in the report. Typically, you add generic counters to a report because the counters are updated each time you regenerate the report. However, you can also create a baseline report with static information.that is, a report where the counters are taken from the same control test run rather than updated with current results. To create a baseline report, do not add the counters now. Instead, add them when the report is displayed by dragging counters from the Performance Test Runs view onto the report.
- If there are multiple graphics, click Next to display the title and graphic type for the next graphic.
- When you are finished selecting the graphics and counters, click Finish.
You can now manage and edit this report just as you do the default reports. When you right-click an item in the Test Runs view, and then click Display Reports, the new report is listed with the system-supplied reports.
Correcting time offset
Response time breakdown and resource monitoring data is time stamped using the system clock of the host computer. If there are differences between the system clocks of the host computers that you include in a test, then response time breakdown and resource monitoring data are skewed in reports. The best practice is to synchronize the system clocks on all computers that you include in a test. When this is not possible, you can correct the time offset of each host computer after a test run. Typically, correct the time offset on all computers to match the system clock of the workbench computer.
After you run tests with resource monitoring or response time breakdown enabled, follow these steps to correct the time offset:
- In the Test Runs view, right-click the host where you want to correct the time offset; then click Correct Time Offset.
- Select a Shift Direction of positive or negative. A positive shift moves the response time breakdown and resource monitoring data on the selected host to the right. A negative shift moves the response time breakdown and resource monitoring data on the selected host to the left.
- Type the hours, minutes, or seconds of the time offset you want to use, and click OK.
The response time breakdown and resource monitoring data on the selected host displays with a corrected time offset.
View resource monitoring data
If you have captured or imported resource monitoring data, you can view this data in reports.
Add resource counters to reports
You can add resource counters to reports in several ways.
First you need to capture or import resource monitoring data.
- Right-click any report, click Add/Remove Performance Counters, and then click Resource Monitoring Counter. The Resource Monitoring Counter menu selection opens the Add/Remove Resource Counters wizard. If you have not captured or imported any resource monitoring data, then no resource counters are available.
- Select the check boxes for the counters to add to the report. If you are adding multiple counters with different ranges of values, you can adjust the scale for better viewing.
- Clear the check boxes for the counters to remove from the report.
- Click Finish. The graph scales automatically to accommodate any added data. Hold your mouse pointer over a resource counter data point to see the exact value of the counter.
Now you can customize the appearance of the report graphs and filter the counters displayed.
Navigating to resource monitoring in reports
You can navigate to resource monitoring data from any page response time graph.
First you need to capture or import resource monitoring data.
To add resource counters to reports, or remove resource counters while viewing reports:
- Right-click any report graphic that displays response time (Page Performance or Response vs. Time), and select Display with Resource Monitoring Data. The graph scales automatically to accommodate the added data. All captured resource monitoring data is displayed in addition to the response time. If you have not captured or imported any resource monitoring data, then no resource counters are available. Hold your mouse pointer over a resource counter data point to see the exact value of the counter.
- To return to the original report, use the navigation information in the upper left corner.
Filtering resource counters
You can filter resource counters the same way you filter other results displayed in reports.
First you need to have successfully run a schedule. To filter resource counters on reports:
- Right-click any report graphic or graph in the Performance Test Runs view then select Apply Filter. This will open the Performance Counter Filter window.
- Select one of the following options:
Option Description Filter by count Display the specified number of items. For example, if you select this option and then type 15, the report will show the 15 items with the highest values (Show highest values) or the 15 items with the lowest values (Show lowest values). Filter by value Display items based on a comparison with the specified value. For example, if you select this option and then type 15, the report will show all of the items that are higher than 15 (Show counters above filter value) or lower than 15 (Show counters below filter value). Filter by label Display items that match the specified label. If you are filtering a table, the label is typically a page, and is listed in the left column. If you are filtering a graph, the label is a legend in the graph.
You can also modify the appearance of the resource counters displayed.
Import resource monitoring data
Because you can collect resource monitoring data in historical mode using IBM Tivoli Monitoring, you can import this data after you have run a schedule.
- Click File | Import, and then open Profiling and Logging, and select Resource Monitoring Data; alternatively, right-click a set of execution results in the Performance Test Runs view, and click Import Resource Monitoring Data from the menu. If you import resource monitoring data into a report using the this method, by default the specified time interval will correspond exactly to the schedule run. Accepting this default might result in no data being available, depending on clock discrepancies between systems. In this case, you might need to adjust the time interval to compensate for clock differences.
- Choose a resource monitoring data source from the list, or click Add to add one. The server must be configured to collect historical data and to collect IBM Tivoli Monitoring resource counters. If you add a new data source, complete these steps:
- Click Create new resource monitoring location to create a new resource monitoring location; or click Create or add a resource monitoring location from an existing source to add an existing location or to create a resource monitoring location based on an existing location.
- Type the IP address or the fully qualified host name of the IBM Tivoli Enterprise Monitoring Server in the Host field on the Tivoli Enterprise Monitoring Server page.
- Type the user ID and password for the monitoring server in Authentication.
- Change the Connection information if needed. Typically, your Tivoli system administrator specifies this information.
- Select Save Password to save your password locally. If you do not save your password, you might be prompted for it (depending on the host system configuration) when editing the configured location or when running test schedules that use the location.
- Specify the time period for which to import data.
When specifying the time in a specific number of units, note that for consistency, "month" is defined as 30 days and "year" is defined as 365 days. "Days" refers to 24 hour periods, not calendar days. The units of time that you select are subtracted from the time that you click Finish to import the data to give the start time. For example, if you select 2 months, the time period will be the 60 days (24-hour time periods) immediately prior to you clicking Finish. If you click Specify a time interval, the Start time and End time will be automatically set to match the run into which you are importing the resource monitoring data.
- Select the Profiling project and Monitor group under which to store the imported data. If you imported the data by clicking File | Import, then you must change the default project and monitor. In this case, specify your test project as the profiling project and the report under which you want to store the data as the monitor; if you do not, the data will not import correctly.
Now you can view resource monitoring data in the report.
View response time breakdown
If you have captured or imported response time breakdown data, you can view this data in reports.
Choose page elements to view
After you have captured response time breakdown data, you can view it from any report graphic containing page or page element response data.
- Right-click any page response graphic (for instance, a bar in a bar chart) to display the pop-up menu.
- Select Display Response Time Breakdown Statistics. The Page Element Selection wizard opens. The primary page element is selected by default.
- Select the page element to analyze, and click Finish to display the response time breakdown report. The response time breakdown report opens.
- To return to the original report, use the navigation information in the upper left corner.
Interpreting response time breakdown statistics
The response time breakdown report shows a table for an aggregation of all instances of a selected page element. Only data that is collected by the data collection infrastructure is displayed. If a computer does not have the data collection infrastructure installed or running, no data is displayed from that computer.
To begin to analyze response time breakdown statistics:
- Choose a simple layout, tree layout, or UML layout by clicking the Layout toolbar button, the first toolbar button in the upper right corner of the view. The tree layout shows the following hierarchy, in order: host, application, component, package, class, and method. The tree layout helps you identify which tier in your enterprise environment has the slowest response time. The simple layout is a flattened version of the tree layout. The simple layout provides a quick and easy way to see the slowest or fastest methods. The UML layout shows a UML sequence diagram of the collected data. The default layout is the simple layout. Click a column heading to sort the table by that column. Drag the columns to change the order in which the columns are displayed. Except for the first column in the tree layout, all of the columns are moveable. Four results are displayed for each object: Base Time, Average Base Time, Cumulative Time, and Calls. All times are in seconds. Base Time is the time spent inside this object, excluding time spent in other objects that the selected object invokes. Average Base Time is the time spent inside this object, excluding time spent in other objects that the selected object invokes, divided by the number of calls. Cumulative Time is the time spent inside this object and in other objects that the selected object invokes. Calls are the number of times the selected object is invoked by any other object. The exact URL of the selected page element is displayed before the table.
- The toolbar in the upper right corner enables you to change the table display and export the results.
- Click Manage Filters, the second toolbar button in the upper right corner, to open the Filters window. There you can add, edit, or remove filters applied to the displayed results.
- Click Select Columns, the third toolbar button in the upper right corner, to open the Select Columns page. There you can select which columns are displayed in the table. These settings are saved with the current workspace, and are applied to all response time breakdown tables in the workspace.
- Click Percent Format, the fourth toolbar button in the upper right corner, to toggle the display between percentages and absolute values.
- Click Open Source, the fifth toolbar button in the upper right corner, to jump to the source code (if available) in your workspace. You must first select a method before clicking Open Source.
- Click Report, the last toolbar button in the upper right corner, to open the New Report window. There you can export the response time breakdown table to comma-separated values (CSV), HTML, or XML formats.
- Use the navigation information in the upper left corner to navigate back to previous views.
View page element responses
You can display the response times for individual page elements in reports, to determine which elements are the slowest. Page element response times do not include client delay or connection time. Because page elements can be returned in parallel from the server under test, the page response time is not necessarily the sum of the page element response times.
- Right-click any page response graphic (for instance, a bar in a bar chart).
- Select Display Page Element Responses. The ten slowest page element response times are listed.
- Right-click the page element to analyze, and select Display Response Time Breakdown Statistics. The response time breakdown report for that page element opens.
- To return to the original report, use the navigation information in the upper-left corner.
View page response time contributions
You can display the response time contributions for individual page elements in reports, to determine how much time each page element contributes to the overall page response time and to determine which page elements are performance bottlenecks. Because page elements can be returned in parallel from the server under test, the page response time is not necessarily the sum of the page element response times. Client delay and connection time also contribute to page response time. The page response time can be greater that the sum of the page element response times if, for example, a lengthy connection time adds a delay. Connection time includes the time required for Domain Name Services (DNS) lookups. Conversely, the page response time can be less than the sum of the page element response times if multiple page elements are returned in parallel.
- Right-click a page response time bar on a Page Performance report.
- Select Display Page Response Time Contributions. The page response time contributions are displayed for the selected page.
- To return to the original report, use the navigation information in the upper-left corner.
View different types of statistics
From the report, you can drill down further into individual host, application, component, package, class, and method response times for a particular page element.
- Right-click any page response graphic (for instance, a bar in a bar chart) to display the pop-up menu. Select Display Page Element Responses. The ten slowest page element response times are displayed.
- Right-click the page element to analyze, and then select Display Host Response Time Breakdown.
- Select from Average Base Time, Base Time, Cumulative Time, Calls. Average Base Time is the time spent inside this object, excluding time spent in other objects that the selected object invokes, divided by the number of calls. Base Time is the time spent inside this object, excluding time spent in other objects that the selected object invokes. Calls are the number of times the selected object was invoked by any other object. Cumulative Time is the time spent inside this object and in other objects that the selected object invokes. The response time breakdown data is displayed.
- Right-click to display the pop-up menu again, then select Display Application Response Time Breakdown.
- Select from Average Base Time, Base Time, Cumulative Time, Calls. The response time breakdown data is displayed.
- Right-click to display the pop-up menu again, then select Display Component Response Time Breakdown.
- Select from Average Base Time, Base Time, Cumulative Time, Calls. The response time breakdown data is displayed.
- Right-click to display the pop-up menu again, then select Display Package Response Time Breakdown.
- Select from Average Base Time, Base Time, Cumulative Time, Calls. The response time breakdown data is displayed.
- Right-click to display the pop-up menu again, then select Display Class Response Time Breakdown.
- Select from Average Base Time, Base Time, Cumulative Time, Calls. The response time breakdown data is displayed.
- Right-click to display the pop-up menu again, then select Display Method Response Time Breakdown.
- Select from Average Base Time, Base Time, Cumulative Time, Calls. The response time breakdown data is displayed.
- To return to previous views, use the navigation information in the upper left corner.
Navigating to resource monitoring data from response time breakdown
You can navigate to resource monitoring data from response time breakdown data to assist in finding performance bottlenecks.
- Right-click an element in a response time breakdown report, or a graphic in a response time breakdown graph (for instance, a bar in a bar chart) to display an options menu. You can navigate from any of the response time breakdown statistics for host, application, component, package, class, or method.
- If you right-click a graphic, select View Resource Usage on this Tier. If you right-click an element in a response time breakdown table, select View Tier Resource Usage. The resource monitoring report for the selected element opens. The chart shows the resource monitoring data and the interval average response time for the selected element. Resource monitoring data is displayed only for the host on which the selected element is located. All other resource monitoring data is filtered.
- To return to the original report, use the navigation information in the upper left corner.
Import response time breakdown data
Because you can collect response time breakdown data in historical mode using IBM Tivoli Monitoring, you can import this data after you have run a schedule. You can import response time breakdown data into a test report or a schedule report.
The monitoring server can be IBM Tivoli Monitoring for Transaction Performance, IBM Tivoli Composite Application Manager for WebSphere , IBM Tivoli Composite Application Manager for Response Time Tracking, or IBM Tivoli Composite Application Manager for Application Diagnostics. When importing response time breakdown data, ensure that the clocks on all computers are synchronized. If you import response time breakdown data from a computer for which the clock was not synchronized, you can use the Correct Time Offset feature in the Performance Test Runs view to adjust the clock skew. Also, ensure that the management server does not truncate the Uniform Resource Identifier (URI) in any transaction names. No response time breakdown data is displayed if the management server truncates URIs in transaction names. If the management server truncates URIs in transaction names, increase the value of the TEXTSTRING_LENGTH property on the management server. Typically you import response time breakdown from a live production environment, rather than a development environment. When you analyze applications in a production environment, the data you are working with is data from past activity that has been stored in a database, which is queried, collected, and imported for analysis.
- Right-click a set of execution results in the Performance Test Runs view, and click Import Response Time Breakdown Data from the menu; alternatively, right-click a report, and click Import Response Time Breakdown Data from the menu.
- Specify the location of the IBM Tivoli Monitoring server:
- Type the IP address or the fully qualified host name of the IBM Tivoli Monitoring server in the Host field.
- Type the user ID and password for the monitoring server in Authentication.
- Change the Connection information if needed. Typically your Tivoli system administrator specifies this information.
- Select Save Password to save your password locally. If you do not save your password, you might be prompted for it (depending on the host system configuration) when editing the configured location or when running test schedules that use the location.
- Click Next.
- Specify the time period for which to import data.
When specifying the time in a specific number of units, note that for consistency, "month" is defined as 30 days and "year" is defined as 365 days. "Days" refer to 24 hour periods, not calendar days. If you click Specify a time interval, the Start time and End time will be automatically set to match the run into which you are importing the response time breakdown data. The selected units of time are subtracted from the time that you click Finish to import the data to give the start time. For example, if you select 2 months, the time period will be the 60 days (24-hour time periods) immediately prior to clicking Finish. Choose Import detailed instance-level data or Import aggregated statistics. You cannot import aggregated statistics from an IBM Tivoli Composite Application Manager for WebSphere server. Attempting to do so will result in an error message.
To import response time breakdown data to correlate with test results, import instance-level data. Instance-level data correlates to an exact transaction URI (in other words, a specific page element). Aggregated statistics do not. The Transactions page of the wizard shows a list of all available transactions. The Transaction Pattern column shows the exact transaction that is recorded. Transactions that contain a regular expression cannot be correlated with a page element. Contact your Tivoli system administrator to ensure that instance-level data is collected for the exact URI used in tests.
- Click Next.
- Specify the policies, or traps, from which to import data. If there are no policies or traps listed, click Back, and then adjust the time period to include an interval where policies or traps are captured. Click Next.
- Select the hosts from which to import data. Here Host refers to a system that is running one or more IBM Tivoli Monitoring agents; then click Next.
- Select the transactions from which to import data, and click Next.
- Select the Profiling project and Monitor group under which to store the imported data. If you imported the data by clicking File | Import, then you must change the default project and monitor. In this case specify your test project as the profiling project and the report under which you want to store the data as the monitor; if you do not, the data will not import correctly.
Now you can view response time breakdown data in the report.
Imposing constraints while importing response time breakdown data
When you import response time breakdown data, impose constraints so that you import only the relevant data. When importing response time breakdown data, you can specify the time interval, policies or traps, hosts, and transactions to import.
- Contact your Tivoli system administrator. The administrator is able to help specify the time of day when the problem arose in the production environment. The administrator can also help specify the policies and transactions that caused the problem.
- Use this information to make the appropriate selections when importing response time breakdown data. IBM Tivoli Monitoring agents can collect gigabytes of data. If you attempt to import all data without specifying any constraints, the workbench might stop responding.
Export data from runs
You can export reports in HTML format for others to view; export an entire run or specific counters to a CSV file for further analysis; or export report metadata (templates) so that other users can generate any custom reports that you have created.
Create executive summaries
You can export information from an entire report, multiple reports, or a single page of a report as an executive summary. An executive summary is a document in rich text format (RTF) containing charts, tables, and basic information about a test run. You can then open the summary in a word-processing program to further format and annotate the data.
- In the Test Navigator view, select the reports, and then right-click and click Create Executive Summary. To export a page of the report, open the report, right-click the page and click Create Executive Summary.
- Select the type of report to export and click Next. This option is available only if you selected reports from the Test Navigator view.
- On the Summary selection page, select the charts and tables to export to the executive summary, and then click Next. The Summary selection page displays the number of selected charts and tables.
- On the Summary destination page, enter a file name and a location for the executive summary. A default file name and location are provided.
- Optional: In Width and Height, enter values to change the size of the exported charts from the default settings.
- Click Finish.
Export reports to HTML format
You can export an entire report, multiple reports, or a single page of a report to HTML format. You can then email the report or post it on a web server. The exported report can be, displayed and printed, from any browser. To further analyze the data, paste the exported report into a spreadsheet program.
- In the Test Navigator view, select one or multiple reports, and then right-click and click Export Report(s) to HTML. To export a page of the report, open the report, right-click the page and click Export To HTML.
- Select the type of report to export and click Next. This option is available only if you selected reports from the Test Navigator view.
- In Specify file path for exported HTML file, select a folder to store the newly created report, and then click Finish. You can set the chart size and file names. Although your current project is the default, you typically create a folder outside of the project to store exported reports.
Export results to a CSV file
To do further analysis on test results, export all statistics captured during a run or specific statistics to a CSV file. To export results of a run:
- Click File | Export.
- In the Export window, expand the Test tree, click Test run statistics, and then click Next.
- Type the name of a CSV file (with the .csv extension), and then click Next.
- Select the run to export, and then click Next. The runs are listed in chronological order, with the most recent run at the bottom of the list.
- Optional: Select the particular statistics to export, and then click Finish.
Export report counters to a CSV file
To perform further analysis on test results, export the report counters to a CSV file. You can change the test preferences to export results automatically.
- In the Test Navigator, double-click the run whose counters you want to export. Each run begins with the name of the schedule or test, and ends with the date of the run in brackets. The Performance Test Runs view opens and displays the details of the selected run.
- In the Performance Test Runs view, expand the All Hosts node, right-click the report whose counters you want to export, and select Export report counters to CSV.
- In the Export Report Counters window, browse to the target CSV file or type its name (with the .csv extension).
- In the Exported encoding field, you typically keep the default (locale-specific encoding) unless the exported CSV file is shared by multiple applications that recognize a specific encoding or by computers in different locales. For example, if the language on your computer is Japanese and you are exporting the file to a computer with English encoding, set Exported encoding to ASCII.
- In Export type, select Full or Simple.
Option Description Full The CSV file will contain all of the values of the counter; that is, the values of each counter for each statistical interval of the run. Select Export overall results to export results from the All Hosts location. Clear this option to export the data from each location, but not the data from All Hosts. Simple The CSV file will contain the last value for each counter. Select Include counter details to include the name of the run, node name, and the time range for each counter. - Click Finish.
To automatically export report counters after a run completes from the command line, Open the Default Report Preferences page...
-
Windows | Preferences | Test | Performance Test Reports | Export Reports
...and select the reports to be exported. The CSV file will contain the last value for each counter in the report.
Export report metadata to a .view file
To share report metadata with another Eclipse user, export it to a .view file. Use this option to share customized report formats with other users. The recipient imports the metadata with Eclipse's Import option and views the report with the Test Navigator.
To export report metadata to a .view file, which is an internal report format:
- Click File | Export.
- In the Export window, expand the Test folder, select Test Report, and then click Next.
- In Save to File, select the file that will contain the report. This file is created if it does not exist.
- In Select Report, select the report format to export, and then click Finish.
To import report metadata from a .view file, select File | Import | Test Report, and browse to the .view file.
To view the imported report, right-click a run in the Test Navigator, click Display Report, and then select the report that was imported.
Evaluating results in the web browser
To determine the performance of the recorded application, you can evaluate the results in a web browser.
The reports are dynamic and easily configurable. You can add multiple counters to a graph. A graph can display up to 500 data points.
Comparing run results
If you have multiple tests with different configurations, you can run the tests and compare the results to identify any problem areas. The compared reports are displayed in the same view, so it is a good practice to name the reports or time ranges appropriately to identify the differences.
- In the Test Navigator view, expand the project and locate a run for the basis of the comparison. Each run begins with the name of the schedule or test, and ends with the date of the run in brackets.
- To view the Data Browser, in the report,
click the Data Browser icon
 .
.
- To add another result for comparison, in the Data Browser view, click the Add another result to focus icon
 , select a result, and click OK.
- Click the time ranges from both the results for comparison
and click one of the following options:
- To compare the default Performance report of the selected time ranges, click the Open Default Report icon
 .
.
- To select a specific report to compare the time ranges, click the Open a report icon
 , select a report, and click OK.
- To compare the default Performance report of the selected time ranges, click the Open Default Report icon
Comparing schedule stages
To analyze the problem area in a specific stage of a schedule, you can compare multiple stages. A stage in a schedule defines the number of users that are loaded and the duration to run. In the report, a stage is displayed as a time range. To select time ranges from all the locations, in the schedule, click Statistics and clear the Only store All Hosts statistics check box.
- In the Test Navigator view, expand the project to locate the run to compare. Each run begins with the name of the schedule or test, and ends with the date of the run in brackets.
- In the report, click the Data Browser icon to view Data Browser.
- In the Data Browser, select the time ranges to compare and click one of the following options:
- To compare the default Performance report of the selected time ranges, click the Open Default Report icon .
- To select a specific report to compare the time ranges, click the Open a report icon , select a report, and click OK.
- To compare the default Performance report of the selected time ranges, click the Open Default Report icon
Customize reports
You can customize reports to specifically investigate a performance problem in more detail than what is provided in the default reports.
You can change the location of the graphs in a report within a tab. On the tab, click the Unlock tab layout for drag-drop
rearrangement  icon and rearrange
the graphs.
icon and rearrange
the graphs.
You can also drag the counters from the Data Browser view to the report. If you have multiple counters in a graph, you can clear the check box of a counter that you do not want to view. You can also move the mouse pointer to the counter legend to highlight the graph.
Set custom and conditional report colors
You can customize the color of reports with or without using an expression. An expression uses a conditional statement to specify a color palette to match the given condition. You can use a condition to highlight a specific performance problem area. For example, if a value drops below 100, you can add a condition to turn the color of the counter to "red".
- In the Test Navigator, expand the project until you locate the run. Each run begins with the name of the schedule or test, and ends with the date of the run in brackets.
- Double-click the run. The default report opens.
- Click the Add/Modify counter icon
 for the graph to customize.
- To customize the color of all counters in the graph, in the Graphic Color Palette field, click the
 icon.
icon.
- Click Use a custom palette. The colors in the palette are applied automatically to each counter. You cannot map a color to a counter. You can add or change a color in the palette.
- Click OK.
- To customize the color palette of a specific counter, in the Counter Details table, in the Colors column for a counter, click the Edit icon .
- Repeat steps 5 and 6.
Manage counters in a graph
To gather additional information for diagnosing performance problems, you can change the counters that appears in a graph. Counters are specific in-built queries that gather statistical information such as the number of page hits, the response time, and user load from the recorded test.
- From the Test Navigator, double-click the run to modify.
- In the graph where you want to add a counter, click the Modify
Graphic Contents icon .
- To add counters, click Add/Remove.
- Select from the available counters, and click OK. The selected counter is listed in the Counter Details table.
- Select a scale and axis for the counter. You can add multiple counters for a graph based on your requirements. To remove a specific counter, select the counter and click Remove.
- Click OK and click Save.
Filtering report results
By filtering the results displayed in a report, you can remove unnecessary data and focus on the data that is significant to you. If you save the changes, the report contains the updates the next time that you generate it. You can filter by the number of counters, the values of counters, or the labels of counters. Use the label filter for all the counters in a graph. The value filter and the count filter is applied only on a single counter. By default, the reports are filtered by using a regular expression to display all counters with labels.
- In the Test Navigator, expand the project until you locate the run. Each run begins with the name of the schedule or test, and ends with the date of the run in brackets.
- Double-click the run. The default report opens.
- Click the Add/Modify counter counter for the graph to apply filters to.
- To apply filters for all the counters in the graph, in the Graphic Label Filter field, click the Edit graphic wide filter icon.
- To filter by the number of counters, click Filter by count and, in the Number to display field, type the number of counters to view and click OK.
- To filter by the values of counters, click Filter by value and, in the Filter Value field, type a value and click OK. You can also select the options to view counters above the filter value, below the filter value, or equal to the filter value.
- To filter by the labels of counters, click Filter b label and, in the Filter Value field, type a label name or a regular expression and click OK. You can include or exclude counters whose label contains a filter value.
- Click OK and then click Save.
- To apply a filter to a specific counter in the graph, in the Counter Details table, in the Filter column,
click the Edit filter icon and follow repeat 4a, 4b, and 4c.
Evaluating results for a specific time range
After you run a schedule, you can adjust the time ranges to include in a report. The aggregated results are recomputed to include only the data that was collected during the time range that you specify. To recalculate results for particular start and stop times, you can specify a time range for a report. For example, you might enter custom start and stop times for these reasons:
- Filter data from the ramp-up or ramp-down phases of test runs to focus on the time periods when the maximum number of vusers are active.
- Adjust a stage's time range to account for incorrect settle time.
- Focus on time periods when response time exceeds a certain level, regardless of the number of users.
- In the Test Navigator view, expand the project until you locate the run to evaluate. Each run begins with the name of the schedule or test, and ends with the date of the run in brackets.
- Double-click the run to display the default report.
- Click to view the Data Browser.
- In the Data Browser view, complete one of the following steps:
- To create a new time range, click the Create or Edit Time Range
 icon and specify a name.
- To edit an existing time range, select the time range
and click the Create or Edit Time Range icon. You cannot edit the default time range.
- To create a new time range, click the Create or Edit Time Range
- In the Time range start field, specify the start time in seconds. A valid start time is any value between 0.0 and end time.
- In the Time range end field, specify the end time in seconds. To make the end of the time range the end of the run, type -1.
- Click OK.
Create custom web reports
If the default reports do not address your needs, you can create a new customized report.
- In the Test Navigator view, double-click a run.
- In the Performance Test Run Dashboard view, click New Custom Report.
- Type a report name and click OK.
- Click the Add a new tab to the report icon .
- In the Add a Tab window, complete one of the following steps:
- To create a new tab, type a name for the tab, select one of the layout options, and choose a report to display on the tab. Click OK.
An empty tab is created. To add a widget to the tab, click the Add icon .
- To reuse a tab from an existing report, click Import a tab from another report as selected below, select an existing report, and click OK.
- To create a new tab, type a name for the tab, select one of the layout options, and choose a report to display on the tab. Click OK.
An empty tab is created. To add a widget to the tab, click the Add icon
- To add counters, click the Modify Graphic Content icon .
- To save the changes, click Save.
Export test results
You can export reports in HTML format for others to view; export an entire run or specific counters to a CSV file for further analysis; or export report metadata (templates) so that other users can generate any custom reports that you have created.
You can also export the web-based charts as image.
Create executive summaries of reports
You can export information from an entire report as an executive summary. An executive summary is a document in rich text format (RTF) containing charts, tables, and basic information about a test run. You can then open the summary in a word processing program to further format and annotate the data.
- To open a report, in the Test Navigator view, double-click a run.
- Complete one of the following steps:
- Click Export Data | Create Executive Summary.
- Right-click a graph and click Create Executive Summary.
- Specify the width and height of the exported chart in pixels and click OK.
- Specify where to save the executive summary.
Export report counters to a CSV file
To perform further analysis on test results, export the report counters to a CSV file. You can change the test preferences to export results automatically.
- In the Test Navigator view, double-click a run with counters to export.
- In the Performance Test Results Improved view, click Export Data | Export Report Counters to CSV.
- In the Exported encoding field, you typically keep the default (locale-specific encoding) unless the exported CSV file is shared by multiple applications that recognize a specific encoding or by computers in different locales. For example, if the language on your computer is Japanese and you are exporting the file to a computer with English encoding, set Exported encoding to ASCII.
- In the Export type section, select Full or Simple based on the following descriptions:
Option Description Full The CSV file contains all the values of the counter; that is, the values of each counter for each statistical interval of the run. Select Export overall results to export results from the All Hosts location. Clear this option to export the data from each location, but not the data from the All Hosts location. Select the Split output if column exceeds check box and type a numerical value. Simple The CSV file contains the last value for each counter. Select the Include counter details in Simple CSV format check box to include the name of the run, node name, and the time range for each counter. - Click OK.
- Specify where to save the file.
Export reports to HTML format
You can export an entire report to HTML format. You can then email the report or post it on a web server. The exported report can be displayed and printed from any web browser. To further analyze the data, paste the exported report into a spreadsheet program.
- To open a report, in the Test Navigator view, double-click a run.
- Complete one of the following steps:
- Click Export Data | Export Chart to HTML.
- Right-click a graph and click Export Chart to HTML.
- Specify the width and height of the exported chart in pixels and click OK.
- Specify where to save the report.
Export charts as images
To use the snapshots of the performance charts in your customized document, you can export the charts as images. IBM Rational Performance Tester supports saving charts as images only in the JPEG format. This feature is supported only for charts such as bar charts, line charts, and pie charts in the web-based report.
- From the Test Navigator, open a report.
- Click the tab containing a chart.
- Click the Save icon
 for the chart to export.
- Specify the location to save.
Test log overview
The test log contains a historical record of events that occurred during a test run or a schedule run, as well as the status of each verification point. The test log sets a verdict for each run as follows:
- Pass indicates that all verification points matched or received the expected response. For example, a response code verification point is set to PASS when the recorded response code is received during playback. If your test does not contain verification points, PASS means that all primary requests in the test were successful.
- Fail indicates that at least one verification point did not match the expected response or that the expected response was not received.
- Error indicates one of the following results: a primary request was not successfully sent to the server, no response was received from the server for a primary request, or the primary request response was incomplete or could not be parsed.
- The verdict is set to Inconclusive only if you provide custom code that defines a verdict of Inconclusive.
View test logs
To see a record of all the events that occurred during a test run or a schedule run, as well as the status of each verification point, open the test log for that run. You can also compare an event from the test log with the request or response in the test to view the differences between the recording and the playback of the test.
The test log file is stored in binary format with a .executiondlr file name extension in the project directory of your workspace. You can also view the test log in the user interface.
- In the Test Navigator view, right-click the executed test; then click Display Test Log.
- On the Overview tab, view the verdict summary for the executed test. To see the potential data correlation errors in a separate view, click Display Potential Data Correlation Errors.
- On the Events tab, view the errors,
failures, and passes for each event in the test.
- To navigate to the verdict type, click the Select the verdict type
 icon.
icon.
- To compare an event or request in the test log with the response or request of the test, right-click an event and click Compare With Test | Request, Compare With Test | Response Data, or Compare With Test | Response Headers. The compare editor highlights the differences.
- To navigate to the verdict type, click the Select the verdict type
- On the Data Correlation tab, see
all the references and substitutions that occurred during a test execution,
as well as the data correlation errors. By default, you view both
references and substituters. To view only substituters, click the Show
References
 icon. To view the correlation data for each virtual user that was executed, click the Merge
Users
icon. To view the correlation data for each virtual user that was executed, click the Merge
Users  icon. This icon is enabled only for a schedule.
In the Data Correlation section, when you click an event, you can see the correlation data in either the Content View
or the Table View.
icon. This icon is enabled only for a schedule.
In the Data Correlation section, when you click an event, you can see the correlation data in either the Content View
or the Table View.
From the test log, you can submit, search, and open defects in a defect tracking system.
View errors while running tests
To view errors and other events while a test is running, use the Execution Event Console view. If problems occur in a test run, you can examine the Execution Event Console view to determine whether to stop or continue the test.
- Open the Execution Event Console view by clicking Window | Show View | Execution Event Console.
- In the Execution Event Console view, click the Filters toolbar button in the upper, right corner. The Event Console Configuration window opens.
- Select the types of messages and verdicts to display in the event console, and then click OK. You can also limit the number of events displayed per user and per run, and you can limit events to specific user groups or agent computers (locations). To configure other settings for the event console, click Settings.
- Run performance tests as you normally do.
- While a test is running, double-click an event in the Execution
Event Console view to open the Event Details window.
- To change the order in which events are listed, click the View Menu toolbar button, and then select Group By.
Export test logs
To process data from a performance test in another application or to use search tools to locate text in a test log, export the test log to a text file.
- In the Test Navigator, right-click the run, and select Export Test Log.
- Optional: To export only a portion of the test log, open the test log by right-clicking the test run and then selecting Display Test Log. Right-click the elements to export, and then select Export Log Element.
The Export Test Log window opens.
- In the Export Test Log window, specify a location for saving the file, and then select options as follows:
Option Description Export format Select default encoding or Unicode encoding. Include event time stamps Select to include event time stamps. Include detailed protocol data Select to include detailed protocol data. This option is available only for HTTP test runs. Include response content Select to include response content. This option is available only for HTTP test runs. Include known binary data Select to export binary data. This option is available only for HTTP test runs. - Click Finish. The test log is exported to a text file.
Export event log
To view all the events that occurred during the run of a test from another file, you can export this data from the Event Log panel, to an XML, CSV, or text file.
You must run a test to view data in the Event Log panel.
- On the Event Log panel toolbar click the View
Menu arrow icon
 and select Export Event Log.
- In the Save dialog box, specify the location and format in which you want to save the events.
Export event console output
To view errors and other events of a test run from another file, you can export this data from the Execution Event Console view to an XML, CSV, or text file.
- Ensure that the Execution Event Console view is open by clicking Window | Show View | Execution Event Console.
- Ensure that the test is run and the Execution Event Console view contains data.
- From the Execution Event Console view toolbar, click the View
Menu arrow icon and select Export.
- In the Save dialog box, specify the location and format in which you want to save the events.
View adjustments to page response times
To see the adjustments to page response times that are measured during a test run or a schedule run, open the test log for that run. Start with Rational Performance Tester Version 8.1.1, HTTP page response times are adjusted for increased accuracy by using advanced techniques to exclude processing time that is not related to the server under test. Other measurements, such as page element response times, are not affected.
- In the Test Navigator, right-click the run, and then click Display Test Log. The test log opens, displaying the Overview page.
- Click the Events tab.
- Expand the elements in the Events hierarchy, and navigate to the page containing the adjustment.
- The last element for an HTTP page is the page stop event. Select the page stop event. Under Extended Properties, the rtaa property is the adjustment to the page response time, in milliseconds, made to exclude processing time that is unrelated to the server under test.
Disable adjustments to page response times
Start with Rational Performance Tester Version 8.1.1, HTTP page response times are adjusted for increased accuracy by using advanced techniques to exclude processing overhead not related to the server under test. To configure the product to use the previous method for calculating page response times, set the RPT_VMARGS property rptPre811PageResponseTimes. Typically, you do not disable adjustments to page response times unless you want to compare results gathered from versions of the product prior to 8.1.1 with results gathered from versions of the product starting with 8.1.1.
- In the Test Navigator, right-click the location on which to disable page response time adjustment.
- Click Open.
- Under Property Groups, click the General Properties link, and then click Add.
- In the New Property window:
- In the Property Name field, type RPT_VMARGS.
- In the Operator field, confirm that the operator is =.
- In the Property Value field, type -DrptPre811PageResponseTimes, and then click OK.
Simulating services with stubs
Service stubs enable you to simulate the behavior of an actual service for a variety testing or integration purposes.
Service stub overview
Service stubs are simulations of an actual service, which can be used to functionally replace the service in a test environment. A stub server replaces the actual application server.
From the point of view of the client application, the service stub looks identical to the actual service that it simulates. To use a service stub in replacement of the actual service, you must be able to replace the URL of the original service in the client application with the URL of the stub server.
Use case examples
There are several cases where it can be useful to deploy a stub services instead of using the actual services for your tests:
- If you are testing a local service that uses data from another remote service, you might need to inject specific content to the service under test from the remote service. You can simulate the remote service with a service stub to ensure that the local service responds properly to some specific input.
- Some commercial services charge users for each call. If you are testing such a service, you can develop and debug your test against a stub service, which is based on the WSDL of the actual service, without being charged by the commercial service.
- During integration of a large application involving multiple clients and services, some services might not yet be operational, although their WSDL specifications are available. You can simulate the missing services with service stubs, which will allow you to proceed with the integration work.
Service stub architecture
Create a service stub by providing an existing WSDL specification. The service stub is generated with the exact same ports and bindings as the original service so that it can be addressed with exactly the same interface. Each operation in the service returns a default response of the type defined by the WSDL.
You can edit the service stub in the stub editor to change the default response or to create conditional responses that simulate the actual responses of the original service.
When you have finished editing the service stub, you can deploy it on a local stub server, which runs in the workbench. The stub server simulates an actual application server and can host multiple service stubs. You control the stub server from the stub monitor view.
Finally, to use the service stub instead of the original service, you change the URL used by the client application to point to the local stub server instead of the original application server. This URL, as well as the WSDL of the service stub, is provided in the stub monitor view.
Remote stub servers
Remote stub servers do not apply to IBM Rational Service Tester for SOA Quality.
For performance testing, you can deploy stub servers on remote computers that are running the Agent Controller on Windows and Linux platforms. This allows you to reduce the load on your local computer or to test various network configurations with multiple stub servers.
You can also deploy stub servers as part of a performance schedule.
Create a service stub
You can use a WSDL (Web Service Description Language) specification file to generate a service stub that can simulate the behavior of the original service and uses the exact same interface.
Service stubs are stored in test projects. If your workspace does not contain a test project, the test creation wizard creates one, enabling you to change its name. To store a service stub in a specific project, verify that the project exists before you create the stub.
If you are using SSL authentication, ensure that you have any required key files in your workspace.
The wizard can import WSDL files from the workspace, the file system, a remote repository, or from a URL. Ensure that the WSDL files use the correct syntax for the test environment. Service stub generation might not work with some Web Services Description Language (WSDL) files.
- In the workbench, click...
-
File | New | Other | Test | Test Assets | Service Test or click the New Service Stub
 toolbar button
- Select the WSDL of the service to simulate. If necessary, you can import the WSDL from the file system, a URL, or a WSRR or UDDI repository.
- Click Next.
- Select a project location and a name for the new service stub. Click Finish.
The wizard generates a working service stub that reproduces the interface of the original service as defined in the WSDL specification. Each operation is reproduced with a default response. You can edit the service stub with the stub editor to change the default response or to create conditional responses.
Edit a service stub
Service stubs are generated with a single default response for each operation in the WSDL specification. You can edit the service stub to change the default responses or to add conditional responses that can simulate the actual service.
To edit the behavior of a service stub:
- In the test navigator, double-click the stub to open the stub editor. Each operation simulated by the stub is represented by an operation element, which contains Case elements that describe a condition. Each case contains a response element. Case elements are similar to test verification points and use the same presentation.
- To change the default response of an operation:
- Expand the operation and the Case : Default element, and then select the response element. The Case : Default element describes the response of the service stub when no other case condition is met.
- Edit the Message content to specify the XML content returned by the service stub.
- To add a conditional response case:
- Right-click the operation and select Add | Equals Case, Contains Case, or Query Case.
These conditional case types are similar to the Equals, Contain and Query verification points in service tests.
- Use Equal Case to specify a response that is returned by the stub when the entire incoming message content fully matches the specified message content.
- Use Contains Case to specify a response that is returned by the service stub when a portion of the incoming message content matches the specified message content.
- Use Query Case to specify a response that is returned by the service stub when an XPath query meets the specified criteria.
The default case cannot be removed and is always the last case element in the operation.
- Select the response element and edit the Message content to specify the XML content returned by the service stub. Use the Form, Tree, and Source views to change the XML content display mode.
- Right-click the operation and select Add | Equals Case, Contains Case, or Query Case.
- Select...
-
File \ Save
...or click the Save toolbar button.
When you have finished editing the service stub, you can deploy the stub to a stub server.
Deploy service stubs
You deploy and run service stubs on a stub server, which is a small application server dedicated to running service stubs. The client application, or test, addresses the stub server instead of the actual application of the original service.
The local stub server runs in the workbench on the local computer. Service stubs can be accessed locally or over the network by client applications or service tests. The local stub server is automatically stopped when you close the workbench.
If you are using IBM Rational Performance Tester, you can deploy stub servers on remote computers that are running the Agent Controller on Linux and Windows platforms. This allows you to reduce the load on your local computer and to set up a dedicated stub server for performance testing. Remote stub servers remain active when the workbench is closed and can be stopped and started manually from the Stub Monitor view.
To use a service stub instead of the original service, you must be able to change the endpoint of the client application or service test to replace the URL of the original application with the URL of the stub server.
- In the stub editor, click the Deploy button. Alternatively, you can right-click the stub in the test navigator and select Deploy On | Local stub server This opens the Stub Monitor view.
- In the Stub Monitor view, click
 Run. If you make any changes to the service stub, the stub is redeployed to the stub server after saving.
- To add more service stubs to the stub server, click Add and select a service stub from the workspace.
- Optional: To deploy a stub server on a remote stub server, in the Stub Monitor view,
click the New Location button and then, create or select a location for the remote stub server. To create a remote location:
- Click New. The Add Location window opens. The first page of the wizard lets you specify general properties for the remote location.
- In Host name, type the IP address or the fully qualified host name of the remote computer.
- In Name, type a descriptive name for the remote computer.
- In Deployment Directory field, type the directory on the remote computer that will store the test assets, for example: C:\tmp. The directory, which will be created if it does not exist, stores the temporary files that are needed during a schedule run.
- In the Operating System field, select the operating system of the remote computer, and then click Next. The second page of the wizard lets you specify the IP aliasing properties for this location.
- To deploy multiple stub servers on a single computer, select Enable IP Aliasing to make it appear as though each stub server has its own IP address.
- Select Use IP addresses from all network interfaces to use IP addresses from all network interfaces at the remote location or select Only use IP addresses from the following network interfaces to use addresses from a subset of network interfaces. Click Add to add the name of an interface and Edit to change the interface name. Specify network interfaces in the form eth0, eth1. If you do not use this form, the connection attempt fails.
- Click Next. The third page of this wizard lets you specify file locations.
- Specify a project directory and a File name to store the information about the new remote location, and then click Finish.
- Copy the URL of the service stub from the Stub Monitor view and paste it into the configuration of the client application. You can also directly access the WSDL specification of the service stub, which is a copy of the original WSDL with replaced URL endpoints.
You can validate that the service stub is responding correctly by using the generic service client to invoke a call.
Add stub servers to a performance schedule
If you are using IBM Rational Performance Tester, you can automate the deployment of stub servers in a performance schedule.
You must have created one or several service stubs.
This topic does not apply to IBM Rational Service Tester for SOA Quality.
To automate stub deployment in a schedule:
- In the Test Navigator, browse to the schedule and double-click it. The schedule opens.
- In the schedule, select the top-level element and click Add | Service Stub Server. The Service Stub Server Location window opens.
- Select an existing remote stub server location or create a new location. To create a remote location:
- Click New. The Add Location window opens. The first page of the wizard lets you specify general properties for the remote location.
- In Host name, type the IP address or the fully qualified host name of the remote computer, for example: localhost.
- In Name, type a descriptive name for the remote computer.
- In Deployment Directory field, type the directory on the remote computer that will store the test assets, for example: C:\tmp. The directory, which will be created if it does not exist, stores the temporary files that are needed during a schedule run.
- In the Operating System field, select the operating system of the remote computer, and then click Next. The second page of the wizard lets you specify the IP aliasing properties for this location.
- To deploy multiple stub servers on a single computer, select Enable IP Aliasing to make it appear as though each stub server has its own IP address.
- Select Use IP addresses from all network interfaces to use IP addresses from all network interfaces at the remote location or select Only use IP addresses from the following network interfaces to use addresses from a subset of network interfaces. Click Add to add the name of an interface and Edit to change the interface name. Specify network interfaces in the form eth0, eth1. If you do not use this form, the connection attempt fails.
- Click Next. The third page of this wizard lets you specify file locations.
- Specify a project directory and a File name to store the information about the new remote location, and then click Finish.
- Click OK. A new service stub server is created in the schedule.
- Select the service stub server and click Add | Service Stub.
- In the Select Stub window, select the stubs to deploy on the server and click OK. To select multiple stubs, press and hold the Control key.
When you run the schedule, the stub servers are deployed at the beginning of the test. When the schedule finishes, stub servers are stopped and removed from the remote locations.
In the schedule, you must ensure that the stub servers have enough time to be correctly deployed before the user groups start running. To do this, select a user group, and click Add | Delay and specify a 30 second delay.
Record service stub activity in a log file
With service stub logging, you can monitor the interactions between an application and the stub server. When the option is enabled, one log file is created for each deployed stub. The log files are presented as a formatted HTML report.
You must have created one or several service stubs.
To log service stub activity:
- Add the following virtual machine (VM) argument to the eclipse.ini file: -DSTUB_LOG_LEVEL=log_level.
Use one of the following values for the log_level variable:
- 0: Disable the log.
- 1: Log stub activity without details.
- 2: Log stub activity including content of sent and received messages.
- 3: Same as level 2 with HTTP headers of received messages.
- 4: Same as level 3 with attached files.
- -DSTUB_LOG_KEEP_PREVIOUS=true: This option creates a separate log file each time the service stub is redeployed. If the value is not true or if the option is not present, the log file is erased if the service stub is redeployed or when the stub server is stopped.
- -DSTUB_LOG_SERIALIZE_XML=true: This option displays the XML content (with log levels 2, 3, and 4) without formatting or indentation. If the value is not true or if the option is not present, the XML content is formatted and indented in the log.
The eclipse.ini file is located in the same directory as the eclipse.exe launcher binary file that is used to run the product. For example, to enable logging with basic content, add the following line to the end of the eclipse.ini file: -DSTUB_LOG_LEVEL=2.
- Restart the workbench, and in the Stub Monitor window, click the Run icon to restart the stub servers.
- If the server was launched by a schedule in the performance testing application, then corresponding logs are automatically created in the workspace. If not, complete the following steps to retrieve the log files from the stub server:
Important: The stub server must be running.
- After running your tests, to view the service stub log files, open the Stub Monitor, and click the tab for the stub server.
- Click the Synchronize toolbar button for the selected server. An HTML log file is created and displayed for each deployed service stub.
Set log level for service stubs
While recording a service test, you can set the level of the log details to collect for debugging purposes.
You must stop the stub server. The log level that you set in this way takes precedence over the log level setting that you specify in the eclipse.ini file.
- In the Stub Monitor view, in the Service Stubs section, click the Edit log options icon
 .
.
- Select one of the log level options and click OK.
Start the server again for the changes to take effect.
Sending service requests with the generic service client
The generic service client enables you to send requests to services for which you do not have a convenient client and to view the responses returned by the service.
Generic service client overview
The purpose of the generic service client is to send requests to any service that uses an HTTP, JMS, WebSphere MQ, or Microsoft .NET transport. The generic service client also displays the response returned by the service.
The generic service client is useful for debugging or testing a service when you do not have access to a dedicated client to send the request. You can set up a large variety of transport and security configurations for the service, edit the parameters of the request and send attachments.
When a request is successfully invoked, its message return is added to the Request History. You can use this feature to look back at results that were produced at different times.
If you are using IBM Rational Performance Tester or IBM Rational Service Tester for SOA Quality, you can select requests in the Request History and click Generate Test to generate a test that will replay all the selected requests. You can edit the test to replace recorded test values with variable test data, or add dynamic data correlation to the test. You can also set verification points on the contents of the XML documents in the service response.
Supported services
The generic service client enables you to send requests for many types of services that use the following transport protocols:
- HTTP
- Java. Message Service (JMS), including JBoss and WebSphere implementations
- WebSphere MQ
- Microsoft .NET Framework Windows Communication Foundation (WCF).
If you are using IBM Security AppScan , only the HTTP transport protocol is supported.
Encryption and security
The Java JRE that the workbench uses must support the level of encryption required by the digital certificate that you select. For example, you cannot use a digital certificate that requires 256-bit encryption with a JRE that supports only 128-bit encryption. By default, the workbench is configured with restricted or limited strength ciphers. To use less restricted encryption algorithms, you must download and apply the unlimited jurisdiction policy files (local_policy.jar and US_export_policy.jar).
You can download unlimited jurisdiction policy files from this site: http://www.ibm.com/developerworks/java/jdk/security/50/
Click on IBM SDK Policy files, and then log in to developerWorks to obtain the unlimited jurisdiction policy files. Before installing these policy files, back up the existing policy files in case you want to restore the original files later. Then overwrite the files in /jre/lib/security/ directory with the unlimited jurisdiction policy files.
SSL Authentication
Service tests support simple or double SSL authentication mechanisms:
-
Simple authentication (server authentication): In this case, the test client needs to determine whether the service can be trusted. You do not need to setup a key store. If you select the Always trust option, you do not need to provide a server certificat key store.
To really authenticate the service, you can configure an certificate trust store, which contains the certificates of trusted services. In this case, the test will expect to receive a valid certificate.
-
Double authentication (client and server authentication): In this case, the service needs to authenticate the test client according to its root authority. You must provide the client certificate keystore that needs to be produced to authenticate the test as a certified client.
When recording a service test through a proxy, the recording proxy sits between the service and the client. In this case, you must configure the SSL settings of the recording proxy to authenticate itself as the actual service to the client (for simple authentication), and as the client to the service (for double authentication). This means that you must supply the recording proxy with the adequate certificates.
When using stub services, you can also configure the SSL settings of the stub service to authenticate itself as the actual server. This means that you must supply the service stub with the adequate certificate.
NTLM and Kerberos Authentication
The product supports Microsoft NT LAN Manager (NTLMv1 and NTLMv2) and Kerberos authentication. The authentication information is recorded as part of the test during the recording phase.
To enable NTLMv2 support, you must add a third party library to the workbench.
Digital certificates
You can test services with digital certificates for both SSL and SOAP security protocol. Digital certificates must be contained in Java Key Store (JKS) keystore resources that are accessible in the workspace. When dealing with keystore files, you must set the password required to access the keys both in the security editor and the test editor. For SOAP security you might have to provide an explicit name for the key and provide a password to access the private keys in the keystore.
If you are deploying tests to agent computers, these files must also be added to the JRE that the IBM Agent Controller uses.
Limitations
Arrays are not supported.
Because of a lack of specification, attachments are not supported with the JMS transport. The envelope is directly sent using UTF-8 encoding.
All security algorithms are not always available for every Java JRE implementation. If a particular security implementation is not available, add the required libraries to the class path of the JRE that this product uses.
The generic service tester displays the envelope as reflected in the XML document. However, security algorithms consider the envelope as a binary. Therefore, you must set up the SOAP security configuration so that incoming and outgoing messages are correctly encrypted but remain decrypted inside the test.
The Microsoft .NET transport protocol does not support transactions, scopes, or duplex mode requests such as callbacks or two-way services based on the MS-MQ transport.
Create an HTTP transport configuration
You can create an HTTP transport configuration that describes the transport settings for a service request. Transport and security settings can be associated with any service request.
If you are using SSL authentication, ensure that you have valid key files in your workspace.
If you are using SOAP security, ensure that you have configured the environment with the correct libraries and configuration files.
- Click the Generic service client
 toolbar button to open the generic service client and click the Transport tab. This opens the Transport Configurations page.
- On the Transport Configurations page, click Create an HTTP configuration (
 ) to create a new HTTP transport configuration.
- Type a Name for the new transport configuration.
- Specify the following options for the HTTP transport:
- Use HTTP Keep Alive
- Select this option to keep the HTTP connection open after the request. This option is not available if you are using IBM Rational AppScan .
- Use SSL
- Select this option to use an SSL configuration. Click Configure SSL to create an SSL configuration or select an existing configuration.
- Platform Authentication
- In this section, specify the type of authentication that is required to access the service. Select None if no authentication is required.
- Basic HTTP authentication
- Select this option to specify the User Name and Password that are used for basic authentication.
- NTLM authentication
- Select this option to use the Microsoft NT LAN Manager (NTLM) authentication protocol. NTLM uses challenge-response authentication. This view lists what is negotiated (supported by the client and requested of the server) and what is authenticated (the client reply to the challenge from the server).
- Kerberos authentication
- Select this option to use the Kerberos authentication protocol between the client and server.
- Connect through proxy server
- If the HTTP connection needs to go through a proxy server or a corporate firewall, specify the Address and Port of the proxy server. If the proxy requires authentication,
select either Basic proxy authentication or NTLM proxy authentication.
- Proxy authentication
- In this section, specify the type of authentication that is required to access the proxy. Select None if no authentication is required.
- Basic proxy authentication
- Select this option to specify the User Name and Password that are used for basic authentication.
- NTLM proxy authentication
- Select this option to use the Microsoft NT LAN Manager (NTLM) authentication protocol. NTLM uses challenge-response authentication. This view lists what is negotiated (supported by the client and requested of the server) and what is authenticated (the client reply to the challenge from the server).
- Custom class
- Select this option if the communication protocol requires complex, low-level processing with a custom Java. code to transform incoming or outgoing messages. Click Browse to select a Java class that uses the corresponding API. This option is not available in IBM Security AppScan.
- Click OK to create the new configuration.
Once created, you can use your new configuration with any service request that uses the HTTP transport protocol. You can use the Configurations list in the generic service client to edit existing configurations or to create duplicate configurations.
Create a JMS transport configuration
You can create an JMS transport configuration that describes the transport settings for a service request that uses the Java. Message Service (JMS) protocol, including JBoss and IBM WebSphere JMS. Transport and security settings can be associated with any service request.
If you are using SOAP security, ensure that you have configured the environment with the correct libraries and configuration files.
- Click the Generic service client toolbar button to open the generic service client and click the Transport tab. This opens the Transport Configurations page.
- On the Transport Configurations page, click one of the following buttons:
- Create a basic JMS configuration (
 ) to create a new generic JMS
transport configuration.
) to create a new generic JMS
transport configuration.
- Create a JBoss JMS configuration (
 ) to create a JMS
configuration preconfigured for JBoss.
) to create a JMS
configuration preconfigured for JBoss.
- Create a WebSphere JMS configuration (
 ) to create a JMS configuration preconfigured for WebSphere JMS.
- Create a basic JMS configuration (
- Type a Name for the new transport configuration and select whether the service is a queue or a topic destination.
- Type the address of the JMS end point.
- Select Use temporary object to provide the address of the reception point to the service as a temporary object. If you disable this setting, you must manually specify the reception point address.
- If the service requires authentication, select Basic Authentication and type the user name and password to access the service.
- If the service requires a custom Java Naming and Directory Interface (JNDI) adapter, you can provide your own Java class that extends the Apache Axis class. In this case, select Custom Adapter and specify the name of the custom Java class.
- Specify whether the message type is Text or Binary.
- If necessary, click Add or Edit to specify the Context factory properties or Connector properties required to access the service.
- Click OK to create the new configuration.
Once created, you can use your new configuration with any service request that uses the JMS transport protocol. You can use the Configurations list in the generic service client to edit existing configurations or to create duplicate configurations.
Create a WebSphere MQ transport configuration
You can create a transport configuration that describes the transport settings for a service request that uses the IBM WebSphere MQ protocol. Transport and security settings can be associated with any service request.
If you are using SOAP security, ensure that you have configured the environment with the correct libraries and configuration files.
- Click the Generic service client toolbar button to open the generic service client and click the Transport tab. This opens the Transport Configurations page.
- On the Transport Configurations page, click Create a WebSphere MQ configuration (
 ) to create a new generic MQ transport configuration.
- Type a Name for the new transport configuration and select whether the service is a queue or a topic destination.
- Specify the Queue Manager Name for the queue manager that will receive the call, and the Queue Name for the queue managed by the queue manager.
- If the WebSphere MQ server is running on the local computer, select Local Queue Manager. If not, specify the Address, Port, and Client Channel for the remote WebSphere MQ server.
- The server to create a temporary queue for receiving messages, select Use Temporary Queue for Response. If not, specify the queue (handled by the specified queue manager) that will receive responses from the WebSphere MQ server.
- If you are using the Microsoft .NET framework with SOAP over MQ, specify the name of the target service.
- If you are using SOAP over MQ, select Use RFH2 header. Otherwise, specify the Message Descriptor and Encoding options for the message header.
- If the service requires SSL authentication, click SSL Connection to select an existing SSL configuration or to create a new one.
- Click OK to create the new configuration.
Once created, you can use your new configuration with any service request that uses the WebSphere MQ transport protocol. You can use the Configurations list in the generic service client to edit existing configurations or to create duplicate configurations.
Create Microsoft .NET transport configurations
You can manually create a Microsoft .NET transport configuration to describe the transport settings for service requests that use the Windows Communication Foundation (WCF) protocol.
If you are using SOAP security, ensure that the environment is configured with the correct libraries and configuration files.
Certificates and libraries required by the Microsoft client proxy must be installed on the computer, including Microsoft .NET libraries.
You must link a modified version of the Microsoft client proxy configuration file of the WCF service (by default client.exe.config) to the Microsoft .NET transport configuration. You must rename the file to soaclient.exe.config and edit it as described in the following procedure.
You can create a Microsoft .NET transport configuration automatically by importing the Microsoft .NET WSDL file. In this case, you must still manually edit the Microsoft .NET transport configuration to point to the modified soaclient.exe.config file as described in the following procedure. The product supports testing WCF services that use the following bindings:
- BasicHttpBinding
- WsHttpBinding
- NetMsMqBinding for 1-way calls only
- WSFederationHttpBinding
- WS2007FederationHttpBinding
- NetTcpBinding
- Custom bindings that do not integrate custom extensions in the channel, serialization of the message, transport, and security
The following WCF services are not supported:
- Transaction and scopes
- Duplex mode requests, such as callbacks or 2-way services based on the Microsoft Message Queuing (MS-MQ) transport
- Create a modified soaclient.exe.config file by completing the following steps:
- Create a copy of client.exe.config (or proxy_client_name.config) file from the Microsoft .NET project and rename the copy to soaclient.exe.config.
- Edit the soaclient.exe.config file to use the version of Microsoft .NET that the product supports, as specified on the following line:
<supportedRuntime version="v4.0" sku=".NETFramework,Version=v4.0"/>
- Edit the soaclient.exe.config file so that the endpoints in the configuration file point to the client contract of the product, as specified on the following line:
contract="IBM.ServiceModel.Soa.Extension.Stub.IStubTest"
- Import the modified soaclient.exe.config file into the workspace.
- Click the Generic service client toolbar button () to open the generic service client and click the Transport tab.
- On the Transport Configurations page, click Create a Microsoft .NET configuration.
- Type a name for the new transport configuration and specify the following options:
- Location of soaclient.exe.config
- Specify the location of the soaclient.exe.config file. You must create this file manually by copying and editing the client.exe.config file from the Microsoft .NET service.
- User authentication
- If the service requires authentication, select User Authentication and type the user name and password to access the service.
- Endpoint protection
- By default, the transport configuration uses the endpoint protection
level that is described in the soaclient.exe.config file. Use this setting to specify a different Protection
level:
- Signature: Digitally sign requests.
- Encryption and Signature: Select this option to digitally sign and encrypt requests.
- Advanced properties
- Use this table to list the request and response actions by order of the methods in the WSDL file. Click Add to specify the name and value of request and response actions required by the service. This table is generated automatically when you import a Microsoft .NET WSDL file.
- Click OK to create the transport configuration.
After you create the configuration, you can use it with any service call that uses the Microsoft .NET transport protocol. You can use the Configurations list in the generic service client to edit existing configurations or to create duplicate configurations.
Create SSL configurations
You can create a SSL configuration that describes the settings for a service request that uses SSL certification mechanisms. SSL configurations can be associated with any service request that uses the HTTP or IBM WebSphere MQ transport protocols.
If you are using SSL, ensure that you have valid certificate keystore files in your workspace.
If you are using SOAP security, ensure that you have configured the environment with the correct libraries and configuration files.
- Click the Generic service client toolbar push button to open the generic service client, and click the Transport tab.
- Either open an existing HTTP or WebSphere MQ transport configuration, or create a new one, and then click Open SSL Editor.
- Click Rename
 to rename the default SSL configuration or New
  to create one.
- Specify the following settings for the SSL configuration.
- Server Authentication
- This section describes how the client trusts the server.
- Always trust server
- Select this option if no authentication is required or to ignore server certificates so that all servers are trusted. If you are using single authentication and you want to accept trusted servers only, then disable this option and specify a truststore containing the trusted server certificates.
- Client truststore
- When you are using single authentication, the client truststore contains the certificates of all trusted servers. Click Browse to specify a KS, JKS, or JCEKS file containing valid certificates of the trusted servers.
- Password
- If the client truststore file is encrypted, type the password required to access the file.
- Mutual Authentication
- This section describes how the server trusts the client in addition to server authentication.
- Use client-side certificate
- If you are using double authentication, select this option to specify a keystore containing the client certificate. This certificate allows the server to authenticate the client.
- Client certificate keystore
- Click Browse to specify a KS, JKS, or JCEKS file containing a valid certificate that authenticates the client.
- Password
- If the client truststore file is encrypted, type the password required to access the file.
You can copy the contents from an SSL configuration into another SSL configuration by using Copy
 and Paste
  in the SSL editor.
- Click OK to create the configuration, and close the SSL editor.
When the SSL configuration is created, you can use the SSL configuration with any service request that uses SSL certification. You can use the SSL editor to edit existing configurations.
Sending service requests with WSDL files
You can send requests to services based on SOAP, Java Messaging Service (JMS), WebSphere MQ, and Microsoft .NET that use a WSDL file to specify the contents of the service request.
Ensure that you have a valid WSDL file, which is accessible either on the file system, in the workspace, at a specific URL, or in an IBM WebSphere Service Registry and Repository or a Universal Description Discovery and Integration (UDDI) repository.
Ensure that the WSDL files use the correct syntax for the test environment. The generic service client might not work with some WSDL files.
If the service uses SSL authentication, create an SSL configuration before sending the request.
If the service uses SOAP security for encryption, signature, or other security algorithms, you must first configure the environment with the correct libraries and configuration files, and then create a WSDL security profile.
To import a WSDL file from a secured site that requires mutual authentication, you must have the Keystore file in the workspace. When you create a call from a WSDL file, the call is configured automatically with any SOAP, JMS, WebSphere MQ, or Microsoft .NET endpoints that are available in the WSDL file. Select the corresponding transport configuration on the Transport page of the request.
To send a service request based on a WSDL file:
- Click the Open the Generic Service Client toolbar button and select the Requests page.
- Click Add
 and select the method to import a WSDL file or click the corresponding shortcut button on the main page.
- Click Import from File to import a WSDL file from the file system.
- Click Import from URL to download and import an online WSDL from the web.
- Click Import from WSRR to import a WSDL from WebSphere Service Registry and Repository.
Enter the URL of the WebSphere Service Registry and Repository and click Connect. You can click Search
 to browse the contents of the repository.
- Click Import from UDDI to import a WSDL from a Universal Description Discovery and Integration (UDDI)
repository. Enter the URL of the UDDI and click Connect.
You can click Filter
 and Search to browse the contents of the repository.
If you are importing the WSDL file from a secured site that requires certificate authentication, click Import Properties and, for Keystore, select the keystore file containing the certificate to be provided to the server, and for the Keystore password, type the password.
- Click OK. The WSDL file is added to the Request Library.
- In the Request Library, expand the WSDL file, binding, and operation, and then select the call element. The generic service client shows three steps: Edit Data, Invoke and View Response. The details for the call are displayed under the Edit Data step.
- On the Message page, use the Form, Tree, or Source views to edit the contents of the request. Each view shows a different format of the same data. To add or remove XML elements in the Form or Tree view, click Schema | Validate and Assist to comply with an XML Schema Definition (XSD) specified in the schema catalog.
- On the Attachments page, specify any file attachments that are sent with the request. The environment must be configured with the correct libraries and configuration files to handle file attachments.
- On the Transport page, specify whether to use an HTTP, JMS, WebSphere MQ,
or Microsoft .NET transport configuration for the request. The transport information from the WSDL file is imported automatically into the transport configuration.
For Microsoft .NET, select the corresponding transport configuration and specify the location of the soaclient.exe.config file. You must create this file manually.
If you are using IBM Security AppScan , only the HTTP transport protocol is available.
- On the Request Stack page, specify whether to override the security or processing algorithms applied to the outgoing request for the WSDL file. Click Show
Response Stack to add a Response Stack page to edit the security or processing algorithms for incoming responses.
These settings apply only to the current request. To edit the request or response stack for all requests that use the current WSDL file, click Edit WSDL Security to open the WSDL Security Editor.
- When you are ready to send the service request, click Invoke. The generic service client sends the request and displays the message return under the View Response step.
Successful requests are recorded and added to the Request History list. If you are using IBM Rational Performance Tester or IBM Rational Service Tester for SOA Quality,
you can click the Generate Test Suite button ![]() to create a service test.
to create a service test.
Sending HTTP endpoint requests
You can send requests to services that use an HTTP endpoint.
If the service uses SSL authentication, create an SSL configuration before sending the request.
If the service uses SOAP security for encryption, signature, or other security algorithms, you must first configure the environment with the correct libraries and configuration files, and then create a security profile for the WSDL file.
To send a request to an HTTP service:
- Click the Open the Generic Service Client toolbar button () and select the Requests page.
- Click Add () and Add Endpoint Request or click Add an endpoint request from the main page.
- In the Configure Protocol window, select HTTP and specify the HTTP transport configuration. If necessary, click New to create an HTTP transport configuration for the call.
- Type the URL of the call, the HTTP method and version, and specify any header or cookie properties.
- Click Next.
- On the Select Root Element page, if the service uses a specific XML Schema Definition (XSD), select one from the list or click Browse to import the XSD file, and then, select the root element for the request. If no XSD is available for the service, select No Schema.
- Click Finish. The request is added to the Endpoints section of the Request Library.
- In the Request Library, select the request element. The generic service client shows three steps: Edit Data, Invoke, and View Response. The details for the call are displayed under the Edit Data step.
- On the Message page, use the Form, Tree, or Source views to edit the contents of the request. Each view shows a different format of the same data. To add or remove XML elements in the Form or Tree view, click Schema | Validate and Assist to comply with an XSD specified in the schema catalog.
- On the Attachments page, specify any file attachments to send with the request. You must have configured the environment with the correct libraries and configuration files to handle file attachments.
- On the Transport page, if necessary, change the transport configuration for the request. You can create and edit transport and security configurations by clicking the Transport tab.
- On the Request Stack page, specify whether to override the security or processing algorithms applied to the outgoing request for the WSDL. Click Show Response Stack to add a Response Stack page to edit the security or processing algorithms for incoming responses.
These settings apply only to the current request. To edit the request or response stack for all requests that use the current WSDL file, click Edit WSDL Security to open the WSDL Security Editor.
- When you are ready, click Invoke to send the service request. The generic service client sends the request and displays the message return under the View Response step.
Successful requests are recorded and added to the Request History list. If you are using IBM Rational Performance Tester or IBM Rational Service Tester for SOA Quality, you can click the Generate Test Suite button (![]() ) to create a service test.
) to create a service test.
Sending a JMS endpoint request
You can send requests to services that use a Java. Messaging Service (JMS) endpoint.
If the service uses SSL authentication, create an SSL configuration before sending the request.
To send a request to a JMS service:
- Click the Open the Generic Service Client toolbar button () and select the Requests page.
- Click Add () and Add Endpoint Request or click Add an endpoint request from the main page.
- In the Configure Protocol window, select JMS and specify the JMS transport configuration. If necessary, click New to create an JMS transport configuration for the call.
- Click Add to specify any properties that are to be sent with the call.
- Click Next.
- On the Select Root Element page, if the service uses a specific XML Schema Definition (XSD), select one from the list or click Browse to import the XSD file, and then, select the root element for the call. If no XSD is available for the service, select No Schema.
- Click Finish. The request is added to the Endpoints section of the Request Library.
- In the Request Library, select the request element. The generic service client shows 3 steps: Edit Data, Invoke, and View Response. The details for the request are displayed under the Edit Data step.
- On the Message page, use the Form, Tree, or Source views to edit the contents of the request. Each view shows a different format of the same data. To add or remove XML elements in the Form or Tree view, you can click Schema | Validate and Assist to comply with an XSD specified in the schema catalog.
- On the Attachments page, specify any file attachments to send with the request. You must have configured the environment with the correct libraries and configuration files to handle file attachments.
- On the Transport page, if necessary, change the transport configuration for the request. You can create and edit transport and security configurations by clicking the Transport tab.
- On the Request Stack page, specify whether you want to override the security or processing algorithms
applied to the outgoing request for the WSDL. Click Show Response Stack to add a Response Stack page to edit the security or processing
algorithms for incoming responses.
These settings apply only to the current request. To edit the request or response stack for all requests that use the current WSDL file, click Edit WSDL Security to open the WSDL Security Editor.
- When you are ready, click Invoke to send the service request. The generic service client sends the request and displays the message return under the View Response step.
Successful requests are recorded and added to the Request History list. If you are using IBM Rational Performance Tester or IBM Rational Service Tester for SOA Quality, you can click the Generate Test Suite button (![]() ) to create a service test.
) to create a service test.
Sending a WebSphere MQ endpoint request
You can invoke calls to services that use a WebSphere MQ endpoint.
If the service uses SSL authentication, create an SSL configuration before sending the request.
If the service uses SOAP security for encryption, signature, or other security algorithms, you must first configure the environment with the correct libraries and configuration files, and then create a security profile for the WSDL file.
To send a request to an WebSphere MQ service:
- Click the Open the Generic Service Client toolbar button () and select the Requests page.
- Click Add () and Add Endpoint Request or click Add an endpoint request from the main page.
- In the Configure Protocol window, select WebSphere MQ and specify the WebSphere MQ transport configuration. If necessary, click New to create an WebSphere MQ transport configuration for the call.
- Specify the SOAP action. If the service requires that you override the header specified in the WebSphere MQ transport configuration, select Override MQ protocol configuration values and specify the correct details.
- Click Next.
- On the Select Root Element page, if the service uses a specific XML Schema Definition (XSD), select one from the list or click Browse to import the XSD file, and then, select the root element for the request. If no XSD is available for the service, select No Schema.
- Click Finish. The request is added to the Endpoints section of the Request Library.
- In the Request Library, select the request element. The generic service client shows three steps: Edit Data, Invoke, and View Response. The details for the request are displayed under the Edit Data step.
- On the Message page, use the Form, Tree, or Source views to edit the contents of the request. Each view shows a different format of the same data. To add or remove XML elements in the Form or Tree view, click Schema | Validate and Assist to comply with an XSD specified in the schema catalog.
- On the Attachments page, specify any file attachments to send with the request. You must have configured the environment with the correct libraries and configuration files to handle file attachments.
- On the Transport page, if necessary, change the transport configuration to be used by the request. You can create and edit transport and security configurations by clicking the Transport tab.
- On the Request Stack page, specify whether you want to override the security or processing algorithms
applied to the outgoing request for the WSDL file. Click Show Response Stack to add a Response Stack page to edit the security or processing
algorithms for incoming responses.
These settings apply only to the current request. To edit the request or response stack for all requests that use the current WSDL file, click Edit WSDL Security to open the WSDL Security Editor.
- When you are ready, click Invoke to send the service request. The generic service client sends the request and displays the message return under the View Response step.
Successful requests are recorded and added to the Request History list. If you are using IBM Rational Performance Tester or IBM Rational Service Tester for SOA Quality, you can click the Generate Test Suite button (![]() ) to create a service test.
) to create a service test.
Test all operations in a WSDL file
You can Use the generic service client to rapidly send requests to a service using all the operations in a Web Services Description Language (WSDL) file. The calls are generated with default values based on the type of data.
Ensure that you have a valid WSDL file. Ensure that the WSDL files use the correct syntax for the test environment. The generic service client might not work with some Web Services Description Language (WSDL) files.
If the service uses SSL authentication, create an SSL configuration before invoking the call.
If the service uses SOAP security for encryption, signature, or other security algorithms, you must first configure the environment with the correct libraries and configuration files, and then create a security profile for the WSDL.
Calls will be generated for each operation in the WSDL file using the default values for each type. For example, strings will use the default value str. You can change the default values in the XML Default Values preferences.
- Open the generic service client and click the Requests tab, and then, click
 Add a WSDL file.
- In the Add WSDL Files window, select an existing WSDL or import a WSDL with one of the following methods:
- Click Import from File to import a WSDL file from the file system.
- Click Import from URL to download and import an online WSDL from the web.
- Click Import from WSRR to import a WSDL from an IBM WebSphere Service Registry and Repository
(WSRR). Enter the URL of the WSRR and click Connect. You can click Search to browse the contents of the repository.
- Click Import from UDDI to import a WSDL from a Universal Description Discovery and Integration (UDDI)
repository. Enter the URL of the UDDI and click Connect. You can click Filter and Search to browse the contents of the repository.
- Click OK. The WSDL is added to the Call Library.
- In the Call Library, right-click the WSDL and select Test WSDL Methods. The call is automatically configured with any SOAP or JMS endpoints that are available in the WSDL.
Successful calls are recorded and added to the Request History list. If you are using IBM Rational Performance Tester or IBM Rational Service Tester for SOA Quality, you can click the Generate Test Suite (![]() ) button to create a service test.
) button to create a service test.
View message content
The Raw Transaction Data view displays the raw XML, text, or binary content of any service request or response that is selected in the generic service client. The Raw Transaction Data view displays plain text, XML, or binary data, depending on the type of the message content.
To view text, XML, or binary message content:
- In the generic service client, click the View menu, and select Raw Transaction Data. If you are using IBM Rational Performance Tester or IBM Rational Service Tester for SOA Quality,
click...
-
Window | Show View | Raw Transaction Data
- Select a service request or response. If you are using IBM RPT or IBM Rational Service Tester for SOA Quality, this view is also linked to the selected request or response in service tests, service stubs, or in the test log.
- Depending on the nature of the message content, the following actions are available:
- Text mode
-
When a plain text element is displayed, you can select and copy text. Click Colorize Text to enable or disable text colorization for HTML.
- XML mode
-
When an XML element is displayed, you can select and copy text. Click Colorize Text to enable or disable text colorization for XML. Click Enable XML Pretty Serialization to improve readability by adding line breaks and indentation to the XML content.
If the XML content is modified by a request or response stack or by the WSDL security editor, the Stack Contents pane displays the list of steps in the stack. You can select each step to view the changes to the XML content. You can also select one or two steps and click Compare Steps to open a comparison window.
- Binary mode
-
When a binary element is displayed, you can switch between Binary and Raw-ASCII views. Right-click the binary view to perform the following actions:
- Select: Opens the Select window, where you can select binary data by string or by specifying the number of characters to select. When a portion of binary data is selected, you can copy it to the clipboard.
- Go to Offset: Opens the Go to Offset window, where you can move to bytes at a particular offset.
- Find: Opens the Find window, where you can search for and replace binary data in a number of formats.
- Encodings: Select the encoding to use for displaying binary data in the text column.
Synchronize a remote WSDL file
For web services that make their Web Services Description Language (WSDL) file available from a URL, you might have to ensure that the WSDL that you work with is always up to date. By synchronizing the WSDL, you ensure that the local copy of the WSDL in your workspace is regularly synchronized with the remote WSDL.
Ensure that you have a valid WSDL file. Ensure that the WSDLs use the correct syntax for the test environment. The product might not work with some Web Services Description Language (WSDL) files.
WSDL synchronization only works with remote WSDLs that are imported from a URL.
The WSDL synchronization runs either when the workbench is started or after a specified period. If the remote WSDL changes, the local copy of the WSDL is updated. Depending on the changes, a merge is performed and any service requests that use the WSDL are updated. If the changes to the WSDL cannot be automatically applied to the service requests, for example if an operation is removed or renamed or if the XML structure of the service request is changed, the test is marked with a error.
To import a synchronized remote WSDL:
- Open the generic service client, click the Requests tab, and then, click Add a WSDL file .
- In the Add WSDL Files window, click Import from URL to download and import a remote WSDL from the web.
- On the Import WSDL from URL page, type the URL of the remote WSDL. If you are connecting through a proxy or a corporate firewall, click Proxy properties to specify your network settings.
- In the Synchronization policy area, specify whether and when to synchronize WSDLs:
- Select Never if you do not want the remote WSDL to be updated.
- Select On session launch to synchronize the WSDL each time you start the workbench.
- Select Every to specify a synchronization period in days.
- Click OK. The WSDL is added to the Call Library.
After the WSDL is imported, you can change the synchronization settings by right-clicking the WSDL in the generic service client Call Library or in the test navigator. Then select WSDL Synchronization. The WSDL Synchronization window also displays the date of the latest synchronization.
Add static XML headers to a service request
You can add static XML headers to service requests to ensure compliance with WS-Addressing, WS-ReliableMessaging, and WS-Coordination specifications as well as other predefined standards. Static XML headers are compliant with the web service specifications for service-oriented architecture (SOA). Checks are performed to ensure that the XML headers are valid.
To add a static XML header to a request:
- Open a service request in the generic service client. The location of the XML header depends on the product that you are using:
- For IBM Security AppScan , click the Request Stack tab and in the algorithm stack for the request, click Add | Static XML Headers.
- For IBM Rational Performance Tester and IBM Rational Service Tester for SOA Quality, click the Message tab and click Form.
- On the Header bar, click Add () to open the menu.
- Select the web service specification for the request to be comply with, or click More to open a detailed list of specifications. The XML structure of the header is created.
- Edit the header as required. Some elements require completion or content to be specified. XML elements that are invalid or require attention are marked with a warning or an error symbol.
Opening file attachments
When a service sends a file attachment with the response, you must import it as a resource to open the attachment.
Ensure that you have specified an editor to view the attachment type in. Click...
-
Window | Preferences | General | Editors | File associations | editor
- Open the message return, and click the Attachment tab. File attachments are listed with a default name, a MIME type, and a contents ID.
- Select the line for the attachment to open, and click Open.
- In the Create Resource window, type a name for the resource, and select a location where it will be imported, and click OK. Ensure that the name of the resource includes a file extension that is compatible with the MIME type of the attachment.
After the attachment has been imported, you can click on Open again to open the file in the corresponding editor.