View different types of statistics
- individual host
- application
- component
- package
- class
- method
To drill down into statistics:
- Right-click any page response graphic (for instance, a bar in a bar chart) to display the pop-up menu, and select...
-
Display Page Element Responses
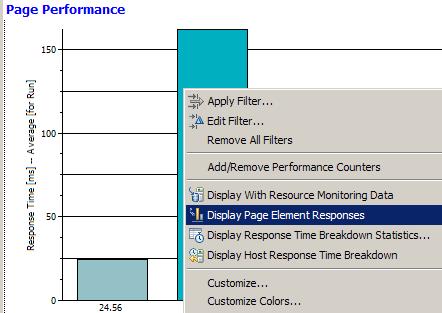
The ten slowest page element response times are displayed.
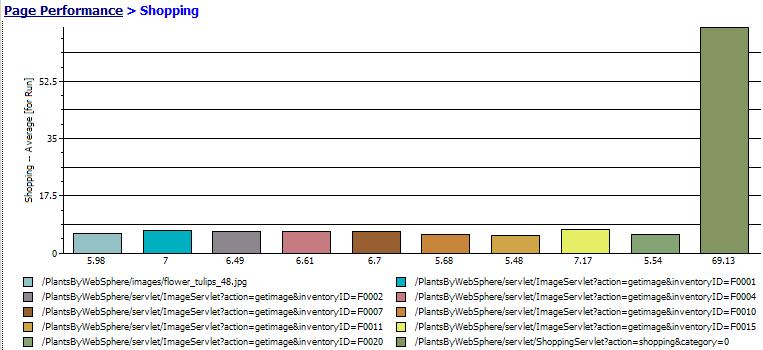
- Right-click the page element to analyze, and then select...
-
Display Host Response Time Breakdown

Select from...
Average Base Time Time spent inside this object, excluding time spent in other objects that the selected object invokes, divided by the number of calls. Base Time time spent inside this object, excluding time spent in other objects that the selected object invokes. Calls number of times the selected object was invoked by any other object. Cumulative Time time spent inside this object and in other objects that the selected object invokes. The response time breakdown data is displayed.
- Right-click to display the pop-up menu again, then select...
-
Display Application Response Time Breakdown
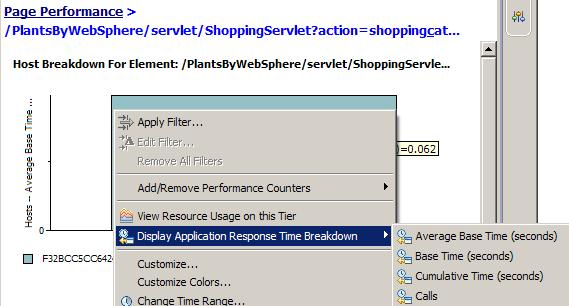
Select from Average Base Time, Base Time, Cumulative Time, Calls. The response time breakdown data is displayed.

- Right-click to display the pop-up menu again, then select...
-
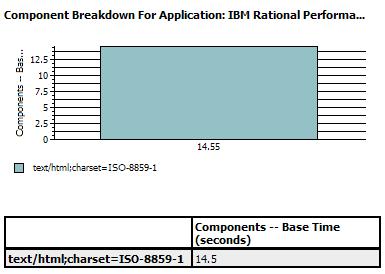
Display Component Response Time Breakdown
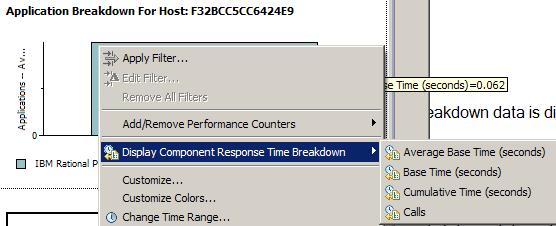
Select from Average Base Time, Base Time, Cumulative Time, Calls. The response time breakdown data is displayed.
- Right-click to display the pop-up menu again, then select...
-
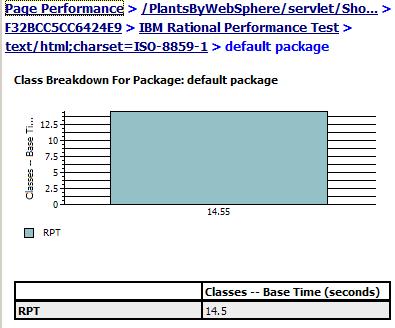
Display Package Response Time Breakdown

Select from Average Base Time, Base Time, Cumulative Time, Calls. The response time breakdown data is displayed.

- Right-click to display the pop-up menu again, then select...
-
Display Class Response Time Breakdown

Select from Average Base Time, Base Time, Cumulative Time, Calls. The response time breakdown data is displayed.
- Right-click to display the pop-up menu again, then select...
-
Display Method Response Time Breakdown
Select from Average Base Time, Base Time, Cumulative Time, Calls. The response time breakdown data is displayed.
- To return to previous views, use the navigation information in the upper left corner.