Interpret response time breakdown statistics
Overview
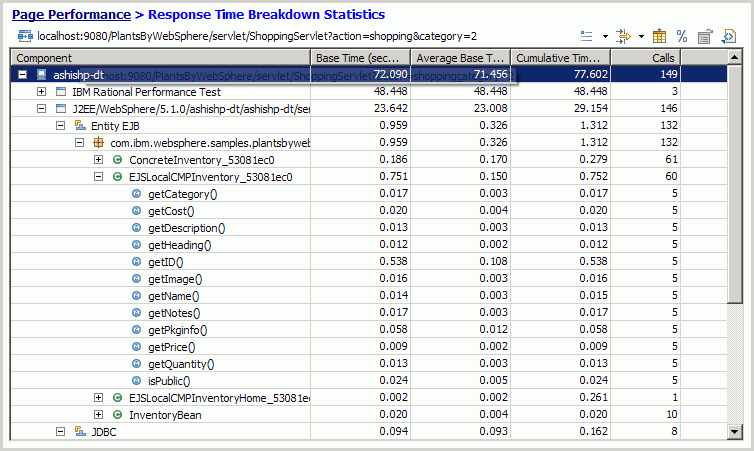
The response time breakdown report shows a table for an aggregation of all instances of a selected page element. Only data collected by the data collection infrastructure is displayed.If a computer does not have the DCI installed or running, no data is displayed from that computer.
Analyze response time breakdown statistics
- Choose a tree layout or a simple layout by clicking the Layout button, the first button in the toolbar in the upper right corner of the view.

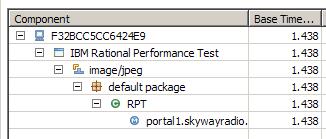
The tree layout shows the following hierarchy, in order:
- host
- application
- component
- package
- class
- method

The tree layout helps you identify which tier in enterprise environment has the slowest response time. The simple layout is a flattened version of the tree layout. The simple layout provides a quick and easy way to see the slowest or fastest methods. The default layout is the simple layout. Click a column heading to sort the table by that column. Drag the columns to change the order in which they're displayed. Except for the first column in the tree layout, all of the columns are moveable.

Four results are displayed for each object:
Base Time Time spent inside this object, excluding time spent in other objects that the selected object invokes. Average Base Time Time spent inside this object, excluding time spent in other objects that the selected object invokes, divided by the number of calls. Cumulative Time Time spent inside this object and in other objects that the selected object invokes. Calls Number of times the selected object is invoked by any other object. The exact URL of the selected page element is displayed before the table. All times are in seconds.
- The toolbar in the upper right corner enables you to change the table display and export the results.
- Click the Manage Filters button, the second button in the toolbar in the upper right corner, to open the Filters window.
There you can add, edit, or remove filters applied to the displayed results.
- Click the Select Columns button, the third button in the toolbar in the upper right corner, to open the Select Columns page.
There you can select which columns are displayed in the table. These settings are saved with the current workspace, and are applied to all response time breakdown tables in the workspace.
- Click the Percent Format button, the fourth button in the toolbar in the upper right corner, to toggle the display between percentages and absolute values.
- Click the Open Source button, the fifth button in the toolbar in the upper right corner, to jump to the source code (if available) in workspace.
You must first select a method before clicking the source button.
- Click the Report button, the last button in the toolbar in the upper right corner, to open the New Report window.
There you can export the response time breakdown table to CSV, HTML, or XML formats.
- Click the Manage Filters button, the second button in the toolbar in the upper right corner, to open the Filters window.
- Use the navigation information in the upper left corner to navigate back to previous views.
Related tasks