Example: Custom reports on page attempts
You can create custom reports to see how frequently problematic pages are being accessed. Assume that, in a schedule run, certain pages are causing bottlenecks as indicated by very long page response times. You can create a custom report to see how frequently the problematic pages are being accessed.To create a report that shows the page attempts:
- Click File > New > Performance Test Report.
- In the Name field of the Performance
Test Report window, type the name of the new report. In this example, it is called...
-
Frequency of Page Attempts during Run

- Click Insert to enter information about the report tab.
- In the Report Tab window, set the
properties of the tab:
- In the Title field, type the name of the tab: Page attempt frequency.
- Select the Custom Tab (1 graphic) for the report.
In this report, you want only one graph, which shows the frequency of page attempts. However, you can design a report from any system-supplied report tab.

- Click Next.
- In the Report Tab: Graphic Properties window,
set the properties of the report:
- Type the title of the tab...
-
Graph of Page Attempt Frequency
- Select Line Chart.
Although you can click Add in the Graphic-Wide Filters area to filter the report now, it is best to create the report first, and filter the data after you examine the report. You can filter a report by count, by value, or by label.

- Click Customize.
- Type the title of the tab...
- In the Graphic Configuration window,
set the display properties for the line chart:
- Under X Axis, change the "Select template" field to make the report display units of time in seconds: Time [s].
The X Label and X Multiplier fields are automatically completed to indicate that the time is in seconds. In X Multiplier, the default time, ms, is multiplied by .001 to create seconds.
- Append text to the value of X label to make it more descriptive: Time [s] since start.
- Confirm that Show Legend is selected.

- Under X Axis, change the "Select template" field to make the report display units of time in seconds: Time [s].
- Click OK.
- In the Report Tab window, click Next.
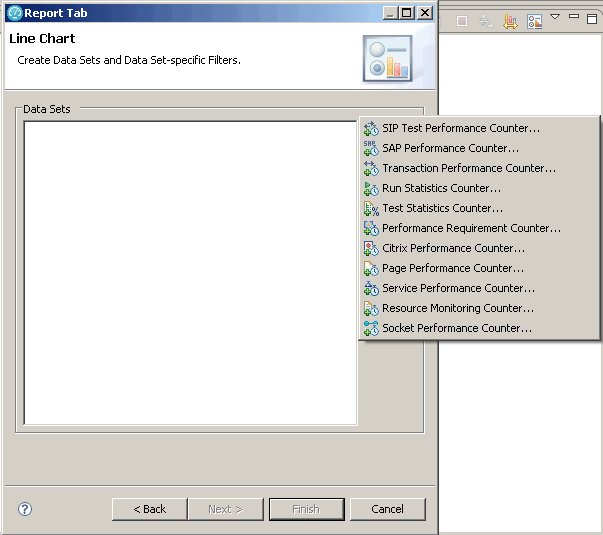
- Select the counters to include in the report:
- Click Add, and select Page
Performance Counter.

- In the Page Performance Counters wizard, expand the tree to Attempts > All pages.
- Select the Rate [per second][for Run] counter,
and click Finish.
The help topic HTTP counters explains each HTTP counter.

- Click Add, and select Page
Performance Counter.
- Click Finish to close the Report Tab window, and click Finish again to close the Performance Test Report window.
What to do next
You can manage and edit this report just as you do the default reports. When you right-click an item in the Performance Test Runs view, and then click Display Reports, the new report is listed along with the system-supplied reports.
To run the new report, open the Performance Test Runs view, right-click the schedule run, select Manage Reports, and select the name of the new report, Frequency of Page Attempts during Run.