Create a custom report
Overview
You can use a system-supplied report as a template and modify it by adding and removing counters. You can also create a report from scratch.
Create a custom report
- Click...
-
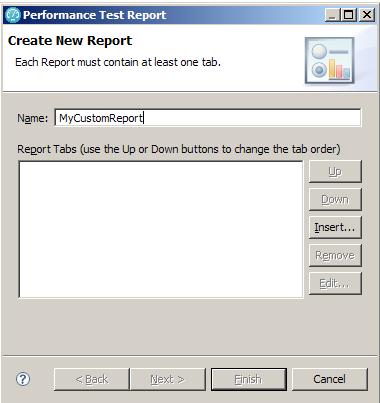
File | New | Performance Test Report
- In the Name field of the Test Report window, type the name of the new report.

- The Report Tabs list is empty because you are creating a new report (rather than editing a report). Click Insert to enter information about the tab.
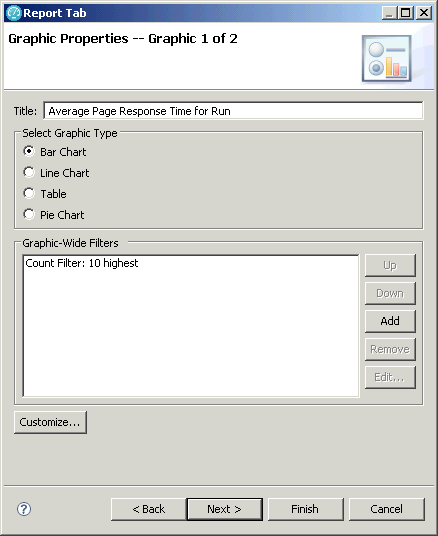
- In the Report Tab window, in the Title field, type the name of the new tab.

- Select a tab for an existing report as a template, or select a custom tab based on the general format for new report:
- The Performance Tab, Summary Tab, Page Throughput Tab, Server Health tabs, and Response vs. Time tabs all are included in the Performance report.
- The Page Element Throughput Tab and the Page Element Summary Tab are included in the Page Element report.
- The Transaction Throughput Tab and the Transaction Summary Tab are included in the Transaction report.
- The Verification Point Summary Tab is included in the Verification Points report.
- The Custom Tab (n graphics) option creates a new tab with the indicated number of graphics. Tables are considered graphics.
- Click Next.
- The number of wizard pages that you see, and the information
that they contain, depend on the template you selected. You will see
two wizard pages for each graphic. You select the graphic type (bar
chart, line chart, or table) in the first window. You select the counters
in the second window.
- Type the title of the tab.
- If necessary, change the graphic type. The
graphic type selected depends on template.
For example, if you chose Performance Tab, the title of the tab is Performance and the graphic type is Bar Chart, which is the type of chart that the Performance tab displays.

- Click Next. Although you can click Add to filter the report now, it is best to create the report first, and filter the data after you examine the report. You can filter a report by count, by value, or by label.
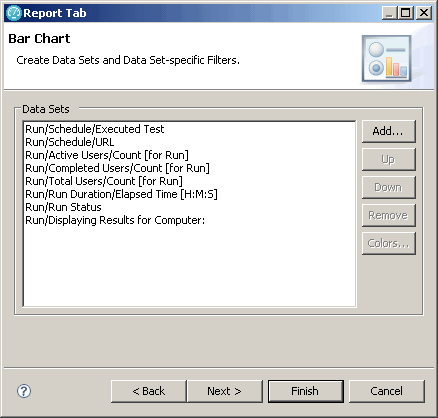
- The data on this page depends on the graphic type that
you selected.
For example, Performance report pages contain default performance counters, Summary report pages contain the default summary counters, and so on.

- To add new counters, click the Add button, and select the type of counters to add.
The Add/Remove Counters wizard opens for you to select the counters to include in the report. Typically, you add generic counters to a report because the counters are updated each time you regenerate the report. However, you can also create a baseline report with static information—that is, a report where the counters are taken from the same control test run rather than updated with current results.
To create a baseline report, do not add the counters now. Instead, add them when the report is displayed by dragging counters from the Performance Test Runs view onto the report.
The help topic HTTP counters explains each HTTP counter.
- If there are multiple graphics, click Next to display the title and graphic type for the next graphic.
- When you are finished selecting the graphics and counters, click Finish.
Results
You can now manage and edit this report just as you do the default reports. When you right-click an item in the Test Runs view, and then click Display Reports, the new report is listed with the system-supplied reports.
