Studying garbage collection
Prerequisites:
Before being able to analyze profiling data to study garbage collection, ensure that the following
step has been completed:
The Java run-time system performs garbage collection automatically. It finds
memory that a program is no longer using and frees it.
In the Profiling Tool, garbage collection can only be run if the process is active. To launch
a process, refer to the Launching or attaching to an application topic. Garbage collection
is available from Package Statistics view, Class Statistics view as well as the Instance Statistics view
when instance level information is collected.
To view details about garbage collection,...
- In the Profiling Monitor view, select the monitor or agent.
-
Right click, then select Open With > Package Statistics.
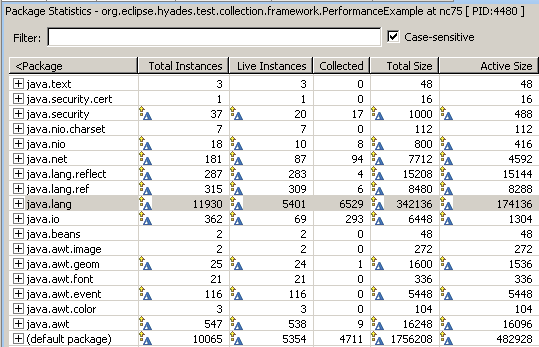
The Package Statistics view opens.
- Check that the Live Instances and Collected columns are
visible. If they are not, right-click, select Choose Columns., then set these
columns to be visible.
- View the results in the Packages Statistics view:
- In the Live Instances column, you can see how many
instances for the current packages are still alive, and not garbage collected.
- In the Collected column, you can see how many
instances for the current packages are garbage collected.
- You can expand the current package to see the same
information at the class level or open the Class Statistics view.
- You can also drill down at the instance level using
Instance Statistics view if you have collected instance level
information in the profiling criteria. To setup the profiling criteria, refer to the Specifying profiling criteria topic.
- In the Profiling Monitor view, select the monitor or agent.
- Right click and select Run Garbage Collection

- In the Package Statistics view, right-click and select Refresh Views. The Package Statistics
view is refreshed showing the changes in the number of active instances at the package level.

Related concepts
Overview of the Profiling Tool
Execution flow view and table
Statistical views
Related tasks
Profiling an application
Launching or attaching a Java process
Identifying resource-intensive methods
![]()
