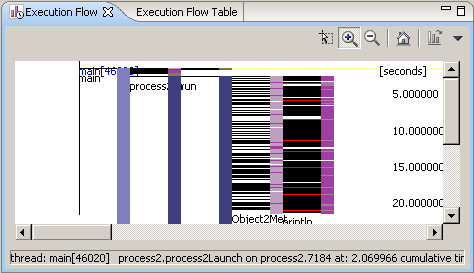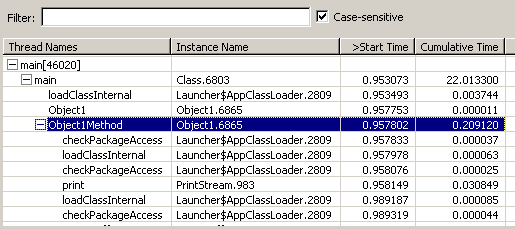
The Execution Flow view and table both show a representation of the entire program execution. In the view, the threads of the program fit horizontally, and time is scaled so that the entire execution fits vertically. In the table, the threads are grouped in the first column and time is recorded in successive rows.
Here is an example of the Execution Flow view:

Stripes cascade to the right as one method calls another method, whose responding method in turn calls another method, and so on. Stripes are grouped in columns by thread. A thin, black vertical line separates one column from another. The name of each thread appears at the top of its column.
Use the Zoom In tool
![]() to expand
the graph.
to expand
the graph.
The Execution Flow view displays the following information:
![]()
![]()
![]()
If the view is open from the monitor object, it shows the execution for all the agents under the monitor. The name of the thread shows the ID of the corresponding process to differentiate between threads of the same name in different processes.
By default, the left most columns display the GC (garbage collection) thread, which contains objects collected from all the processes under this monitor. A thin rectangle appears in this column whenever garbage collection for an object occurs. As with other objects and methods in the view, you can click the object for which garbage collection has occurred in order to select it. Large, raised, gray rectangles represent garbage collection phases in the profiling session.
Here is an example of the Execution Flow table:

The same information is available in the table as in the view.
Related concepts
Overview of the Profiling Tool
Profiling resources
Related tasks
Profiling an application
Viewing performance bottlenecks
Viewing invocations and callers of a method
Identifying phases of program execution
Identifying active threads
Identifying resource-intensive methods
Related references
Execution flow view controls