Execution Flow Graph Controls
The Execution flow view and table provides toolbar controls and popup controls.
Controls
The toolbar for both view and table contains the following controls:
- Area select

- To select a portion of the graph to enlarge.
- Zoom in

- To zoom into the graph.
- Zoom out

- To zoom out from the graph.
- Home

- To reset the display to its original size and position.
- Graph colors

- To change the colors of the graph being viewed. The change applies
only to the currently active Execution Flow graph.
- Menu > Show Time
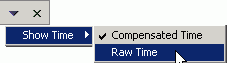
- To select the time basis of the graph. Raw time is the time
that an application takes to run, including the profiling overhead.
Compensated time (default) is the time the application takes minus the time
attributed to profiling.
Control on the graph
You have some control in the body of the graph as well. Point the mouse over
a stripe to display status information (for example:
 )
)
- Thread name (main)
- Instance identifier ([2052]:0)
- Time of call, or instantiation time in the case of constructors
(18.93301)
Pointing elsewhere in the view displays the thread name and time
corresponding to the pointer's vertical position.
Pop up control
The pop up controls consist of the following:
- Refresh Views
- To update all Profiling and Logging views.
- Graph Colors
- Same as the Graph Colors button.
- Detect All Repetitions
- Displays Xs to identify frequently called methods.
- Hide All Repetitions
- Hides the display of Xs at frequently called methods.
- Threads > Show All Threads
- Display all threads belonging to the selected resource.
- Threads > Hide All Threads
- Hide all the threads belonging to the selected resource.
- Threads > GC
- Display the Garbage Collection thread.
- Threads > thread name
- Display the named thread.
- Home
- Return to the original the graph to the state it was in when first opened.
- Show Execution Table
- Display the information in a table instead of a graph.
- Show Method Invocation
- Display the same information but also show the invoking methods for a given
method.
- Open Source
- To open an editing view containing the selected source code. The method,
class, or package must be in the workbench.
Related concepts
Overview of the Profiling Tool
Profiling resources
Execution flow view
Related tasks
Profiling an application
Identifying phases of program execution
Identifying active threads
Identifying resource-intensive methods