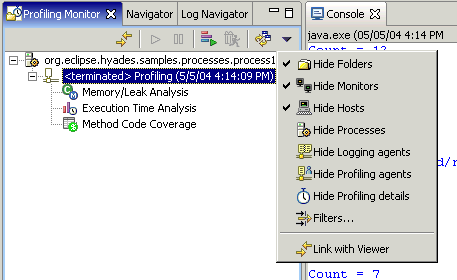
Profiling Monitor view
A project, complete with all the other resources required for profiling, is shown in the Profiling Monitor view whenever you launch either a local Java process or a remote one.
The Profiling Monitor view displays the profiling resources that get created during a profiling session. These resources are organized in a tree with the project being the root:
- Projects and folders


- Monitors

- Hosts

- Processes

- Agents (profiling and logging)


- Profiling filter sets selected


It is possible to keep profiling resources in any type of project or folder. Except for the project, the profiling objects are not directly related to a workbench resource.
Once you have profiled your application, you can open various Profiling and Logging views from any of the profiling resources in the Profiling Monitor view as indicated in the illustration. The hierarchical level of the resource in this view determines the type of information that is displayed in these views. For example, opening the Profiling and Logging views from the monitor rather than from an agent gives you a global, aggregated view of all the profiling data contained under this monitor. Views opened from the monitor level enable you to see the data from multiple hosts, processes and agents.
Whenever you launch or attach to a Java process, a logical representation of the Java process is created in the Profiling Monitor view. This representation, the process object, is identified both by name and an ID number (PID) that appears in the view along with the associated agents. The agents collect profiling data from your Java process, and this data can be analyzed.
The Profiling Monitor view is launched when you select the Profiling and Logging perspective. Use this view to administer your profiling activity.
Information on the controls for this view can be found in the Profiling Monitor view controls topic.
Related concepts
Overview of the Profiling Tool
Profiling console view
Related tasks
Profiling an application
Related references
Profiling resources