Identifying thread bottlenecks
The Thread View is the primary view for detecting thread bottlenecks. It displays a record of the activity of each of your program's threads, and helps you identify thread contentions and deadlocks.
Prerequisite: Collecting thread data
A contention occurs when a thread is waiting for a resource that is not readily available; it slows your code´s execution, but can clear up over time.
A deadlock occurs when a thread is waiting for a resource that a second thread has locked, and the second thread is waiting for a resource that the first thread has locked. More than two threads can be involved in a deadlock. A deadlock never resolves itself. It often causes the whole application, or the part that is experiencing the deadlock, to halt.
To locate thread contentions and deadlocks:
- Display the Thread View: Right-click your Thread Analysis profiling resource, and then in the pop-up menu select Open With > Thread View.
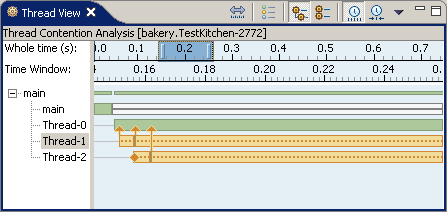
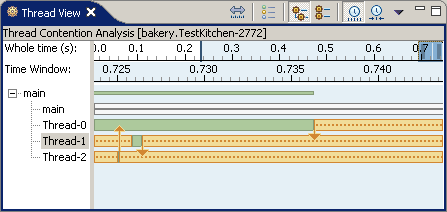
- In the Thread View, look for vertical arrows between threads. A single arrow indicates a thread contention: one thread is waiting for another thread to release a lock. Multiple arrows can indicate a deadlock. A diamond-shaped marker indicates that a thread is waiting for a lock, but the thread that holds the lock cannot be determined.
- Pause your cursor over a thread segment that is waiting for a lock. This displays a tool-tip that specifies the name of the lock and identifies the thread that is holding the lock.
Here is an example of a contention:
Here is an example of a deadlock:
Note: Profiling a program with the Execution Time Analysis profiling type allows you to collect and display thread data, but only for threads in the Running and Dead states. To display bottlenecks, include the Thread Analysis profiling type in your profiling set.
The following topics provide instructions for controlling the Thread View:
Hiding and showing the legend in the Thread View
By default, the Thread View displays a legend that lists the symbols for all thread states along with their meaning. You can choose whether to hide or show the legend.Changing the thread name display format in the Thread View
By default, the Thread View displays the names of the threads for which it has information in tree format, grouping threads into collapsible nodes. You can choose instead to display the names as a flat, non-hierarchical list.Changing the timescale in the Thread View
By default, the Thread View timescale represents linear time, which shows the entire range of time over which your program ran. You can choose instead to display compressed time, which compresses the times when no interesting thread activity occurred.Zooming and scrolling the time display in the Thread View
By default, the Thread View displays the entire time for the program run that you are investigating. You can focus the time on a specific time segment by zooming and scrolling the display.Changing colors and patterns in the Thread View
You can change the colors and patterns used to display significant information in the Thread View.
Parent topic
Detecting thread bottlenecks
Related tasks
Identifying the methods behind thread bottlenecksRelated reference
The Thread View

