Remote debugging
A programmer cab debug a Java application running on a remote machine and control its execution. This is particularly useful when debugging an application that cannot be run on the development machine.
The application that is debugged remotely must be compiled with debug information about it (within Application Developer select Window Æ Preferences, and look at Java Æ Compiler and the Classfile Generation attributes). Also, when the application is launched, the appropriate JVM parameters must be supplied in the debugger machine to configure the IP address and port, which can vary between different JVMs.
When starting the debug session, use Debug As Æ Debug (from the Enterprise Explorer context menu) and create a new configuration for Remote Java Application.
Make sure the Host and Port are configured for the target machine and that the source tab is filled out with the appropriate source code, then click Debug and the remote debugging session will start.
The Debug UI daemon is a feature available from the toolbar of the Debug view, which allows developers to debug XSL transformations that are invoked by a WebSphere application.
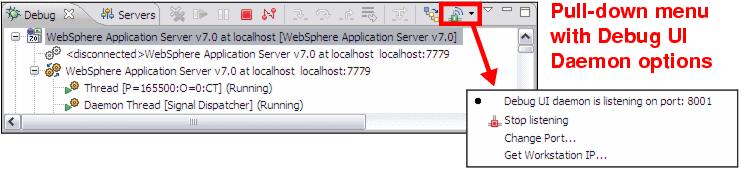
Figure 24-4 Setting Debug UI Daemon options
When enabled, the daemon listens on a port (which you can configure)
and if during the WebSphere debug session, the application invokes an XSL transformation RAD will step into the XSLT file and debugging continues. You can disable the feature by selecting the appropriate option from the drop-down menu in the Debug view.
The debug daemon must also be started and ready to accept incoming debug session for working with the Debug extension for Rational Team Concert Client (Team Debug).
|
ibm.com/redbooks |