Generate and test the Web Service client
To generate a client and test the client proxy...
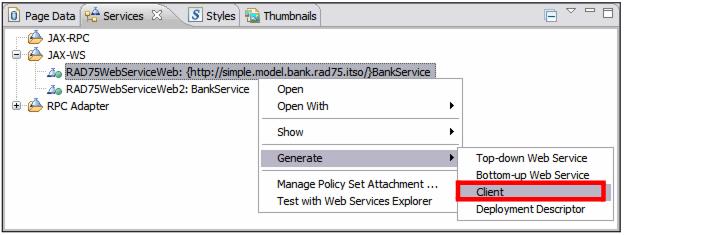
- Switch to the Services view, right-click RAD75WebServiceWeb and select...
-
Generate | Client
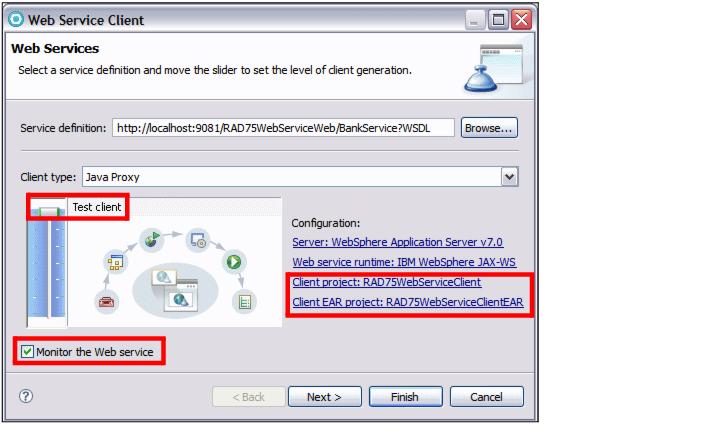
- In the Web Services Client dialog
- Move the slider up to the Test position. This provides options for testing the service using a JSP-based sample application.
- Select Monitor the Web service.
We recommend that you place the Web service and Web service client in separate Web and EAR projects:
- Click Client project.... The Specify Client Project Settings dialog opens.
- Change the client project name to RAD75WebServiceClient.
- Accept Dynamic Web project as the project type.
- Accept the client EAR project name as RAD75WebServiceClientEAR.
- Click OK. The wizard creates the Web and EAR projects.
- Click Next.
- In the WebSphere JAX-WS Web Service Client Configuration dialog, select Generate Web Service Deployment Descriptor. This will generate the JSR 109 1.2 deployment descriptor. Click Next.
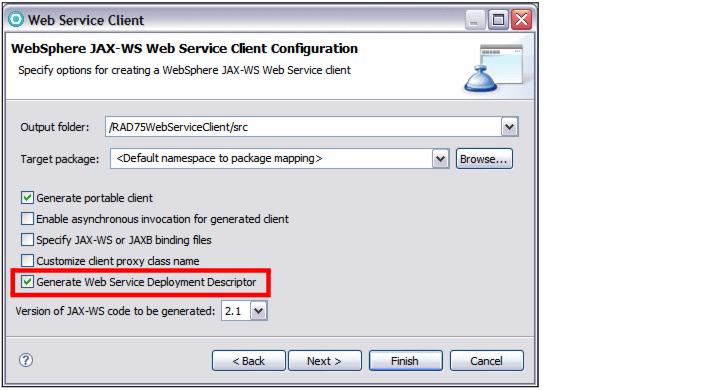
- The client code is generated into the new client project.
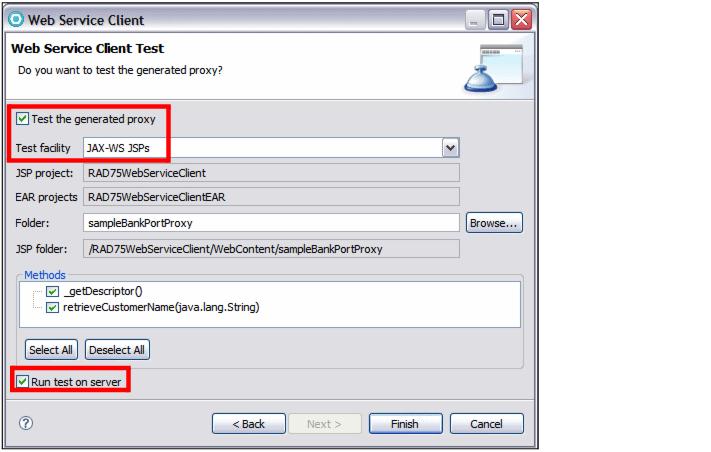
- In the Web Service Client Test dialog use these settings:
- The sample application is published to the server and the sample JSP is displayed in a Web browser.
- Select the retrieveCustomerName method, enter a valid value in the customer ID field (such as 111-11-1111), and then click Invoke.
The results are displayed in the result pane.
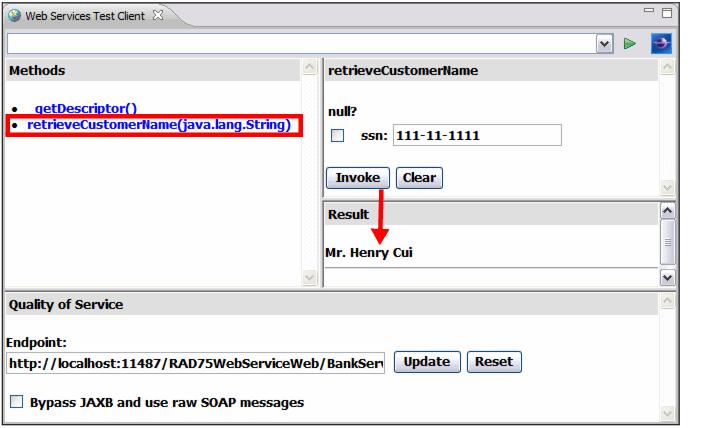
- Notice the Endpoint in the Quality of Service pane:
http://localhost:11487/RAD75WebServiceWeb/BankService
You might see a port number other than this one. It depends on what port number the wizard generated for the TCP/IP Monitor.
- The TCP/IP Monitor is also started. The TCP/IP Monitor lets you intercept and examine the SOAP traffic coming in and out of a Web service call.
- If you select...
-
Window | Preferences | Run/Debug | TCP/IP Monitor
you can see that a new Monitor is there to listen to the same port number (11487). The TCP/IP Monitor is started and ready to listen to the SOAP request and direct it to the Web service provider (at port 908x).
Behind the scenes:
- When you select Monitor the Web service in the Web Service wizard page, the Web Service Client wizard dynamically creates the TCP/IP Monitor for you. It uses a certain algorithm to find an available listening port for the Monitor, and the sample JSP client page uses the URL to dynamically set the Web service endpoint to match the Monitor port.
Using the wizard to create the TCP/IP Monitor is very handy, because the user does not have to spend time to figure out how to redirect the SOAP request to the TCP/IP Monitor, especially in the case of monitoring remote Web services.
All requests and responses are routed through the TCP/IP Monitor and appear in the TCP/IP Monitor view.
The TCP/IP Monitor view probably appears in the top right pane. Move it to the same pane as the Servers view.
The TCP/IP Monitor view shows all the intercepted requests in the top pane, and when a request is selected, the messages passed in each direction are shown in the bottom panes (request in the left pane, response in the right). This can be a very useful tool in debugging Web services and clients.
Select the XML view to display the SOAP request and response in XML format.
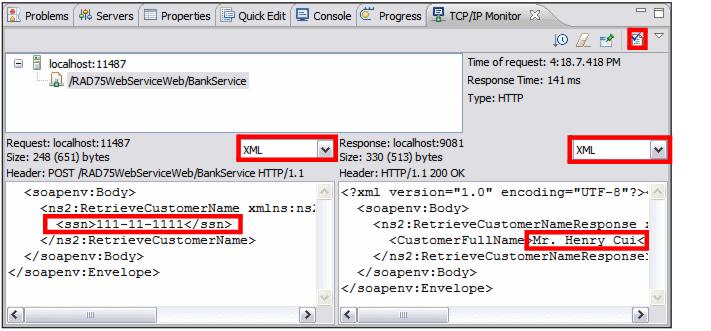
To ensure that the Web service SOAP traffic is WS-I compliant, you can generate a log file by clicking the icon
 at the top right corner. In the dialog box that opens, select a name for the log file and specify where you want it to be stored (for example in the client project).
The log file is validated for WS-I compliance. You will see a confirmation dialog stating: The WS-I Message Log file is valid. You can open the log file in an XML editor to examine its contents.
Stop the TCP/IP Monitor by selecting...
-
Window | Preferences | Run/Debug | TCP/IP Monitor
...and stop the TCP/IP Monitor from the list.
Update Web service endpoint URL for a Portlet application
To update a Web service endpoint URL for a Portlet application using the WAS console, to enable, for example, a promotion from DEV to STAGE...
Applications | WAR Modules | Web Services Client binding
Select a port and click Edit. You can specify the endpoint there.
Make sure your code uses JNDI lookup and has no hard-coded endpoints.