Read NeoLoad graphs
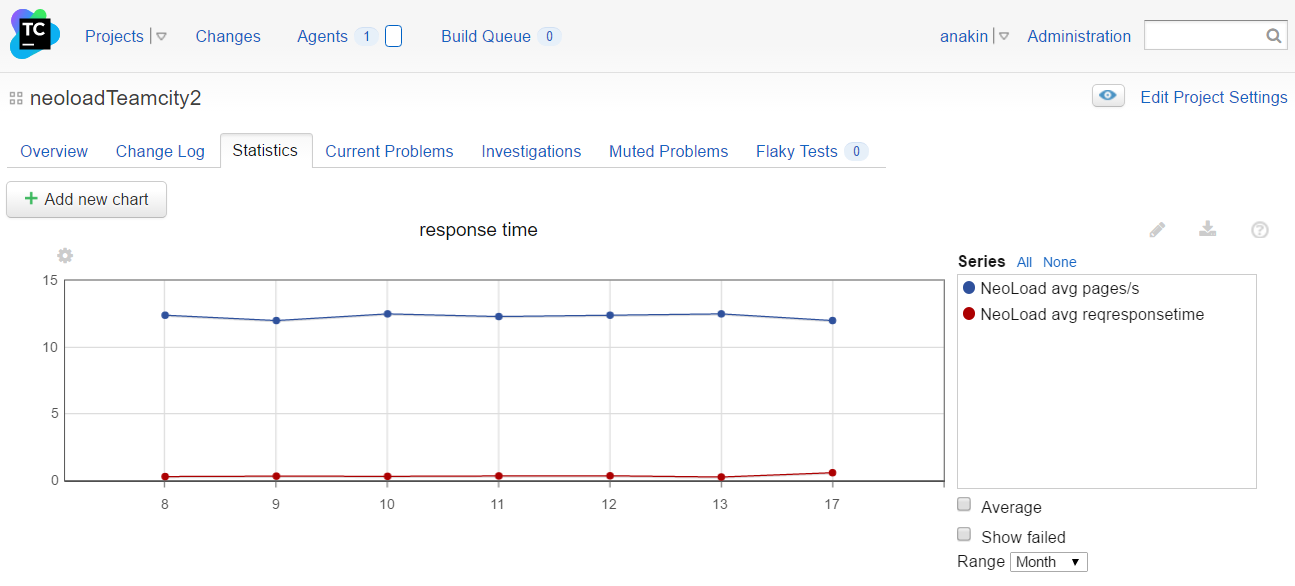
With the NeoLoad plugin, TeamCity can display:
- response times and error rates trend graphs in the selected job page and designed from XML reports generated by NeoLoad
The Avg. Resp. Time (pages) graph compiles the values for the average response times of the tested application pages per build.
The Error Rate graph compiles the percentage values of hits in error on the whole test per build.
The Test Result Trend graph compiles the results of the SLA defined in NeoLoad per build. "Passed" results are displayed in blue. "Failed" results are shown in red. NeoLoad "Acceptable" results are considered either passed or failed with the -SLAJUnitMapping <pass> or -SLAJUnitMapping <fail> command line arguments respectively.
- Warning: Trend graphs are available as soon as at least one successful job at least is available in TeamCity.
- To display the NeoLoad graphs in TeamCity
- In TeamCity, start a build of a job configured with the NeoLoad plugin.
- When the test is over, click <TeamCity project><TeamCity job> => Statistics tab.
