LiveCycle Data Services
Supported versions
NeoLoad supports LiveCycle Data Services (LCDS) versions 2.6 and later.
Connection settings
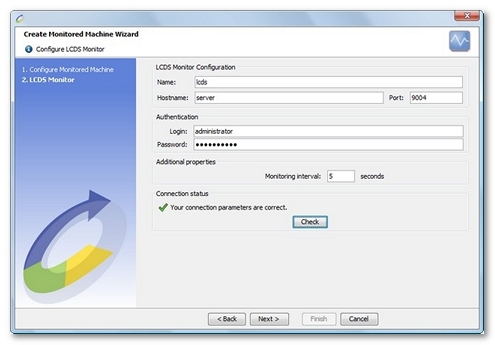
Defining a monitor on a LiveCycle Data Services server requires the name or IP address of the machine to be monitored, as well as the connection port. The port is the JMX port that is configured to the Java Virtual Machine.
If the JMX connection has not been configured, add the following parameters to the application server start-up script:
-Dcom.sun.management.jmxremote=true
-Dcom.sun.management.jmxremote.port=9004
-Dcom.sun.management.jmxremote.authenticate=false
-Dcom.sun.management.jmxremote.ssl=false
To enable authentication, or for more information about configuring the JMX connection, refer to the Sun documentation.
In addition to these settings, a valid user account must be provided if authentication is enabled (see com.sun.management.jmxremote.authenticate property).
Create a LCDS monitor
NeoLoad makes it possible to create a new monitor either using the monitored machine creation wizard, as described in Create and configure a monitored machine, or from an existing monitored machine, as described in Create and configure a monitor.

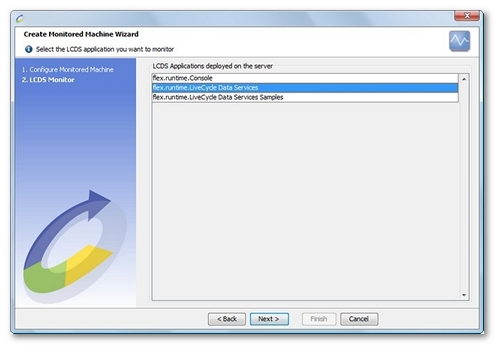
NeoLoad displays a list of the applications deployed on the configured server.

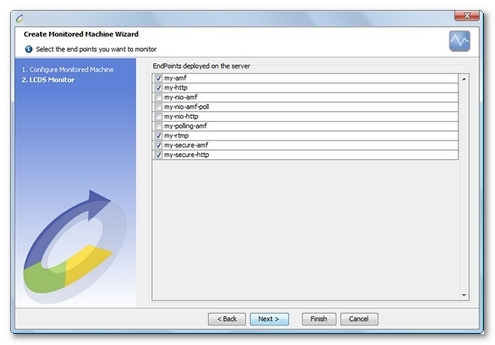
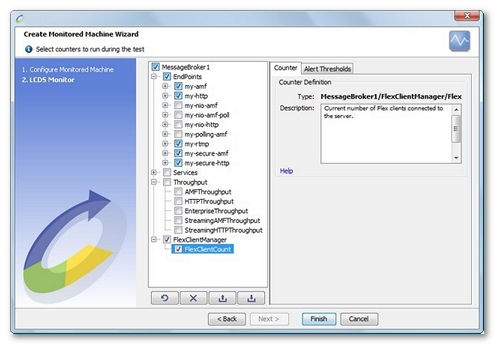
When selecting an application, NeoLoad displays a list of endpoints configured for this application. It then automatically selects the most appropriate counters for each of the selected endpoints.

Available counters

All LCDS counters are documented here. The first tree level shows the available message brokers.
- EndPoints. Counters for the defined endpoints on the server. Not all counters are available for all the end points (e.g.: streaming counters are only available for streaming endpoints).
- BytesDeserialized. Total amount of bytes received by the endpoints since last call.
- BytesSerialized. Total amount of bytes sent by the endpoints since last call.
- ServiceMessageCount. Count of messages decoded by this endpoint and routed to the broker.
- ServiceMessageFrequency. Number of service message invocations per minute.
- PushCount. Count of Push invocations.
- PushFrequency. Number of Push invocations per minute.
- StreamingClientsCount. Current number of clients connected to the streaming endpoint.
- MaxStreamingClients. Maximum number of clients connected to the streaming endpoint.
- Services. Statistics for the LCDS application various services.
- Data Services.
- ServiceMessageCount. Number of service message invocations.
- ServiceMessageFrequency. Number of service message invocations per minute.
- ServiceCommandCount. Number of service command invocations.
- ServiceCommandFrequency. Number of service command invocations per minute.
- ServiceMessageFromAdapterCount. Number of messages from an adapter that the managed service has processed.
- ServiceMessageFromAdapterFrequency. Number of service message from adapter invocations per minute.
- Remoting Services.
- InvocationSuccessCount. Current number of method invocations succeeded.
- InvocationFaultCount. Current number of method invocations failed.
- % InvocationFaultCount. Percentage of method invocations failed.
- AverageInvocationProcessingTimeMillis. Average processing time (in milliseconds) of all the method invocations.
- HTTP Proxy Services.
- InvokeSOAPCount. Current number of method invocation using SOAP protocol.
- InvokeSOAPFrequency. Frequency of method invocation using SOAP protocol.
- InvokeHTTPCount. Current number of method invocation using HTTP protocol.
- InvokeHTTPFrequency. Frequency of method invocation using HTTP protocol.
- Data Services.
- Throughput. Data throughput processed by the different types of endpoints.
- AMFThroughput. Total number of bytes passing through all AMF endpoints.
- HTTPThroughput. Total number of bytes passing through all HTTP endpoints.
- EnterpriseThroughput. Total number of bytes passing through all Enterprise endpoints.
- StreamingAMFThroughput. Total number of bytes passing through all streaming AMF endpoints.
- StreamingHTTPThroughput. Total number of bytes passing through all streaming HTTP endpoints.
- Sequence Manager.
- AssociationCount. Number of objects associated by the manager.
- FillCount. Number of objects created by the manager.
- ClientCount. Number of clients connected to the manager.
- SMOSequenceCount. Number of SMOs (Service Message Objects) processed by the manager.
- ItemCount. Number of objects currently being handled by the manager.
- Throttle Manager. Statistics for messages whose throughput has been throttled.
- ClientIncomingMessageThrottleCount. Number of incoming client messages that have been throttled.
- ClientIncomingMessageThrottleFrequency. Number of incoming client messages that have been throttled per minute.
- ClientOutgoingMessageThrottleCount. Number of outgoing client messages that have been throttled.
- ClientOutgoingMessageThrottleFrequency. Number of outgoing client messages that have been throttled per minute.
- DestinationIncomingMessageThrottleCount. Number of incoming destination messages that have been throttled.
- DestinationIncomingMessageThrottleFrequency. Number of incoming destination messages that have been throttled per minute.
- DestinationOutgoingMessageThrottleCount. Number of outgoing destination messages that have been throttled.
- DestinationOutgoingMessageThrottleFrequency. Number of outgoing destination messages that have been throttled per minute.
- FlexClientManager. Counters for Flex clients.
- FlexClientCount. Current number of Flex clients connected to the server.