Oracle Application Server 10.1.3
Configuration
Before using an Oracle Application Server monitor, several of the Oracle Application Server jars must be installed in NeoLoad jmxlib/oas directory.
Copy the following files from the Oracle Application Server directory to <neoload>jmxlib/oas directory:
- <oas>/lib/dms.jar
- <oas>/opmn/lib/optic.jar
- <oas>/j2ee/<your-instance>/oc4jclient.jar
- <oas>/j2ee/<your-instance>/lib\adminclient.jar
- <oas>/j2ee/<your-instance>/lib\ejb.jar
- <oas>/j2ee/<your-instance>/lib\oc4j-internal.jar
After copying the files, it is unnecessary to restart NeoLoad. The files are automatically synchronized with the Monitoring Agent once the changes have been made.
- Warning: Several versions of the application server (development versions) do not contain these files. These files are embedded on Companion CD of application server or available for download on the Oracle website (select then Administrative Client Utility).
Supported versions
This monitor allows NeoLoad to access Oracle Application Server 10g 10.1.3 and higher.
Connection settings
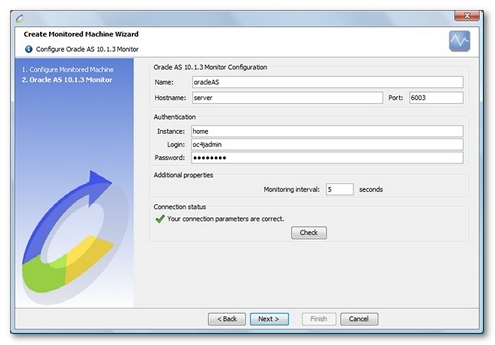
Defining a connection to an Oracle Application Server requires the name or IP address of the machine to be monitored, as well as the connection port (the default port is 6003). The application server connection port is configured in the file: <Server>/opmn/conf/opmn.xml,
<notification-server> <port local="6100" remote="6200" request="6003" /> ... </notification-server>
A valid user account must be provided in addition to these settings (same as the one used for connecting to the Oracle Application Server Management Console).
If the Oracle Application Server is being monitored from behind a firewall, the following ports must be opened:
- 6003 (configurable in the opmn/conf/opmn.xml file, line: <notification-server> <port local="6100" remote="6200" request="6003" />)
- 12401 (configurable in the opmn/conf/opmn.xml file, line: <port id="rmi" range="12401-12500"/>)
- To create a different account to oc4jadmin with administrator privileges on the application server:
- Connect to the server management interface. The default URL is: http://<server>:8888/em
- Select the instance to be monitored.
- Click on the Administration tab.
- Select the Security > Security Providers task.
- Click Instance Level Realm.
- Select the Realms tab.
- In the Security Provider Attributes section, click on the number of realm users.
- Select the user to be used for monitoring.
- In the available roles, select "ascontrol_admin" and "oc4j-administrators" and add them to the user.
- Click Apply.
- Re-start the application server.
Create an Oracle Application Server 10.1.3 monitor
NeoLoad makes it possible to create a new monitor either using the monitored machine creation wizard, as described in Create and configure a monitored machine, or from an existing monitored machine, as described in Create and configure a monitor.

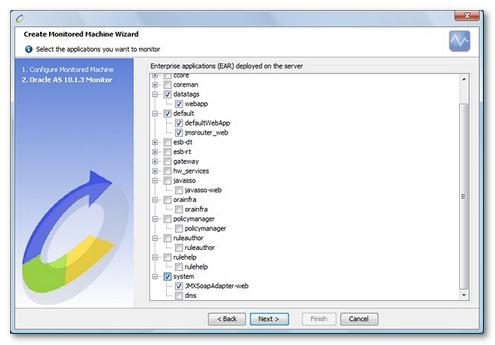
NeoLoad displays a list of the EARs (Enterprise Archive) and WARs (Web Application archive) deployed on the configured server. It then automatically selects the most appropriate counters for each of the selected applications.

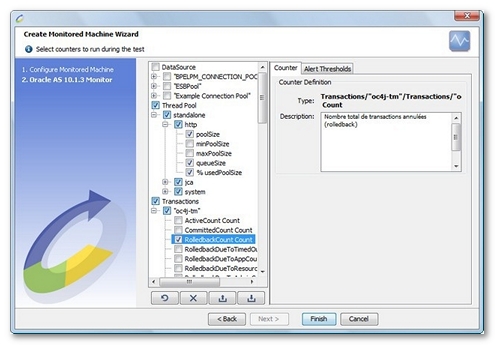
Available counters

- DataSource. Provides data source connection pool information for each data source.
- UseTime. Use time of a connection.
- WaitTime. Waiting time for an available connection.
- CloseConnectionCount. Closed connection count.
- CreateConnectionCount. Created connection count.
- FreePoolSize. Number of available connections in the pool.
- PoolSize. Total number of connections (available and used).
- WaitingThreadCount. Number of threads waiting for an available connection.
- % UsedPoolSize. Percent of pooled connections used.
- ThreadPool. Monitors thread pool information for each pool.
- PoolSize. Number of threads in the pool.
- QueueSize. Number of tasks waiting for an available thread.
- % usedPoolSize. Percent of pooled threads used.
- Transactions. Monitors transactions for the whole server.
- ActiveCount. Total count of active transactions. A consistently high value can indicate a heavy load on a server.
- CommitedCount. Total count of transactions which have committed.
- RolledbackCount. Total count of transactions that have rolled back.
- RolledbackDueToTimedOutCount. Total count of transactions that have rolled back due to timeout.
- RolledbackDueToAppCount. Total count of transactions that have rolled back due to the application calling setRollbackOnly or rollback explicitly.
- RolledbackDueToResourceCount. Total count of transactions that have rolled back due to and error in an enlisted resource.
- RolledbackDueToAdminCount. Total count of transactions that have rolled back due to administrative action.
- A high value here suggests that the system or application may not be automated enough; for example, too much system administration in general or inadequate handling of transaction architecture, or a particular issue has occurred which required extensive administration.
- RolledbackExceptionCount. Total count of RolledBackExceptions encountered.
- HeurisitcMixedExceptionCount. Total count of HeuristicMixedExceptions encountered.
- HeurisitcRollbackExceptionCount. Total count of HeurisitcRollbackExceptions encountered.
- SecurityExceptionCount. Total count of SecurityExceptions encountered.
- IllegalStateExceptionCount. Total count of IllegalStateExceptions encountered.
- SystemExceptionCount. Total count of SystemExceptions encountered.
- HeuristicCommitedCount. Total count of heuristically committed transactions.
- HeuristicRolledbackCount. Total count of heuristically rolled back transactions.
- HeuristicCount. Total count of all heuristically rolled back and committed transactions. See comments for HeuristicCommittedCount and HeuristicRolledbackCount.
- PerformTransaction. Time from beginning to end of the transaction.
- AverageCommitTime. Average commit time of all transactions. This is the average of the jtaresource_performTransaction values. This is a mean average however, so there may be spikes in the system indicating other issues as well.
- SinglePhaseCommitCompletion. Time required for a one-phase commit completion.
- TwoPhaseCommitCompletion. Time required for a two-phase commit completion.
- TransactionSuspended. Time transaction has been suspended.
- RollbackCompletion. Time required for a rollback completion.
- % RolledbackCount. Percent of rolled back transactions.
- JMS.
- ActiveConnections. Number of active connections on the JMS server.
- ActiveHandlers. Number of active handlers on the JMS server.
- MessageCommited Count. Number of committed messages.
- MessageRolledBack Count. Number of rolled back messages.
- MessageCount. Number of messages (committed and rolled back).
- MessageDequeued Count. Number of dequeued messages.
- MessageEnqueued Count. Number of enqueued messages.
- MessageDiscarded Count. Number of discarded messages.
- MessageExpired Count. Number of expired messages.
- MessagePagedIn Count. Number of paged in messages.
- MessagePagedOut Count. Number of paged out messages.
- MessageRecovered Count. Number of recovered messages.
- PendingMessage Count. Number of pending messages.
- WebModule. Monitors web modules on the server.
- ResolveServletTime. Total time spent to create/locate servlet instances (within the servlet context). This includes the time for any required authentication.
- ResolveServletActive. Number of active servlet resolve requests.
- ProcessRequestTime. Total time spent servicing this application web requests.
- ProcessRequestActive. Number of threads servicing web requests.
- SessionActivationTime. Total time for which sessions have been active.
- SessionActivationActive. Number of active sessions.
- JVM. Monitors the VMs on the server.
- UpTime. Total elapsed time since VM start.
- HeapSize. VM heap size in kilobytes.
- FreeHeapSize. Free VM heap size in kilobytes.
- ActiveThreads. Current number of VM active threads.
- Version. Version of the JVM used by the server.
- % UsedHeapSize. Percent of used VM heap size.
- EJB. Monitors the activity for each EJB. EJBs are divided into three types: StatefulSessionBean, StatelessSessionBean and MessageDrivenBean.
- CreateCount. Number of create invocations since last call.
- RemoveCount. Number of remove invocations since last call.
- MethodReadyCount. Number of session bean methods whose state is Ready.
- PassiveCount. Number of instances that have been passivated (beans that have been serialized by the application server).
Method calls for each EJB can be monitored.