Tomcat 5.5/6.0/7.0/8.0
Configuration
Before using a Tomcat monitor, it is required to enable JMX monitoring on the Tomcat server.
The list of options and how to configure JMX Remote in Java 5 can be found on the Sun website.
- To install the Tomcat monitor
- Add the following parameters to the Tomcat startup script:
- On Linux:
export CATALINA_OPTS="-Dcom.sun.management.jmxremote -Dcom.sun.management.jmxremote.port=9004 -Dcom.sun.management.jmxremote.ssl=false -Dcom.sun.management.jmxremote.authenticate=false"
- On Windows:
set CATALINA_OPTS=-Dcom.sun.management.jmxremote -Dcom.sun.management.jmxremote.port=9004 -Dcom.sun.management.jmxremote.ssl=false -Dcom.sun.management.jmxremote.authenticate=false
- On Linux:
- To include authentication, add and configure the following parameters:
-Dcom.sun.management.jmxremote.authenticate=true -Dcom.sun.management.jmxremote.password.file=../conf/jmxremote.password -Dcom.sun.management.jmxremote.access.file=../conf/jmxremote.access \
- Edit the access allow file $CATALINA_BASE/conf/jmxremote.access :
MonitorRole readonly
controlRole readwrite
- Edit the password file $CATALINA_BASE/conf/jmxremote.password :
MonitorRole tomcat
controlRole tomcat
- Tip: The password file must be read-only and not be accessible to any other user! Remove access rights to this file for all other users under Windows.
Connection settings
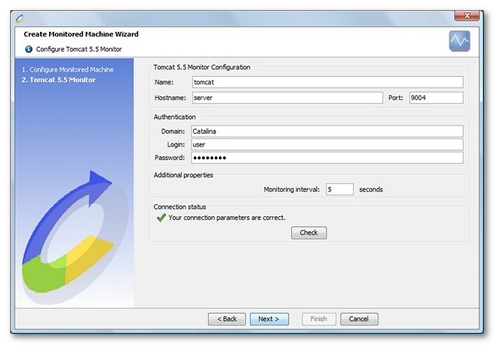
Defining a monitor to a Tomcat server requires the name or IP address of the machine to be monitored, as well as the connection port (the default port is 9004). In addition to these settings, a valid user account must be provided if authentication is enabled.
Create a Tomcat monitor
NeoLoad makes it possible to create a new Monitor either using the monitored machine creation wizard, as described in Create and configure a monitored machine, or from an existing monitored machine, as described in Create and configure a monitor.

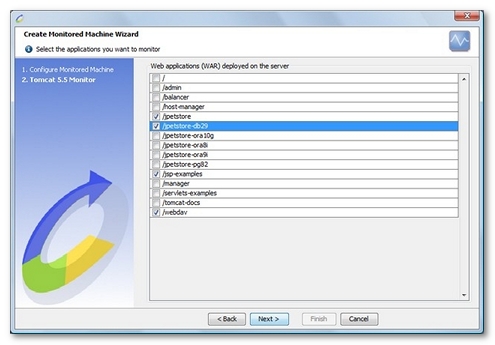
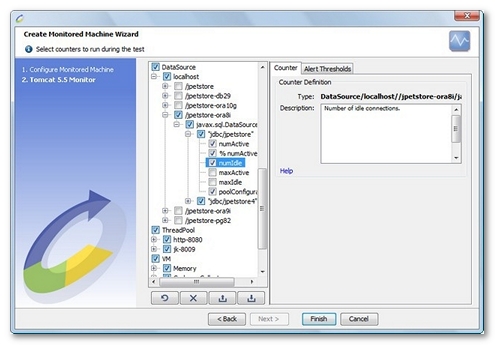
NeoLoad displays a list of the WARs (web application resources) deployed on the configured server. It then automatically selects the most appropriate counters for each of the selected applications.

Available counters

- Cache. This section allows monitoring the cache for each application.
- cacheSize. Current cache size in KB.
- hitsCount. Number of cache hits since last call.
- accessCount. Number of accesses to the cache since last call.
- Session. This section allows monitoring the sessions for each application.
- activeSessions. Number of active sessions at this moment.
- sessionCounter. Number of sessions created by this manager since last call.
- maxActive. Maximum number of active sessions so far.
- sessionMaxAliveTime. Longest time an expired session had been alive.
- sessionAverageAliveTime. Average time an expired session had been alive.
- rejectedSessions. Number of sessions tomcat rejected since last call due to maxActive being reached.
- % rejectedSessions. Percentage of tomcat sessions rejected since last call due to maxActive being reached.
- expiredSessions. Number of sessions that expired (does not include explicit invalidations) since last call.
- RequestProcessor. Provides management information on the requests processed.
- requestCount. Number of requests processed by this processor since last call.
- errorCount. Number of errors since last call.
- % errorCount. Percentage of errors since last call.
- bytesSent. Number of bytes sent by this processor since last call.
- maxTime. Longest time a request processing take.
- processingTime. Request processor processing time since last call.
- DataSource. Data source connection pool information for each data source.
- numActive. Number of active connections.
- % numActive. Percentage of active connections.
- numIdle. Number of idle connections.
- maxActive. Maximum number of active connections so far.
- maxIdle. Maximum number of idle connections so far.
- poolConfiguration. Textual description of data source pool configuration.
- ThreadPool. Monitors connection pool information for each pool.
- currentThreadsBusy. Number of busy threads in the pool.
- % currentThreadsBusy. Percentage of busy threads in the pool.
- currentThreadCount. Number of threads in the pool.
- maxThreads. Maximum number of threads in the pool.
- threadsConfiguration. Textual description of connection pool configuration.
- VM. JVM counters. Since Tomcat 5.5/6.0 is launched in a 1.5 VM, the following VM counters are provided:
- Memory. The Java virtual machine has a heap that is the runtime data area from which memory for all class instances and arrays are allocated. It is created at the Java virtual machine start-up. Heap memory for objects is reclaimed by an automatic memory management system which is known as a garbage collector. The heap may be of a fixed size or may be expanded and shrunk.
- Used. Represents the amount of memory currently used (in bytes).
- % Used. Represents the percentage amount of memory currently used.
- Committed. Represents the amount of memory (in bytes) that is guaranteed to be available for use by the Java virtual machine. The amount of committed memory may change over time (increase or decrease). The Java virtual machine may release memory to the system and committed could be less than init. committed will always be greater than or equal to used.
- Max. Represents the maximum amount of memory (in bytes) that can be used for memory management. Its value may be undefined. The maximum amount of memory may change over time if defined. The amount of used and committed memory will always be less than or equal to max if max is defined. A memory allocation may fail if it attempts to increase the used memory such that used > committed even if used <= max would still be true (for example, when the system is low on virtual memory).
- Garbage Collector. Garbage collection is the process that the Java virtual machine uses to find and reclaim unreachable objects to free up memory space. The Sun JVM defines garbage collection in two modes: Minor 'copy' and major 'MarkSweepCompact', .A minor collection runs relatively quickly and involves moving live data around the heap in the presence of running threads. A major collection is a much more intrusive garbage collection that suspends all execution threads while it completes its task. The following counters are available for both modes:
- CollectionCount. Returns the number of collections that have occurred since last call.
- CollectionTime. Returns the approximate accumulated collection elapsed time in milliseconds since last call.
- Threads. Information on the thread system of the Java virtual machine.
- ThreadCount. Returns the current number of live threads including both daemon and non-daemon threads.
- DaemonThreadCount. Returns the current number of live daemon threads.
- PeakThreadCount. Returns the peak live thread count since the Java virtual machine started or peak was reset.
- Description. Textual description about the server.
- JVM. Textual description for the Java Runtime running Tomcat server.
- Host. Textual description about operating system and server hardware.
- Memory. The Java virtual machine has a heap that is the runtime data area from which memory for all class instances and arrays are allocated. It is created at the Java virtual machine start-up. Heap memory for objects is reclaimed by an automatic memory management system which is known as a garbage collector. The heap may be of a fixed size or may be expanded and shrunk.