WebLogic 9/10/11/12c
Configuration
Before using the WebLogic monitor, WebLogic server jars must be installed in NeoLoad.
- From the WebLogic directory, copy the following files:
- <weblogic>/server/lib/wlclient.jar
- <weblogic>/server/lib/wljmxclient.jar
- Paste the files in the directory below where XX stands for your WebLogic version:
<install-dir>/jmxlib/weblogicXX
- Restart NeoLoad.
The files are automatically synchronized with the Monitoring Agent once the changes have been made.
Connection settings
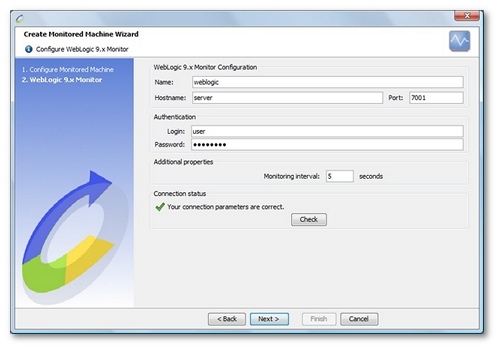
Defining a monitor to a WebLogic Administration Server domain requires the name or IP address of the machine to be monitored, as well as the connection port of the Weblogic Administration Console (the default port is 7001). In addition to these settings, a valid user account must be provided with which to connect to the WebLogic Administration Console.
WebLogic 9/10/11 monitor connects to WebLogic Administration Server, so please make sure that the WebLogic Administration Server is running. If there is only one WebLogic Server, it will automatically act as a WebLogic Administration Server domain. If there are several WebLogic servers (with or without clustering), please start up the WebLogic Administration Server domain.
Create a WebLogic 9/10/11/12c monitor
NeoLoad makes it possible to create a new monitor either using the monitored machine creation wizard, as described in Create and configure a monitored machine, or from an existing monitored machine, as described in Create and configure a monitor.

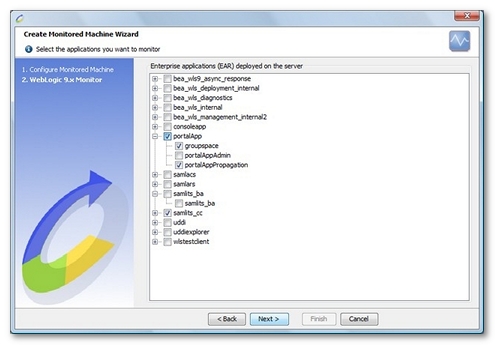
NeoLoad displays a list of the EARs (Enterprise Archive) and WARs (Web Application archive) deployed on the configured server. It then automatically selects the most appropriate counters for each of the selected applications.

Available counters

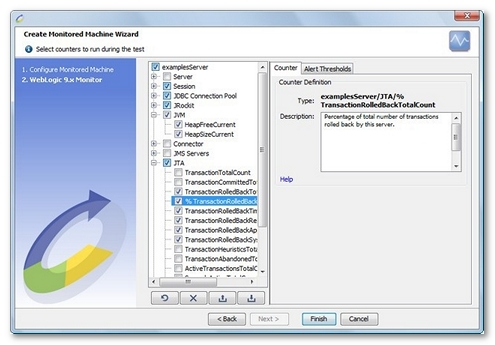
The first tree level displays all the servers running within the WebLogic Server domain. For each WebLogic server, the counters are:
- Server. This section allows monitoring the sockets open for each server.
- SocketsOpenedTotalCount. Total number of sockets opened by this server.
- OpenSocketsCurrentCount. Number of sockets currently opened by this server.
- Session. This section allows monitoring all session counters for each EAR deployed on this server, and for each WAR contained therein.
- OpenSessionsCurrentCount. Current total number of open sessions in this module.
- OpenSessionsHighCount. Highest number of open sessions in this module. The count starts at zero each time the module is activated.
- SessionsOpenedTotalCount. Total number of sessions opened in this module.
- JDBC Connection Pool. This section allows monitoring the JDBC connection pool counters. The counters are available for each connection pool of this server.
- ActiveConnectionsCurrentCount. Number of physical database connections from this instance of the connection pool currently in use.
- WaitingForConnectionCurrentCount. Current number of application requests waiting for a connection.
- NumUnavailable. Number of connections currently unavailable to applications because the connection is being tested or refreshed.
- ActiveConnectionsAverageCount. Average number of active connections in this instance of the JDBC connection pool.
- ConnectionDelayTime. Average time taken, in milliseconds, to create a physical database connection. The time is calculated as the sum of the time taken to create all physical database connections in the connection pool, divided by the total number of connections created.
- ActiveConnectionsHighCount. Highest number of active database connections in this instance of the connection pool since the connection pool was instantiated. Active connections are connections in use by an application.
- ConnectionsTotalCount. Total number of database connections created in this instance of the connection pool since the connection pool was instantiated.
- CurrCapacity. Current number of database connections in this instance of the connection pool. The number includes available connections, connections in use by applications, and connections unavailable for testing.
- % CurrCapacity. Percentage of database connections in this instance of the connection pool.
- FailuresToReconnectCount. Number of times this instance of the connection pool attempted to refresh a connection to a database and failed. Failures occur when the database is unavailable or when the network fails.
- HighestNumUnavailable. Highest number of unavailable connections in this instance of the connection pool since the connection pool was instantiated.
- MaxCapacity. Maximum number of database connections this connection pool can contain.
- WaitSecondsHighCount. Highest number of seconds an application waited for a connection from this instance of the connection pool since the connection pool was instantiated.
- WaitingForConnectionHighCount. Highest number of application requests concurrently waiting for a connection from this instance of the connection pool.
- JRockit. This section allows monitoring the runtime counters for each server instance on the JRockit Virtual Machine. The following counters are presented for each server:
- AllProcessorsAverageLoad. Average load of all processors in the host machine.
Information: This value is between 0 and 1 where 1 represents 100% load (no idle time) and 0 represents 0% load (pure idle time).
- JvmProcessorLoad. The load that this Virtual Machine is placing on all processors in the host machine. If the host contains multiple processors, this is a snapshot of the average load.
Information: This value is between 0 and 1 where 1 represents 100% load (no idle time) and 0 represents 0% load (pure idle time).
- HeapFreeCurrent. Current amount of memory (in bytes) that is available in this Virtual Machine.
- HeapSizeCurrent. Current size (in bytes) of this Virtual Machine
- FreeHeap. Amount (in bytes) of Java heap memory that is currently free in this Virtual Machine.
- UsedHeap. Indicates the amount (in bytes) of Java heap memory that is currently being used by the Virtual Machine.
- % UsedHeap. Percentage of amount of Java heap memory that is currently being used by the Virtual Machine.
- TotalHeap. Amount (in bytes) of memory currently allocated to this Virtual Machine Java heap.
- FreePhysicalMemory. Amount (in bytes) of physical memory that is currently free on the host computer.
- UsedPhysicalMemory. Amount (in bytes) of physical memory that is currently being used on the host computer. The value describes the memory that is being used by all processes on the computer, not just by this Virtual Machine.
- TotalPhysicalMemory. Amount (in bytes) of physical memory on the host computer. The value does not include memory that the operating system makes available through swap space on a disk or other types of virtual memory.
- NumberOfDaemonThreads. Number of daemon Java threads currently running in this Virtual Machine across all processors.
- NumberOfProcessors. Number of processors on this Virtual Machine host machine. If this is not a Symmetric Multi Processor (SMP) system, the value will be 1.
- TotalGarbageCollectionCount. Number of garbage collection runs that have occurred since this Virtual Machine was started.
- TotalGarbageCollectionTime. Number of milliseconds that this Virtual Machine has spent on all garbage collection runs since the Virtual Machine was started.
- TotalNumberOfThreads. Number of Java threads (daemon and non-daemon) that are currently running in this Virtual Machine across all processors.
- TotalNurserySize. Amount (in bytes) of memory that is currently allocated to the nursery. Without a generational garbage collector, the nursery size is 0.
- AllProcessorsAverageLoad. Average load of all processors in the host machine.
- JVM. This section allows the user to collect information for each server on the Java Virtual Machine. The available counters are:
- HeapFreeCurrent. Available memory in bytes for this Virtual Machine.
- HeapSizeCurrent. Total memory size in bytes for this Virtual Machine.
- Connector. A connector component (also called a resource adapter) is a system-level software driver used by an application server such as WebLogic Server to connect to an EIS. A resource adapter serves as the J2EE connector. The WebLogic J2EE Connector Architecture supports resource adapters developed by Enterprise Information Systems (EISes) vendors and third-party application developers that can be deployed in any application server supporting the Sun Microsystems J2EE Platform Specification, Version 1.3. Resource adapters contain the Java, and if necessary, the native components required to interact with the EIS.
- ConnectionPoolsTotalCount. Total size of the connection pool.
- ConnectionPoolCurrentCount. Size of connection pool at the time of the Monitor query.
- JMS Servers. This section allows monitoring the JMS runtime counters for all JMS Servers both globally and for each server instance.
- Total. This section allows monitoring JMS counters for all JMS Servers of this WebLogic server.
- ConnectionsCurrentCount. Current number of connections for all JMS Server.
- ConnectionsHighCount. Highest number of connections to this server since the last reset.
- ConnectionsTotalCount. Total number of connections made to this server since the last reset.
- JMSServersCurrentCount. Current number of JMS servers deployed on this WebLogic Server instance.
- JMSServersHighCount. Highest number of JMS servers deployed on this WebLogic Server instance since this server was started.
- JMSServersTotalCount. Total number of JMS servers deployed on this WebLogic Server instance since this server was started.
- Servers. This section allows monitoring each JMS Server of this WebLogic server.
- DestinationsCurrentCount. Number of current destinations for this JMS server.
- DestinationsHighCount. Highest number of destinations on this JMS server since the last reset.
- DestinationsTotalCount. Number of destinations instantiated on this JMS server since the last reset.
- MessagesCurrentCount. Number of messages currently stored on this JMS server. This number does not include the pending messages.
- MessagesHighCount. Highest number of messages stored in the JMS server since the last reset.
- MessagesPendingCount. Number of messages currently pending (unacknowledged or uncommitted) stored on this JMS server. Pending messages are over and above the current number of messages.
- MessagesReceivedCount. Number of messages received on this destination since the last reset.
- SessionPoolsCurrentCount. Number of session pools currently instantiated on this JMS server.
- SessionPoolsHighCount. Highest number of session pools instantiated on this JMS server since the last reset.
- SessionPoolsTotalCount. Number of session pools instantiated on this JMS server since the last reset.
- Total. This section allows monitoring JMS counters for all JMS Servers of this WebLogic server.
- JTA. This section allows monitoring the transaction counters for this WebLogic server. All values are calculated per interval.
- TransactionTotalCount. Total number of transactions processed by this server.
- TransactionCommittedTotalCount. Total number of transactions committed by this server.
- TransactionRolledBackTotalCount. Total number of transactions rolled back by this server.
- TransactionRolledBackTimeoutTotalCount. Number of transactions rolled back by this server due to a timeout expiration.
- TransactionRolledBackResourceTotalCount. Number of transactions rolled back by this server due to a resource error.
- TransactionRolledBackAppTotalCount. Number of transactions rolled back by this server due to an application error.
- TransactionRolledBackSystemTotalCount. Number of transactions rolled back by this server due to an internal system error.
- TransactionHeuristicsTotalCount. Total number of transactions completed with a heuristic status.
- TransactionAbandonedTotalCount. Total number of transactions abandoned by this server.
- ActiveTransactionsTotalCount. Number of active transactions on this server.
- SecondsActiveTotalCount. Average amount of time (in milliseconds) that transactions coordinated by this server have taken to commit.
- Queue. This section allows monitoring counters for each WebLogic Queue of this WebLogic Server.
- PendingRequestCurrentCount. Number of waiting requests in the queue.
- ExecuteThreadTotalCount. Total number of execute threads assigned to the queue.
- ServicedRequestTotalCount. Number of requests that have been processed by the queue.
- ExecuteThreadCurrentIdleCount. Number of idle threads assigned to the queue.
- EJB. This section allows monitoring all instances, transactions and cache counters for each EAR deployed on this server, and for each EJB contained therein
- Pool. Monitors EJB instances for Entity Beans, MessageDriven Beans and Stateless Beans.
- AccessTotalCount. Total number of times an attempt was made to get an instance from the free pool.
- BeansInUseCurrentCount. Number of bean instances currently being used from the free pool.
- DestroyedTotalCount. Total number of times a bean instance from this pool was destroyed due to a non-application exception being thrown from it.
- MissTotalCount. Total number of times a failed attempt was made to get an instance from the free pool. An Attempt to get a bean from the pool will fail if there are no available instances in the pool.
- PooledBeansCurrentCount. Number of currently available bean instances in the free pool.
- TimeoutTotalCount. Total number of threads that have timed out waiting for an available bean instance from the free pool.
- WaiterCurrentCount. Number of threads currently waiting for an available bean instance from the free pool.
- Transaction. Monitors transaction counters for Entity Beans, MessageDriven Beans, Stateless Beans and Stateful Beans
- TransactionsCommittedTotalCount. Total number of transactions that have been committed for this EJB.
- TransactionsRolledBackTotalCount. Total number of transactions that have been rolled back for this EJB.
- TransactionsTimedOutTotalCount. Total number of transactions that have timed out for this EJB.
- Cache. Monitors cache counters for Entity Beans and Stateful Beans.
- ActivationCount. Total number of beans from this EJB that have been activated (beans that have been de-serialized by the application server).
- CacheAccessCount. Total number of attempts to access a bean from the cache.
- CachedBeansCurrentCount. Total number of beans from this EJB currently in the EJB cache.
- CacheMissCount. Total number of times an attempt to access a bean from the cache failed.
- PassivationCount. Total number of beans from this EJB that have been passivated (beans that have been serialized by the application server).
- Pool. Monitors EJB instances for Entity Beans, MessageDriven Beans and Stateless Beans.
- Thread. Monitors thread pool information for the WebLogic Server.
- CompletedRequestCount. Number of completed requests in the priority queue.
- ExecuteThreadIdleCount. Number of idle threads in the pool. This count does not include standby threads and stuck threads. The count indicates threads that are ready to pick up new work when it arrives.
- ExecuteThreadTotalCount. Total number of threads in the pool.
- HoggingThreadCount. Number of threads that are being hogged by a request right now. These threads will either be declared as stuck after the configured timeout or will return to the pool before that. The self-tuning mechanism will backfill if necessary.
- MinThreadsConstraintsCompleted. Number of requests with min threads constraint picked up out of order for execution immediately since their min threads requirement was not met. This does not include the case where threads are idle during schedule.
- MinThreadsConstraintsPending. Number of requests that should be executed now to satisfy the min threads requirement.
- PendingUserRequestCount. Number of pending user requests in the priority queue. The priority queue contains requests from internal subsystems and users. This is just the count of all user requests.
- QueueLength. Number of pending requests in the priority queue. This is the total of internal system requests and user requests.
- StandbyThreadCount. Number of threads in the standby pool. Surplus threads that are not needed to handle the present work load are designated as standby and added to the standby pool. These threads are activated when more threads are needed.
- Throughput. Mean number of requests completed per second
- Channel. This section allows monitoring the channels (network access points from the WebLogic Server). The counters are available for each channel.
- AcceptCount. Number of sockets that have been accepted on this channel. This includes sockets both past and present so gives a good idea of the connection rate to the server.
- ConnectionsCount. Number of active connections and sockets associated with this channel.
- MessagesReceivedCount. Number of messages received on this channel.
- MessagesSentCount. Number of messages sent on this channel.
- Description. Textual description about the server.
- JVM or JRockit.
- Version. Textual description for the Java Runtime running WebLogic server.
- OS. Textual description of operating system running WebLogic server.
- JVM or JRockit.