PostgreSQL
Supported versions
NeoLoad supports most common PostgreSQL Database server versions: 6.x, 7.x, 8.x and 9.x.
Connection settings
PostgreSQL monitors allow monitoring a PostgreSQL database server. The counters are sorted by category: connections, read rates, query cache usage, and so on.
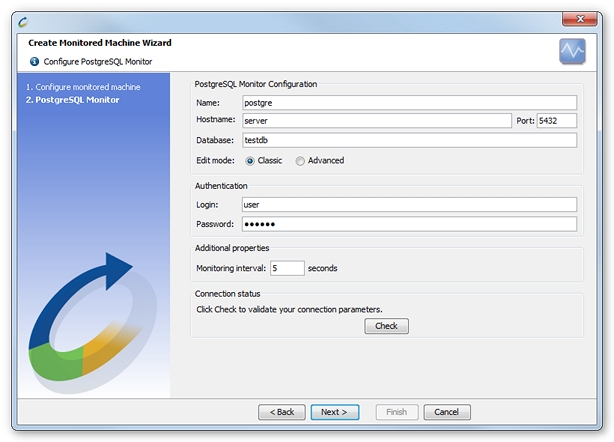
This monitor executes SQL requests on the database to obtain status data and system variables. To perform the monitoring, NeoLoad requires an account with authorization to connect to the database and to read and collect global status data and variables.
NeoLoad monitors the PostgreSQL server using the JDBC protocol. The JDBC driver is included in the NeoLoad software package and requires no particular installation or settings.
NeoLoad monitors the PostgreSQL server using the JDBC protocol:
- Classic edit mode: The JDBC driver is included in the NeoLoad software package. The default connection port set by NeoLoad is 5432, the standard JDBC port.
- Advanced edit mode: A specific JDBC connection URL provides extra connection settings to the JDBC driver, such as timeout, cluster handling, and so on.
Example of a PostgreSQL JDBC URL:
jdbc:postgresql://myserver:5432/mydatabase?loginTimeout=3000
Create a PostgreSQL monitor
NeoLoad makes it possible to create a new monitor either using the monitored machine creation wizard, as described in Create and configure a monitored machine, or from an existing monitored machine, as described in Create and configure a monitor.

Available counters

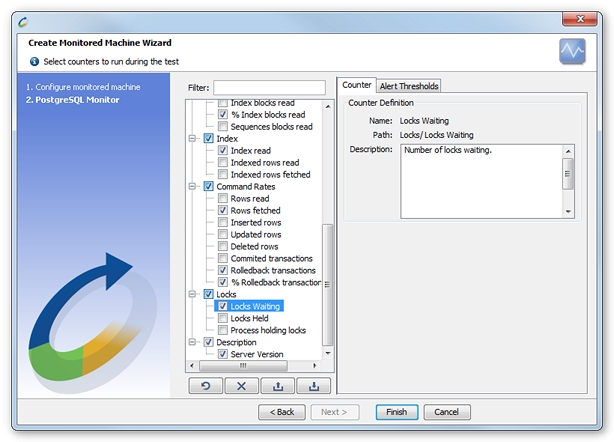
- Connections.
- Current connections. The number of currently open connections.
- Connections executing requests. The number of currently open connections that are executing requests.
- Idle connections. The number of currently idle connections.
- Max connections. The maximum number of concurrent connections to the database server.
- Used connections. Connections used as a percentage of maximum connections.
- Buffers.
- Shared buffers size. Current size of shared buffers.
- Disk cache size. Current size of disk cache buffer.
- Sort buffer size. Current size of sort buffer.
- Work buffer size. Current size of working requests buffer.
- Temp buffer size. Current size of temporary buffer.
- IO Requests.
- Blocks read. Number of blocks directly read on disk.
For optimal performance this value should be the smallest possible. If the database has to execute too many disk accesses, performance will suffer. - Index blocks read. Number of index blocks directly read on disk.
- % Index blocks read. Percentage of index blocks directly read on disk.
- Sequence blocks read. Number of sequence blocks directly read on disk.
- Blocks read. Number of blocks directly read on disk.
- Cache.
- Blocks read. Number of cached blocks read.
- Index blocks read. Number of cached index blocks read.
- % Index blocks read. Percentage of cached index blocks read.
For optimal performance, this value must be as large as possible. If an insufficient number of index blocks are declared in the table, it could negatively impact the database server performance. - Sequence blocks read. Number of cached sequence blocks read.
- Index.
- Index read. Number of reads initiated by an index.
- Indexed rows read. Number of rows read by indexed requests.
- Indexed rows fetched. Number of live rows fetched by indexed requests.
- Command Rates.
- Rows read. Number of rows read.
- Rows fetched. Number of rows fetched.
- Inserted rows. Number of rows inserted.
- Updated rows. Number of rows updated.
- Deleted rows. Number of rows deleted.
- Committed transactions. Number of committed transactions.
- This value should be relatively stable, indicating that there are no performance-reducing load peaks. If applications do not commit often enough, it will lead to an overload on the database server.
- Rolled back transactions. Number of transactions rolled back.
- % Rolledback transactions. Percentage of transactions rolled back.
- Locks.
- Locks waiting. Number of locks waiting.
- Locks held. Number of locks held.
- Process holding locks. Number of processes holding locks.
- Description.
- Server version. Current version of the PostgreSQL database server.