VMWare
Supported versions
The VMWare monitor allows monitoring any version of any VMWare system: vCenter, ESX Server or VMWare Server.
NeoLoad accesses these systems Web services using SOAP requests. The VMWare monitoring API is available on all versions of all the VMWare systems as a whole.
Connection settings
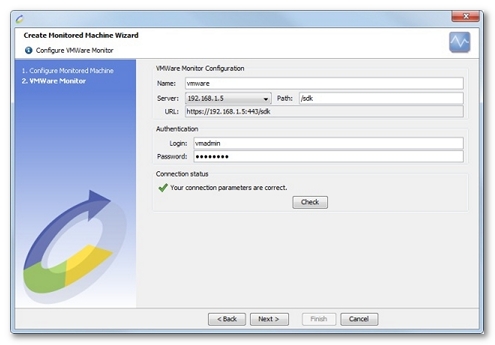
Defining a VMWare monitor requires an HTTP server (defined in the Design > Virtual Users > Servers), a path to the VMWare Web services (/sdk by default), and a user name and password for authentication (those used to connect to the VMWare management interface).
The server to be used can be created in the Servers section of the Virtual Users, or a server created during a recording can be used.
Configuration
The infrastructure for monitoring VMWare servers enables the retrieval of statistics from the various entities (hosts or virtual machines) at intervals defined on the server. By default, the shortest monitoring interval is 5 minutes. This interval can only be changed on vCenter systems.
NeoLoad automatically detects the shortest monitoring interval and sets the same monitoring interval for the created Monitor to avoid multiple retrieval of the same counter value.
Create an VMWare monitor
NeoLoad makes it possible to create a new monitor either using the monitored machine creation wizard, as described in Create and configure a monitored machine, or from an existing monitored machine, as described in Create and configure a monitor.

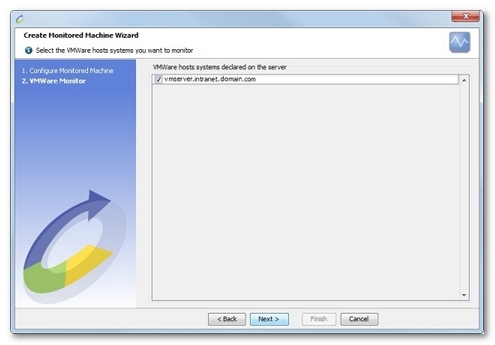
NeoLoad shows a list of the VMWare systems declared for the server. This list will only show multiple systems in the case of a Center server. In all other cases, only the system to be monitored will be listed.

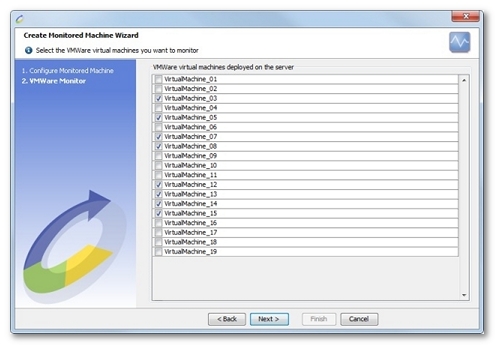
NeoLoad shows a list of VMWare virtual machines started on the previously-selected servers.

Available counters

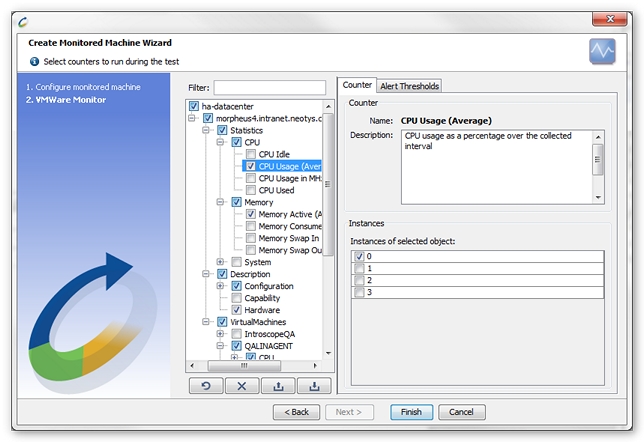
The following is a list of available counters. Not all are present on all VMWare systems (vCenter, ESX Server, VMWare Server) or VMWare virtual machines.
- CPU. Counters relating to CPU usage.
- CPU Idle. Total time the CPU spent in an idle state
- CPU Usage. CPU usage as a percentage during the interval
- CPU Usage in MHz. CPU usage, as measured in megahertz, during the interval
- CPU Used. CPU time used
- Reserved Capacity. Total CPU capacity reserved by virtual machines
- CPU Ready. Percentage of time the virtual machine was ready, but could not be scheduled to run on the physical CPU
- CPU System. Amount of time spent on system processes on each virtual CPU in the virtual machine
- CPU Wait. Total CPU time spent in wait state
- Swap wait time. CPU time spent waiting for swap-in
- Worst Case Allocation. Amount of CPU resources allocated to the virtual machine or resource pool based on the total cluster capacity and the resource configuration on the resource hierarchy
- Disk. Counters relating to disk usage.
- Disk Bus Resets. Number of SCSI-bus reset commands issued during the collection interval
- Disk Command Aborts. Number of SCSI commands aborted during the collection interval
- Disk Command Latency. Average amount of time taken during the collection interval to process a SCSI command issued by the Guest OS to the virtual machine
- Disk Command Issued. Number of SCSI commands issued during the collection interval
- Disk Read Latency. Average amount of time taken during the collection interval to process a SCSI read command issued from the Guest OS to the virtual machine
- Disk Read Rate. Average number of kilobytes read from the disk each second during the collection interval
- Disk Read Requests. Number of disk reads during the collection interval
- Disk Write Latency. Average amount of time taken during the collection interval to process a SCSI write command issued by the Guest OS to the virtual machine
- Disk Write Rate. Average number of kilobytes written to disk each second during the collection interval
- Disk Write Requests. Number of disk writes during the collection interval
- Highest Disk Latency. Highest latency value across all disks used by the host
- Kernel Disk Command Latency. Average amount of time, in milliseconds, spent by VMkernel processing each SCSI command
- Kernel Disk Read Latency. Average amount of time, in milliseconds, spent by VMkernel processing each SCSI read command
- Kernel Disk Write Latency. Average amount of time, in milliseconds, spent by VMkernel processing each SCSI write command
- Physical Device Command Latency. Average amount of time, in milliseconds, to complete a SCSI command from the physical device
- Physical Device Read Latency. Average amount of time, in milliseconds, to complete read from the physical device
- Physical Device Write Latency. Average amount of time, in milliseconds, to write to the physical device
- Queue Command Latency. Average amount of time spent in the VMkernel queue, per SCSI command, during the collection interval
- Queue Read Latency. Average amount of time taken during the collection interval per SCSI read command in the VMkernel queue
- Queue Write Latency. Average amount time taken during the collection interval per SCSI write command in the VMkernel queue
- Management Agent. System resources used by the Service Console.
- Memory Swap In. Amount of memory that is swapped in for the Service Console
- Memory Swap Out. Amount of memory that is swapped out for the Service Console
- Memory Swap Used. Sum of the memory swapped by all powered-on virtual machines on the host
- Memory Used. Amount of total configured memory that is available for use
- Memory. Counters relating to memory usage.
- Memory Active. Amount of memory that is actively used, as estimated by VMkernel based on recently touched memory pages
- Memory Balloon. Amount of memory allocated by the virtual machine memory control driver (vmmemctl), which is installed with VMWare Tools
- Memory Balloon Target. Target value set by VMkernel for the virtual machine memory balloon size
- Memory Consumed. Amount of memory consumed by a virtual machine, host, or cluster
- Memory Granted. Amount of machine memory or physical memory that is mapped for a virtual machine or a host
- Memory Heap. VMkernel virtual address space dedicated to VMkernel main heap and related data
- Memory Heap Free. Free address space in the VMkernel main heap
- % Memory Heap Free. Percent of free address space in the VMkernel main heap
- Memory Overhead. Amount of machine memory allocated to a virtual machine beyond its reserved amount
- Memory Shared. Amount of guest memory that is shared with other virtual machines, relative to a single virtual machine or to all powered-on virtual machines on a host
- Memory Shared Common. Amount of machine memory that is shared by all powered-on virtual machines and vSphere services on the host
- Memory State. One of four threshold levels representing the percentage of free memory on the host. The counter value determines swapping and ballooning behavior for memory reclamation.
- Memory Swap In. Amount swapped-in to memory from disk
- Memory Swap In Rate. Rate at which memory is swapped from disk into active memory during the interval
- Memory Swap Out. Amount of memory swapped-out to disk
- Memory Swap Out Rate. Rate at which memory is being swapped from active memory to disk during the current interval
- Memory Swap Used. Amount of memory that is used by swap
- Memory Swap Target. Target size for the virtual machine swap file
- Memory Swapped. Current amount of guest physical memory swapped out to the virtual machine swap file by the VMkernel
- Memory Unreserved. Amount of memory that is unreserved
- Memory Used by VMkernel. Amount of machine memory used by VMkernel for core functionality, such as device drivers and other internal uses
- Memory Zero. Memory that contains 0s only
- Worst Case Allocation. Memory allocation as calculated by the VMkernel scheduler based on current estimated demand and reservation, limit, and shares policies set for all virtual machines and resource pools in the host or cluster
- Network. Counters relating to network adapter usage.
- Network Data Receive Rate. Average rate at which data was received during the interval
- Network Data Transmit Rate. Average rate at which data was transmitted during the interval
- Network Packets Received. Number of packets received during the interval
- Network Packets Transmitted. Number of packets transmitted during the interval
- Network Usage. Network utilization (combined transmit- and receive-rates) during the interval
- droppedRx. Number of receive packets dropped during the collection interval
- % droppedRx. Percent of receive packets dropped during the collection interval
- droppedTx. Number of transmit packets dropped during the collection interval
- % droppedTx. Percent of transmit packets dropped during the collection interval
- Resource Group CPU.
- CPU Active. CPU Active over specified interval
- CPU Running. CPU running average over specified interval
- CPU Throttled. Amount of CPU resources over the limit that were refused
- Group CPU Sample Count.
- Group CPU Sample Period.
- System. VMWare system counters.
- Disk Usage. Amount of disk space usage for each mount point
- Resource CPU Usage. Amount of CPU used during the interval by the Service Console and other applications
- Resource CPU active. CPU active average over specified interval of the system resource group
- Resource CPU allocation maximum (in MHz). CPU allocation limit (in MHz) of the system resource group
- Resource CPU allocation minimum (in MHz). CPU allocation reservation (in MHz) of the system resource group
- Resource CPU allocation shares. CPU allocation shares of the system resource group
- Resource CPU maximum limited. CPU maximum limited over specified interval of the system resource group
- Resource CPU running. CPU running average over specified interval of the system resource group
- Resource memory allocation maximum. Memory allocation limit (in KB) of the system resource group
- Resource memory allocation minimum. Memory allocation reservation (in KB) of the system resource group
- Resource memory allocation shares. Memory allocation shares of the system resource group
- Resource memory mapped. Memory mapped by the system resource group
- Resource memory overhead. Overhead memory consumed by the system resource group
- Resource memory share saved. Memory saved due to sharing by the system resource group
- Resource memory shared. Memory shared by the system resource group
- Resource memory swapped. Memory swapped out by the system resource group
- Resource memory touched. Memory touched by the system resource group
- Resource memory zero. Zero filled memory used by the system resource group
- Heartbeat. Number of heartbeats issued per virtual machine during the interval
- Uptime. Total time elapsed, in seconds, since last system startup
- Cluster Services.
- CPU Fairness. Fairness of distributed CPU resource allocation
- Memory Fairness. Aggregate available memory resources of all the hosts within a cluster
- Description. VMWare system text-based indicators.
- Configuration. Indicators providing information on the VMWare system configuration during the test.
- File System. Describes the file system volume information for the host.
A file system volume refers to a storage abstraction that allows files to be created and organized. A host can have multiple file system volumes. File system volumes are typically mounted into a file namespace that allows all files in mounted file systems to be addressable from the host. A file system volume is backed by disk storage. It could span one or more disks but need not use an entire disk. A file system volume by definition must be mounted on the file system in order to exist. - Network. Describes the networking host configuration.
- Offload Capabilities. Offload capabilities are used to optimize virtual machine network performance. When a virtual machine is transmitting on a network, some operations can be offloaded either to the host or to physical hardware.
- Version. Describes system information including the name, type, version, and build number.
- CPU Allocation. Specifies the reserved resource requirement as well as the limit (maximum allowed usage) for a given kind of resource. This is specified for both memory allocation (specified in MB) and CPU allocation (specified in MHz).
- Memory Allocation. Specifies the reserved resource requirement as well as the limit (maximum allowed usage) for a given kind of resource. This is specified for both memory allocation (specified in MB) and CPU allocation (specified in MHz).
- Hardware. Summarizes hardware used by the virtual machine.
- File System. Describes the file system volume information for the host.
- Guest. Indicators providing information on the guest operating system configuration during the test.
- Disk. Information about each virtual disk configured in the guest operating system.
- Network. Describes the guest network configuration.
- Version. Describes the guest operating system version.
- VMWare Tools. Describes the VMWare Tools version.
- Capability. Specifies the capabilities of the particular host.
- Hardware. Summarizes hardware used by the host.
- Configuration. Indicators providing information on the VMWare system configuration during the test.