Performance Monitoring Infrastructure (PMI)
The Performance Monitoring Infrastructure (PMI) uses a client-server architecture. The server collects performance data from various WebSphere Application Server components. A client retrieves performance data from one or more servers and processes the data.
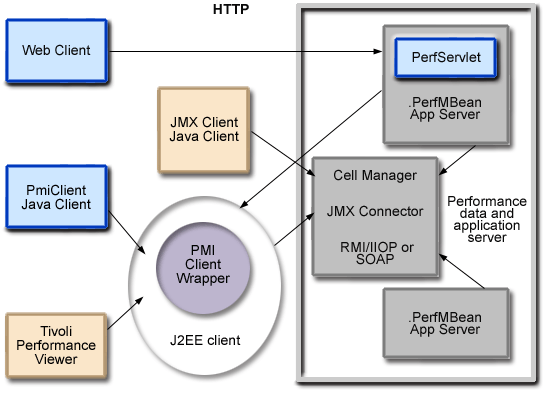
As shown in the figure, the server collects PMI data in memory. This data consists of counters such as servlet response time and data connection pool usage. The data points are then retrieved by a Web client, Java client, or JMX client. WebSphere Application Server provides a Java client called Tivoli Performance Viewer. You can also develop custom performance monitoring applications. For more information, see Develop performance monitoring applications.

The figure shows the overall PMI architecture. On the right side, the server updates and keeps PMI data in memory. The left side displays a Web client, a Java client (Tivoli Performance Viewer), and a JMX client retrieving the performance data.
Performance data organization
This topic describes the organizational structure of PMI data.Performance data classification
This topic describes the types of performance data that are available.PMI data counters
This topic provides information about the counters that provide specific performance data.