Performance data classification
Performance Monitoring Infrastructure provides server-side data collection and client-side API to retrieve performance data. Performance data includes two components: static and dynamic.
The static component consists of a name, ID, and other descriptive attributes that identify the data. The dynamic component contains information that changes over time, such as the current value of a counter and the time stamp associated with that value.
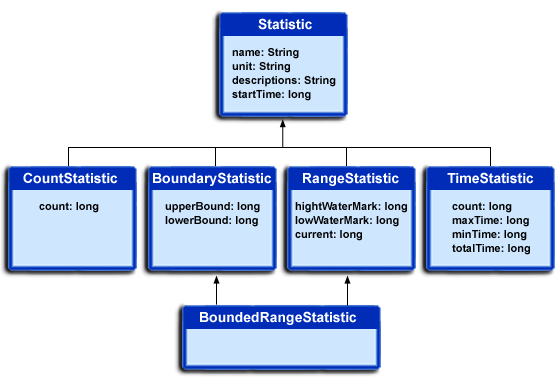
The PMI data can be one of these statistical types defined in the JSR-077 specification:
- CountStatistic
- BoundaryStatistic
- RangeStatistic
- TimeStatistic
- BoundedRangeStatistic
In general, CountStatistic data requires a low monitoring level and TimeStatistic data requires a medium monitoring level. RangeStatistic and BoundedRangeStatistic require a high monitoring level.
There are a few counters that are exceptions to this rule:
- The average method response time, the total method calls, and active methods counters require a high monitoring level.
- The Java Virtual Machine Profiler Interface (JVMPI) counters, SerializableSessObjSize, and data tracked for each individual method (method level data) require a maximum monitoring level.

In previous versions, PMI data was classified with these types:
- Numeric: (Corresponds to CountStatistic in the JSR-077 specification.) The Numeric data type contains a single numeric value that can be a long or a double. This data type is used to keep track of simple numeric data, such as counts.
- Stat: The Stat data type statistical data on a sample space, including the number of elements in the sample set, their sum, and sum of squares. You can obtain the mean, variance, and standard deviation of the mean from this data.
- Load: (Corresponds to the RangeStatistic or BoundedRangeStatistic in the JSR-077 specification.) The Load data type tracks a level as a function of time, including the current level, the time that level was reached, and the integral of that level over time. From this data, you can obtain the time-weighted average of that level. For example, this data type is used in the number of active threads and the number of waiters in a queue.
These PMI data types continue to be supported through the PMI API. Statistical data types are supported through both the PMI API and Java Management Extension (JMX) API.
The TimeStatistic type tracks many counter samples and then returns the sum, count, and average of the samples. For example it can provide an average method response time. Given the nature of this statistic type, it is also used to track non-time related counters, such as average read and write size. You can call the getUnit method on the data configuration information to learn the unit for the counter.
To reduce the impact on performance, numeric and stat data are not synchronized, because this data tracks the total and average values. Load data is very sensitive. Therefore, load counters are always synchronized. In addition, when the monitoring level of a module is set to max, all numeric data is also synchronized to guarantee accurate values. However, setting a monitoring level to max can have a negative impact on performance. As a result, it is recommended that you use the max setting only if it is necessary.