Analyzing Data in an OLAP Report
Presents the terminology and benefits of using Online Analytical Processing (OLAP). Describes how to customize reports with the OLAP selections panel and the OLAP Control Panel. Describes how to sort and apply various selection criteria (to restrict your data) as well as how to troubleshoot an OLAP-enabled report. Explains how the OLAP Control Panel (OCP) provides you with a versatile way to gain more insight from your reports by dynamically manipulating report data. From the Control Panel, you can perform every function available to a DB2® Web Query OLAP user.
If the OLAP license option has been activated, DB2 Web Query Online Analytical Processing (OLAP) enables you to view and quickly analyze data in order to make critical business decisions.
Parent topic:
IBM DB2 Web Query for System i Overview
We Do It Every Day: Typical Web Query
Suppose that you own a small business in New York and are exploring a partnership with a company in Oakland, California. You need to get to a Monday morning meeting. How do you go about arranging your flight?
Most likely, you go online.
First, you check available flights on the airline that holds your frequent flyer miles. You discover that your frequent flyer carrier requires a change of planes and you would prefer a direct flight, so you look at routes and fares for other airlines.
In New York, you can get to LaGuardia, JFK, and MacArthur airports on Long Island. In California, you can fly into Oakland or San Francisco.
While you would prefer to fly out on Sunday and return Tuesday morning, you could consider a Saturday flight to California and a return flight on the red-eye Monday night, if fares and schedules are better.
You begin your search by airline and then look at options for each departure point and destination, by day, time and price.
Another approach is to start with an online consolidator, enter the times you can fly, and see what flights and fares are available.
There are a lot of variables to play with, but in ½ hour you have done your research and can make a good decision based on all available factors.
The Web sites you access are designed to facilitate your queries. Various menus and selection boxes make it easy to pursue each line of inquiry. Required and optional information is identified for you. You can move forward down a path of choices, backtrack and start down a different path, or resume the original path with different selections.
You need to keep track of the question you want to answer, but a well-designed site makes your investigation easy. For most of us, this process has become intuitive.
The same process works when analyzing the data in an OLAP-enabled DB2 Web Query report.
OLAP Reporting Requirements
OLAP reporting requires some preparation both of the data to be reported against and of the report itself. In many instances, this preparation is entirely transparent, having been done before a user encounters an OLAP report. However, for developers who are charged with OLAP-enabling data and reports and for users who wish, and are authorized, to OLAP-enable their personal reports, the following summary will be useful.
OLAP-Enabling Data
Behind the scenes of any DB2 Web Query OLAP report is a hierarchical data structure. For example, a typical hierarchy of sales regions might contain a GEOGRAPHY category including the fields (in descending order) Region, State, and City. Region, the highest level in this hierarchy, would contain a list of all available regions within GEOGRAPHY. State, the second highest level in the hierarchy, would contain a list of all available states within those regions, and so on.
In DB2 Web Query, the hierarchical structure is generally built into the Master File for a data source, where it becomes active for any report that uses that data source. Developers or administrators who are responsible for describing data in a Master File can use the underlying language. The keyword WITHIN defines the elements in each dimension in the hierarchy.
In addition, those working in Developer Workbench have access to a variety of graphical tools that make it easy to drag and drop fields into position to form a hierarchy. The hierarchy may be global to all procedures or local to one procedure. To define a:
- Global hierarchy in a Master File for use with multiple procedures, use the Dimension Builder.
- Local hierarchy as a component of a particular procedure, use the Dimension tool. The hierarchy you define with this tool does not affect the source Master File.
OLAP-Enabling a Report
In addition to using OLAP-enabled data, a report must be enabled to support OLAP analysis. OLAP-enabling a report consists of specifying how a user will interact with and drill down on OLAP data.
The primary interactions occur in the report itself. In addition, you can choose to expose two supplementary tools, the OLAP Selections pane and the Control Panel.
Setting OLAP Reporting Options
OLAP Interface Options
Users can control the OLAP interfaces and following drill-down options.
-
OFF. Provides an OLAP button to open the OLAP Control Panel.
-
Columns only. Turns off the OLAP Control Panel and the OLAP Selections pane, but allows OLAP functionality from the report itself. You can access options on right-click menus, drag and drop columns within the report, and use up and down arrows to sort columns from high to low or vice versa. This is the default.
-
Columns with panel. Provides access to the OLAP Selections pane from a square button to the left of the column titles.
-
Show filters on top. Opens the OLAP Selections pane above the report. The Measures, Graph, and Dimension controls, as well as the band containing the OLAP, Run, and Reset buttons appear above the report output. You can open the Control Panel by clicking the OLAP button on the Selection pane.
-
Show filters on bottom. Opens the OLAP Selections pane below the report. The Measures, Graph, and Dimension controls, as well as the band containing the OLAP, Run, and Reset buttons appear below the report output. You can open the Control Panel by clicking the OLAP button on the Selection pane.
-
Show Panel in Report. Opens the OLAP report with the OLAP Selections pane hidden. You can perform a variety of analytic tasks from the report itself. Selection Criteria is shown next to the OLAP button.
- Show Tabbed. For OLAP reports that have multiple dimensions, this option groups the dimension elements under a tab labeled with the dimension name.
Drill Down options
These options enable you to sort instantly from high to low or low to high for selected report columns:
-
None
Disables automatic drill downs.
-
Dimensions
Enables automatic drill downs on dimensions in both reports and graphs.
-
Dimensions and Measures
Enables automatic drill downs on dimensions in both reports and graphs and, also, on measures in reports.
Explicit drill downs in a StyleSheet (if they exist) take precedence over OLAP-enabled hyperlinks. If you click a hyperlink associated with an explicit drill-down, the behavior will be defined by the StyleSheet rather than by the AutoDrill On or All settings.
OLAP Terminology
The following table describes OLAP terms that may be useful as you work in the DB2 Web Query OLAP tools. Some of these terms are directly reflected in the interfaces of the OLAP Selections pane and the OLAP Control Panel. Others provide useful background information.
The first column of the following table provides the term and the second column provides the definition.
|
Term |
Definition |
|---|---|
|
Dimension |
Group or list of related elements, usually structured in a hierarchy. For example, a Location dimension could include the elements Country, Region, State, and City arranged in a hierarchy where Country is the top level and City is the base level. Dimensional data usually describes the measured item. |
|
Hierarchy |
Logical parent-child structure of elements within a dimension. |
|
Measure |
Type of item that specifies the quantity of another element with which it is associated. A measure typically defines how much or how many. For example, Units, Revenue, and Gross Margin are measures in the Account dimension and specify how many units were sold, how much revenue was generated, and at what profit margin, respectively. |
|
Pivot |
Manipulating (or rotating) the view of a report by moving a field (or a group of fields) from a column to a row, or vice versa. |
Characteristics of an OLAP Report
An OLAP-enabled report has a number of features that distinguish it from other DB2 Web Query reports.
A basic OLAP report is shown in the following image.

Every OLAP user can take advantage of the analytic features that are built into the OLAP report:
-
Hyperlinks. The values in an OLAP report are usually hyperlinks from which you can drill down to related information.
Depending on your OLAP settings, the hyperlinks may be active for both the dimension fields (by which the report is sorted) and the measures fields (which display quantitative data), or only for the dimension fields. For related information, see OLAP-Enabling a Report.
-
Context menus. You can right-click any column title to access a menu of options that facilitate analysis. The options vary slightly to suit the tasks associated with dimensions and measures.
-
Sorting diamonds
 . The measures (fields that make up the body of the report) have blue diamonds adjacent to them.
You can click either the top or bottom of the diamond to instantly sort data from high to low or low to high.
. The measures (fields that make up the body of the report) have blue diamonds adjacent to them.
You can click either the top or bottom of the diamond to instantly sort data from high to low or low to high.
-
Drag and drop capabilities for dimensions and measures.
- You can drag and drop sort fields to shift sorting from vertical (By) to horizontal (Across) or vice versa.
- You can change the order in which sorting occurs by dragging sort fields from inner to outer positions (and vice versa).
- You can drag measures from one position to another to affect the order in which data appears.
- You can drag and drop sort fields to shift sorting from vertical (By) to horizontal (Across) or vice versa.
Beyond the features in the report itself, your OLAP options depend on the interface and drill down settings that are in effect for a particular report. Those choices determine whether you have access to the following tools:
-
Selections Pane. When this tool is available, a pane may appear above, as shown in the following image, or below your report. For details, see Selections Pane.

-
OLAP Control Panel. When this tool is available, the blue squares
 adjacent to the sort fields (By or Across) in the report become active. You can click a square or the OLAP button to open the Control Panel, as shown in the following image. For details, see OLAP Control Panel.

Three Ways of Working With OLAP Data
There are three ways to work with OLAP data: from the report itself, from the Selections pane, and from the Control Panel. This documentation is organized to help you understand what you can do from each location and which method is most suitable and efficient for your particular OLAP settings.
The Report
You can perform a wide range of basic analytic functions from the report itself. Changes you make in the report are implemented instantly. Every OLAP user can perform these tasks:
- Sort the data in measures in either ascending (lowest value to highest) or descending order (highest value to lowest).
- Drill down on measures, dimensions, or both (depending on the settings described in Setting OLAP Reporting Options).
- Hide fields in the current report.
- View hidden fields in the dimensions hierarchy and add them to the report.
- Change a vertical (By) sort field to a horizontal (Across) sort field and vice versa.
- Delete sort fields.
- Add a column of small bar graphs that help you visualize trends in numeric data (measures).
- Display a graphical representation of your data in a frame above the tabular report.
For an illustration of report-powered OLAP analysis, see We Do It Every Day: Typical Web Query.
Selections Pane
When the OLAP Selections pane is turned on, you can quickly limit the data in the report by selecting specific values for the dimensions in the hierarchy. A drop-down list is available for each dimension. You can multi-select values from one or more dimension lists to refine your report output.
If you wish to add a dimension element to the report you can drag it from the Selections pane into the report frame. (The cursor changes to a + sign to indicate an acceptable location.)
Each dimension has a relational operator button located to its left. This button toggles through a selection of basic numeric operators that enable you to quickly define your selection criteria. The operators are: Equal to, Not equal to, Less than or equal to, Less than but not equal to, Greater than or equal to, Greater than but not equal to. For details, see Selection Criteria Relational Operators.
The following image shows the Equal to operator as the selection for each dimension in the Selection Pane.

The name of the dimension field appears as defined in the Master File, even if an alternate column title has been specified.
In addition, you can customize the display of the measures in your report from the Selections pane. You can click either the Measures or the Graphs arrow in the upper left corner of the pane to list the measures.
- From the Measures arrow, you can display or hide the selected measure(s) or request a column of simple bar graphs to reveal trends.
- From the Graphs arrow, you can choose the measure(s) you wish to graph and specify one of seven basic graph types: vertical and horizontal bar, line, area charts and pie charts.
Note that the Selections pane is resizable; the controls for dimensions, measures, and graphs float as you resize the report window so that they continue to be visible in the frame.
Three buttons appear below the Selections pane: OLAP, Run, and Reset.
-
OLAP opens the OLAP Control Panel (OCP).
-
Run executes the report with the current set of selections.
- Reset resets all the controls in the report to their previous state (that is, before the current set of selections was made and after the last execution of the report).
OLAP Control Panel
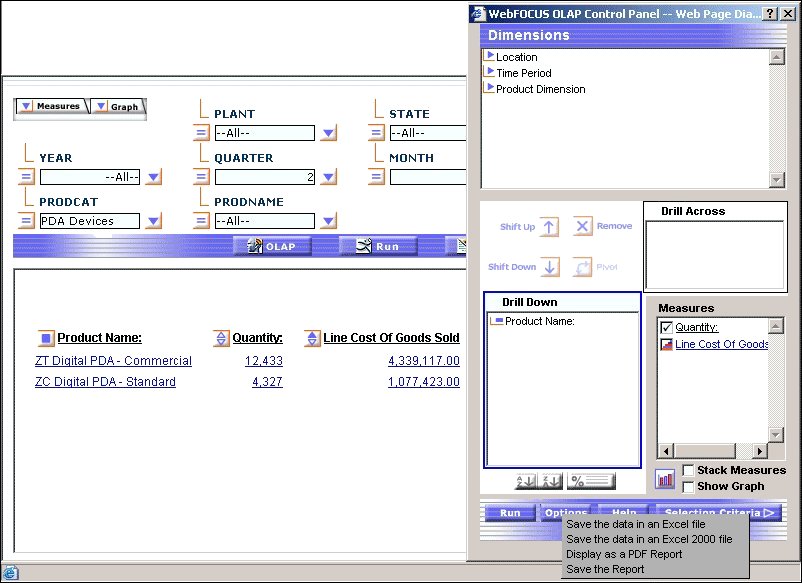
From the Control Panel you can perform every analytic function available to a DB2 Web Query OLAP user as shown in the following image.

The main window of the Control Panel contains the following components:
-
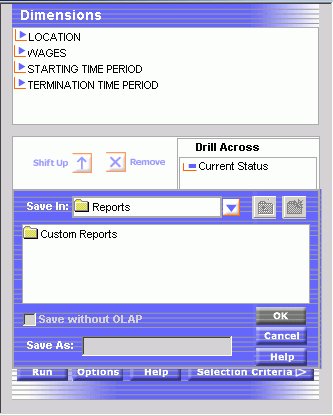
Dimensions box reflects the hierarchical structure of the data source being used by the current report (for example,
the Location dimension contains the Region, State, and City fields; the Region is made up of several States, and each State contains several Cities). You click the arrow to the left of a dimension name to view the elements that comprise it. (The fields shown here are also listed in the Selections pane.)
-
Drill Down and Drill Across boxes list the fields being used to sort the report. You can 'pivot' a Drill Down field to a Drill Across field and vice versa, and shift their positions in the report.
(You can also accomplish these tasks by dragging fields within the report.)
- Measures Properties box contains the body of your report (usually numeric fields). You can change the display mode of a measure by clicking the check box next to the measure; the options are display, hide, and show a column of associated bar graphs. (This is equivalent to the options available from the Measures control in the Selections pane.)
Although the most frequently used functions are available directly from an OLAP report and/or from the Selections pane, several can only be performed from the Control Panel.
Unique Control Panel operations include:
- Sorting options for dimensions: from highest to lowest and vice versa (A>Z or Z>A);
restricting sort field values to a specified number of either highest or lowest values; assigning a rank number to each row in the report. For details, see Sorting Data.
- Options for grouping numeric data by tile (for example, percentile, decile, quartile,
etc.). For details, see Grouping Numeric Data Into Tiles.
- Defining selection criteria based on omitted or existing characters, dates, and range specifications. For details, see Limiting Data.
- Saving OLAP output in PDF and Excel formats. For details, see Saving and Displaying OLAP Reports and Graphs in Other Formats.
- Stacking multiple measures to limit the width of the report. For details, see Stacking Measures.
Drilling Down On Dimensions and Measures
You can drill down on dimensions in OLAP reports and graphs and, also, on measures in reports. The settings activate the required hyperlinks:
-
Dimensions enables automatic drill downs on dimensions in reports and graphs.
-
Dimensions and Measures enables automatic drill downs on dimensions in both reports and graphs and on measures in reports.
- None disables automatic drill downs. This is the default.
In Developer Workbench, you can set drill down options from the Report Options Format tab. For details about this setting, see Setting OLAP Reporting Options.
Sorting Data
You can sort the data in an OLAP report based on the values of dimensions in the hierarchy and/or the values of the quantitative measures that constitute the body of the report. Sorting options vary depending on the nature of the data being sorted. For details, see Sorting Measures and Sorting Dimensions.
You can also group numeric data into any number of tiles (percentiles, quartiles, deciles, etc.). See Grouping Numeric Data Into Tiles.
Sorting Measures
You can apply aggregation and sorting simultaneously to a numeric measure in an OLAP report, and sort the data from high to low (descending order) or from low to high (ascending order). All other columns are sorted correspondingly.
For the measure being sorted, you can restrict the report to a specified number of highest values (when sorting high to low) or lowest values (when sorting from low to high).
When you sort a measure, any subtotals, subheadings, or subfootings in the report are automatically suppressed since these elements relate to a specific sort field and are not meaningful when the report is resorted by the values in a measure column.
Sorting by measures is not available in a report in which measures have been stacked. See Hiding and Displaying Measures.
Sort Measures High to Low/Low to High in an OLAP Report
To sort the values of a measure from high to low:
- Click the top half of the diamond
button.
or
- Right-click the measure and select Sort By Highest from the menu.
The report runs automatically. The highest value is now first in the column. The top of the diamond button becomes solid blue to indicate the current sort direction.
To sort the values of a measure from low to high:
- Click the bottom half of the diamond
button.
or
- Right-click the measure and select Sort By Lowest from the menu.
The lowest value is first in the column. The bottom of the diamond button becomes solid blue.
Tip: After a measure has been sorted, clicking the upper or lower half of the diamond button inverts the sort order of that measure. Place your mouse over either half of the diamond to see a message that indicates the next sort order that will occur if you click that half of the diamond.
Sort Measures High to Low/Low to High From the Control Panel
- Open the OLAP Control Panel.
- Click a measure in the Measures box to open the sort options pane (do not click the Measures check box which controls the display of a measure, not its sorting).
Verify that the Sort box is checked (this setting is required to apply sorting specifications to the selected measure).
- Select the High-to-Low or Low-to-High options button to specify the sort order you wish to apply. The default sort order is high to low.
- Click OK.
The sort pane is replaced by the Measures box, where the measure becomes blue to indicate that sorting specifications have been defined.
- Click Run to display the report with sorting applied to the selected measure.
The diamond button next to the sorted measure changes to reflect the sort order: if High to Low, the top half of the diamond is solid blue; if Low to High, the bottom half is solid blue.
- Report execution is automatic when you sort a measure in an OLAP report. However,
if the Control Panel is open, all current changes in the Control Panel are applied.
- If an OLAP request contains a horizontal (Across) sort field, the measures appear several times in the report, once for each Across value. If you apply sorting to a measure, the sort is performed on the first column occurrence of the measure, and reflected in all subsequent instances. The appropriate half of the diamond button becomes solid only for the first instance. Any additional sorting you wish to perform must be done from the first occurrence of the measure.
View a Subset of Data for Sorted Measures
You can select to view only a subset of the total number of records in your report.
- Open the OLAP Control Panel.
- Click a measure name in the Measures box to open the sort options pane (do not click the Measures check box which controls the display of a measure, not its sorting).
Verify that the Sort check box is selected (this setting is required to apply sorting specifications to a measure).
- Select the Rank check box, then specify the number of sort field values to be included in the report.
(Notice that Highest or Lowest appears to the left of the input box to reflect the current sort order.)
- Use the spin buttons located to the right of the word Highest or Lowest to increase or decrease the number of sort fields.
or
- Position the cursor in the input box and type a number.
The default number of sort fields values is 5.
- Use the spin buttons located to the right of the word Highest or Lowest to increase or decrease the number of sort fields.
- Click OK.
The sort pane is replaced by the Measures box, where the measure becomes blue to indicate that sorting specifications have been defined.
- Click Run to display the report with the designated number of sorted values.
Remove Sorting Criteria for a Measure
You can remove sorting specifications for a measure whether the measure is appears or hidden.
- Open the OLAP Control Panel.
- In the Measures box, click the measure for which you want to remove sorting specifications.
- Clear the Sort check box.
- Click OK.
Sorting Dimensions
There are several ways in which you can sort dimensions in an OLAP hierarchy. You can:
- Control the order in which data is sorted: ascending or descending.
- Restrict sort field values to a specified number of either highest or lowest values.
- Assign a rank number to each row in a vertically sorted report.
- Shift the positions of sort fields in the report. For example, you can change from sorting by State and then by Product to sorting by Product and then by State.
- Pivot a vertical (By) sort field to make it a horizontal (Across) sort field and vice versa.
- Hide a sort field in the report while retaining the sorting associated with it.
For example, you can sort data by quarters without showing the Quarter column.
- Group numeric data in tiles (for example, percentile, decile, etc.).
Change Sort Order for a Dimension
- Open the Control Panel.
- Select a field from the Drill Down or Drill Across box.
- Click the Sort
 button.
The sort pane opens.
- Under Sort Order, choose the Low to High or High to Low options button (Low to High is the default for a dimension).
- Click OK.
The main Control Panel window reopens.
- Click Run to execute the report.
Restrict the Display of Sort Values
To restrict the display of sort field values to a certain number of highest or lowest values:
- Open the OLAP Control Panel.
- Select a field from the Drill Down box.
- Click the Sort
button.
The sorting pane opens.
- Under Sort Order, choose the Low to High or High to Low options button as shown in the following image on the OLAP Control Panel.

- Under Limit Output, click the Limit check box and choose or type a value in the input area.
- Click OK.
The main Control Panel window reopens.
- Click Run to execute your report.
Rank Rows in a Vertically Sorted Report
- Open the OLAP Control Panel.
- Select a field from the Drill Down box.
- Click the Sort
button.
The sort pane opens.
- Under Sort Order, choose the Low to High or High to Low options button.
- Click the Rank check box.
- If you wish to place a restriction on the number of sort field values to rank, click the Limit check box, choose or type a value in the input area.
- If the High to Low option button is selected, you can rank a specified number of Highest values.
- If the Low to High option button is selected, you can rank a specified number of Lowest values.
- If the High to Low option button is selected, you can rank a specified number of Highest values.
- Click OK.
The main Control Panel window reopens.
- Click Run to execute your report.
Reposition Sort Fields in an OLAP Report
You can change the order in which data is sorted and presented in the report. For example, you can change from sorting by State and then by Product to sorting by Product and then by State.) If you want to reposition:
- Vertical (By) sort fields, drag and drop a field into a new column position.
- Horizontal (Across) sort fields, drag and drop the lower field above the higher one or vice versa.
In each case, the cursor changes to a plus (+) sign to indicate acceptable places into which you can drop the field. Unacceptable positions are shown by a circle with a slash across the center.
Reposition Sort Fields From the Control Panel
- Open the OLAP Control Panel.
- Select a field in the Drill Down or Drill Across box.
- Click the Shift Up or Shift Down arrow until the field is in the desired position.
Repeat for other fields as needed.
- Click Run to execute your report.
Pivot Rows and Columns In an OLAP Report
You can quickly change a field from one that sorts data vertically, creating rows, to one that sorts data horizontally, creating columns, or vice versa. To change a:
- Vertical (By) sort field to a horizontal (Across) sort field, drag and drop a field above the row of column titles.
- Horizontal (Across) sort field to a vertical (By) sort field, drag and drop the field into the desired location in the row of column titles.
In each case, the cursor changes to a plus (+) sign to indicate acceptable places into which you can drop the field. (Unacceptable positions are shown by a circle with a slash across the center.)
Pivot Rows and Columns From the Control Panel
You can change a field from one that sorts data vertically, creating rows, to one that sorts data horizontally, creating columns, or vice versa.
- Open the OLAP Control Panel.
- Select the title of the row or column you want to pivot in the Drill Down or Drill Across box.
- Click the Pivot
 button. The title appears in the new location.
- Click Run to execute your report.
Sort by a Field Without Displaying the Sort Column
To use a field to sort your data, but not show the sort field as a column in the report:
- Open the OLAP Control Panel.
- Select a field in the Drill Down or Drill Across box.
- Click the Sort
button.
The sort pane opens.
- Under Sort Order, click the Hide check box.
- Click OK.
The main Control Panel window reopens.
- Click Run to execute the report.
Tip: To expose the hidden sort field, repeat the process and deselect the Hide check box.
Grouping Numeric Data Into Tiles
You can group numeric data into any number of tiles (percentiles, deciles, quartiles, etc.) in tabular reports. For example, you can group student's test scores into deciles to determine which students are in the top ten percent of the class or determine which salesmen are in the top half of all salesmen based on total sales.
Grouping is based on the values in the selected vertical (BY) field and data is apportioned as equally as possible into the number of tile groups you specify.
The following occurs when you group data into tiles:
- A new column (labeled TILE by default) is added to the report output and displays the tile number assigned to each instance of the tile field. You can change the column title in the Tiles section of the OLAP Control Panel.
- Tiling is calculated within all of the higher-level sort fields in the request and restarts whenever a sort field at a higher level than the tile field's value changes.
- Instances are counted using the tile field. If the request displays fields from lower level segments, there may be multiple report lines that correspond to one instance of the tile field.
- Instances with the same tile field value are placed in the same tile. For example, consider the following data, which is to be apportioned into three tiles:
1
5
5
5
8
9
In this case, dividing the instances into groups containing an equal number of records produces the following table:
Group
Data Values
1
1,5
2
5,5
3
8,9
However, because all of the same data values must be in the same tile, the fives (5) that are in group 2 are moved to group 1. Group 2 remains empty. The final tiles look like the following table:
Tile Number
Data Values
1
1,5,5,5
2
3
8,9
Group Data Into Tiles in an OLAP Report
- Open the OLAP Control Panel.
- Select a numeric or date field from the Drill Down box.
- Click the Tiles button.
The Tiles pane opens at the bottom of the OLAP Control Panel as shown in the following image.
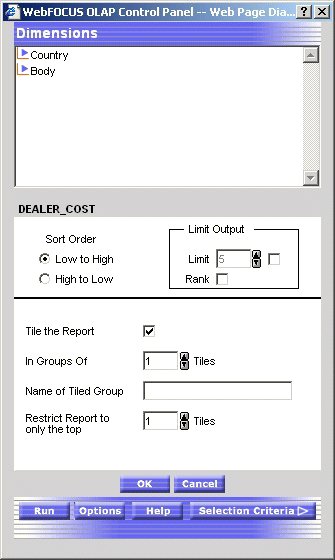
- Click the Tile the Report check box.
- In the In Groups Of input area, select the number of tiles to be used in grouping the data. For example, 100 tiles produces percentiles, 10 tiles produces deciles, etc.
- In the Name of Tile Group input box, type a name for the Tile column.
- In the Restrict Report to only the Top input area, select the number of tile groups to display in the report.
- Optionally, select a Sort Order option button:
- Choose High to Low to sort data in descending order so that the highest data values are placed in tile 1.
- Choose Low to High to sort data in ascending order so that the lowest data values are placed in tile 1. This is the default.
- Choose High to Low to sort data in descending order so that the highest data values are placed in tile 1.
- If you wish to specify the highest tile value to appear in the report, select a value from the Limit input area. For example, if you enter a Limit of 3, the report will not display any data row that is assigned a tile number greater than 3.
- Click OK to accept the selections and return to the main Control Panel window.
- Click Run to re-execute and view the report.
Performing a Calculation on a Measure
You can perform standard calculations, such as average, percent, and summarize, on the numeric data in measures on an OLAP report.
Apply a Calculation to a Measure
- Run the report.
- Open the OLAP Control Panel.
- Click a measure in the Measures box.
The sort options pane opens. Do not click the Measures check box, which controls the display of a measure, not its sorting.
- Required: Click the arrow under Measure Calculations and select a calculation from the drop-down list.
None is the default value. For details, see Calculations You Can Perform on a Measure.
- Click OK.
The sort pane is replaced by the Measures box, where the selected calculation appears as a prefix to the measure.
- Click Run.
The applied calculation is added to the column title.
Calculations You Can Perform on a Measure
The following table lists the types of calculations in the first column and describes their functions in the second column.
|
Calculation |
Function |
|---|---|
Average Sum of Squares |
Computes the average sum of squares for standard deviation in statistical analysis. |
Average |
Computes the average value of the field. |
Count |
Counts the number of occurrences of the field. |
Count Distinct |
Counts the number of distinct values within a field when using -REMOTE. For other modes of operation, this behaves like Count. |
Maximum |
Generates the maximum value of the field. |
Minimum |
Generates the minimum value of the field. |
Percent |
Computes a field's percentage based on the total values for the field. The Percent can be used with detail as well as summary fields. |
Percent Count |
Computes a field's percentage based on the number of instances found. |
Row |
Computes a field's percentage based on the total values for the field across a row. |
Summarize |
Sums the number of occurrences of the field. |
Total |
Counts the occurrences of the field for use in a heading (includes footings, subheads, and subfoots). |
Limiting Data
An OLAP report is limited to values belonging to the parent categories in the dimensions hierarchy. There are several ways to further limit the data that appears in the report.
From the Selections pane or the Control Panel, you can explicitly limit the data in an OLAP report by selecting dimension values and relational operators (such =, >, <). For a list of the relational operators, see Selection Criteria Relational Operators.
- The Selections pane provides the easiest approach since you can choose both dimension values and relational operators with a few mouse clicks, while the report is fully exposed to view.
- The Control Panel offers several options that are not available from the Selections pane, including record selection based on a date or date range and on the existence or absence of specific characters.
Note that changes you make in the Selections Pane are immediately implemented in the Control Panel (even if the Control Panel is closed). However, the inverse is not true; changes you make in the Control Panel are not reflected in the Selections pane until the report is run.
From the report, you can limit data indirectly by drilling down on measures and dimensions to hone in on subset of information. For details, see Drilling Down On Dimensions and Measures.
Selection Criteria Relational Operators
You can define selection criteria using several relational operators, most of which are supported in both the Selections pane and the Control Panel. Those supported only in the Control Panel are noted in the following table which describes the operators.
The first column shows the operator and the second column describes the operator.
|
Operator |
Displays Records That... |
|---|---|
|
|
Are equal to the criteria you specified. This is the default operator. |
|
|
Are not equal to the criteria you specified. |
|
|
Are less than or equal to the criteria you specified. |
|
|
Are less than, but not equal to, the criteria you specified. |
|
|
Are greater than or equal to the criteria you specified. |
|
|
Are greater than, but not equal to, the criteria you specified. |
|
|
Contain the criteria you specified.
This operator is available only for alphanumeric fields and is only supported in the Control Panel. |
|
|
Do not contain the criteria you specified.
This operator is available only for alphanumeric fields and is only supported in the Control Panel. |
 - Equal to
 - Not Equal to
 - Less than or equal to
 - Less than
 - Greater than or equal to
 - Greater than
 - Contains
 - Not contain
You can select more than one value using the same relational operator.
The following relational operators are available for selecting a range of dates. They are only available from the Control Panel.
The following table shows the relational operators in the first column and describes them in the second column.
|
Operator |
Displays Records Where... |
|---|---|
|
|
The value in the indicated date field falls within the specified range.
To use this relational operator, select the Range check box in the Date Selection panel. |
|
|
The value in the indicated date field does not fall within the specified range.
To use this relational operator, select the Range check box in the Date Selection panel. |
Apply Selection Criteria From the Selections Pane
When the Selections pane is turned on, there is one control (drop-down list) for every dimension in the OLAP hierarchy. (Note that the name of the dimension field appears as defined in the Master File, even if an alternate column title has been specified.)
To limit data for the dimensions that are included in the report:
- Click the arrow to the right of the dimension to open the list of values.
- Select one or more values from the list (All is the default value).
To select multiple values, click the desired values while holding the Ctrl key on the keyboard.
- Select a relational operator from the button to the left of the dimension to indicate the basis for selection (equals (=)
is the default).
You can toggle through a list of operators. See Selection Criteria Relational Operators.
- Repeat steps 1-3 for each dimension whose values you wish to limit.
- Click the Run button on the band below the Selections pane.
Tip: To change or eliminate selection criteria, reopen the values list and choose another value or choose All.
Apply Selection Criteria From the Control Panel
- Open the Control Panel.
- Click the Selection Criteria button at the bottom right of the window.
The Selection Criteria pane opens.
- In the Dimensions box above the Selection Criteria pane, expand a dimension and click Values.
A secondary window opens; select one or more values (press the Ctrl key to multi-select).
- Click OK to return to the Selection Criteria pane, where the selected values appear in the drop-down lists.
- If a Developer has applied selection criteria to an OLAP report, you only see the selected acceptable values of the field.
- If no selection criteria have been applied, you see all the values of the field in the drop-down lists.
- If a Developer has applied selection criteria to an OLAP report, you only see the selected acceptable values of the field.
- In the Selection Criteria pane, click a relational operator next to the dimension to specify the relationship that you want to base selection on—for example,
=, >, or <. For a complete list, see Selection Criteria Relational Operators.
- Repeat the process for other dimensions whose values you wish to limit.
- Click Run to execute your report.
Change Selection Criteria From the Control Panel
Tip: If you have access to the Selections pane, it provides the easiest way to adjust or remove selection criteria. See Apply Selection Criteria From the Selections Pane.
From the Selections Criteria pane in the Control Panel:
- Click the Select button next to the dimension value you wish to modify.
A secondary window opens.
To change a value, type the new value in the text box or select one or more values from the list. (The value you type must be in the same case as the value in the data source.)
You can input only one value in the text box. If you select more than one value from the list, only the first value appears. However, all values appear in your report.
To deselect a value, hold down the Ctrl key while clicking the value.
- Click OK to return to the Selection Criteria pane where you can verify the revised value and/or change the relational operator if required.
- Click OK again to confirm your choice and return to the main Control Panel window.
- Click Run to execute your report.
Remove Selection Criteria From the Control Panel
Tip: If you have access to the Selections pane, it provides the easiest way to adjust or remove selection criteria. See Apply Selection Criteria From the Selections Pane.
From the Selections Criteria pane in the Control Panel:
- Select the criterion you want to remove.
- Click the Delete
 button.
The selection category is removed from the list.
- Click Run to execute your report with all values.
Applying Selection Criteria to Date Elements
You can apply selection criteria to date elements just as you apply them to other types of elements. The results are limited by the date(s) you select. For example, you can select to view data associated with a particular date or to exclude data from the specified date.
Like other dimension elements, date fields must have been defined in the Master File by a developer. The Master File specifies the date formats available for selection criteria.
This feature is only supported from the Control Panel, where you choose the selection criteria from a Date selection pane that contains the appropriate controls for the date format.
You can also select a range of dates in a designated year by specifying a From and To date. Two relational operators are available for selecting a range of dates:
- The Within range
 operator displays records when the value in the indicated date field falls within the specified range.
- The Not within range
 operator displays records when the value in the indicated date field does not fall within the specified range.
For more information on supported date formats, see Date Format Limitations.
Apply Selection Criteria to a Date Field
- Required: Open the Control Panel.
- Required: Click the Selection Criteria button.
The Selection Criteria pane opens.
- In the Dimensions box above the Selection Criteria pane, expand the dimension that includes the date field, and click the Values button.
A secondary window displays controls for the dimension's date format. For example, if the date format is YYM, only the year and month controls appear. If the format is YYMD, year, month, and day controls appear.
The date selection pane appears only when a supported date format is provided. See Date Format Limitations.
- Specify a date using the spin controls,
drop-down lists, or by typing the value.
If your date format includes edit masking such as Y.M.D, the date appears with forward slashes in the Date selection list box, the Selection Criteria pane, and the drop-down list at the bottom of the report. However, the date edit mask appears as specified within the body of the report.
- Click Add to display the date in the Selections list box.
- Click OK to return to the Selection Criteria pane and verify the selected date.
- In the Selection Criteria pane, click a relations button to the left of the date field (for example, =, >, or <)
to indicate a basis for record selection.
- Optionally, define additional date selection criteria by repeating steps 2-7.
- Click Run to execute your report.
Apply Selection Criteria to a Date Range
- Open the OLAP Control Panel.
- Click the Selection Criteria button.
The Selection Criteria pane opens.
- In the Dimensions box above the Selection Criteria pane, expand the dimension that includes the date field, and click the Values button.
A secondary window displays controls for the dimension's date format. For example, if the date format is YYM, only the year and month controls appear. If the format is YYMD, year, month, and day controls appear.
The Date selection pane appears only when a supported date format is provided. See Date Format Limitations.
- Required: Click the Range check box.
Inclusive and Exclusive options buttons appear:
- Choose Inclusive to show the range including the dates specified.
- Choose Exclusive to show the range excluding the dates specified.
- You can select only one range of dates at a time.
- You can apply selection criteria to a range of dates only if the date format contains a year. See Date Format Limitations.
From and To drop-down lists open for all selectable options. By default, the current date appears.
- Choose Inclusive to show the range including the dates specified.
- Specify a From date and a To date by using the spin controls and drop-down lists.
- Click OK to return to the Selection Criteria pane.
- To view both the From and To dates of the range selected, click the down arrow on the drop-down list.
- Click a relational operator to the left of the date element in the Selection Criteria pane:
- Choose Within range
operator to display records when the value falls within the specified range.
- Choose Not within range
operator to display records when the value does not fall within the specified range.
- Choose Within range
- Click Run to execute your report.
Add Dates to the Selections List Box
- Open the Control Panel.
- Click Selection Criteria to open the Selection Criteria pane.
- Click the Select button to open the Date selection pane.
- Specify the date you want to add by using the spin buttons, drop-down lists, or by typing the value.
- Click Add.
The date appears inside the Selections list box.
- Click OK to return to the Selection Criteria pane.
Delete Dates From the Selections List Box
- Open the Control Panel.
- Click Selection Criteria to open the Selection Criteria pane.
- Click Select to open the Date selection pane.
- Select one or more dates that you want to remove from the Selections list box.
- Click Delete.
The date is removed.
- Click OK to return to the Selection Criteria pane.
Date Format Limitations
Note the following limitations when applying selection criteria to date elements:
- The Date selection pane does not support Julian dates. However, if you are using Julian dates, the Date controls still open.
- Dates containing only a day format (D, I2D, A2D) are not supported from the Date selection pane. Instead, the data source provides a list of values.
- The Range check box is enabled on the Date selection pane when the date format contains one of the following formats:
Visualizing Trends
To make your reports more powerful, you can insert visual representations of selected data directly into the report output. These visual representations, which appear as a column of vertical or horizontal bar graphs adjacent to the numeric data, make relationships and trends among data more obvious.
You can apply data visualization graphs to selected measures from:
- Context menus in the report itself.
This is the quickest way to apply data visualization bar graphs to numeric measures.
- The Measures control in the Selections pane.
- Check boxes in the Measures box on the Control Panel.
For details about data visualization graphs, see Visualizing Trends in Reports.
Add a Column of Bar Graphs for a Numeric Measure
The quickest way to apply data visualization graphics is from the report itself:
The report runs automatically, displaying a column of bar graphs following the selected measures column.
Tip: To remove the bar graphs, right-click the measure column title and choose Remove Visualization from the menu.
For other methods of applying bar graphs to columns, see Visualizing Trends in Reports.
Displaying Graphs and Reports
When you graph a measure in an OLAP report, you select the specific data elements to include and view the tabular report and a graphical representation of the identical information simultaneously in a split window. The graph appears in a frame in the top half of the window to facilitate comparison.
To be graphable, the data in the report must include at least one numeric measure and one sort field (By or Across). The Graph control is activated in the Selections pane or the Control Panel when these basic requirements are met.
As shown in the following image, it includes three sort fields (PRODCAT, Store Name, and Manufacturing Plant) and three numeric measures (Quantity, Our Cost, and Price), displayed as horizontal bar charts for quick comparison.

You can request a graph from an OLAP report, from the Selections pane, or from the Control Panel:
-
From an OLAP report, you can create a vertical bar chart to represent the data in a selected measure.
- From the Selections pane or the Control Panel, you can create seven different types of graphs and apply them to one or more measures:
If you choose to graph more than one measure, you can employ different graph types to suit the data in each column, with the following restrictions:
- When you select Vertical or Horizontal Bar, Line, or Area as the controlling graph style for a measure, you can apply any combination of these styles to other measures. For example, the first measure can appear as bars, the second measure as lines, and the third measure as areas. All measures must have the same orientation (vertical or horizontal).
- When you choose Pie as the controlling graph style, you can use only pie charts for other measures.
For details about supported combinations, see Combining Graph Styles and Measure Styles in OLAP Graphs.
If drill down capability has been enabled for the dimensions in a report, the same functionality is automatically enabled for graphs. You can, therefore, drill down from one graphical representation of your data to another.
Combining Graph Styles and Measure Styles in OLAP Graphs
The following table lists the available style combinations in the second column for each graph style in the first column.
|
Controlling Graph Style |
Potential Measure Styles |
|---|---|
|
Vertical Bar (default) |
Vertical Bar (default) |
|
Vertical Line | |
|
Vertical Area | |
|
Vertical Line |
Vertical Line (default) |
|
Vertical Bar | |
|
Vertical Area | |
|
Vertical Area |
Vertical Area (default) |
|
Vertical Bar | |
|
Vertical Line | |
|
Horizontal Bar |
Horizontal Bar (default) |
|
Horizontal Line | |
|
Horizontal Area | |
|
Horizontal Line |
Horizontal Line (default) |
|
Horizontal Bar | |
|
Horizontal Area | |
|
Horizontal Area |
Horizontal Area (default) |
|
Horizontal Line | |
|
Horizontal Area | |
|
Pie |
Pie |
Graph a Measure From the Selections Pane
- Click the down arrow to the left of the Graph control to open a pane that contains all the numeric measures in the current report.
There is a check box to the left of each measure and a graph button to the right of each measure. All check boxes are unchecked by default and all graph buttons are grayed (inactive) by default.
- Select a check box associated with a measure.
The graph button to the right of the measure becomes active. The default graph style is Vertical bar.
- Toggle through the seven graph style icons until you reach the one you want to apply to the selected measure.
- Repeat steps 2 and 3 for any other measures you want to graph.
For a list of graph types that can be defined, see Combining Graph Styles and Measure Styles in OLAP Graphs.
- Click the Run button on the band below the Selections pane.
The graph opens in a separate frame above the report and Selections pane.
Graph a Measure From the Control Panel
- Open the Control Panel.
- Select the Show Graph check box located below the Measures Properties box.
Note that the contents of the Drill Down and Drill Across boxes determine the X-axis fields. When there are multiple drill (X-axis) fields, multiple graphs appear vertically stacked in the same frame. The measures appear as Y-axis fields on the graphs you display.
- Click the Graph icon adjacent to the Show Graph check box.
The Measures and GraphStyle pane opens.
Check boxes associated with the available measures are unchecked by default.
- Click one of the seven icons at the bottom of the window to set a controlling graph style.
- Select the check box(es) for the measure(s)
you wish to graph.
The graph icon corresponding to the controlling graph style appears next to each selected measure.
- Click the icon next to a measure to choose a different graph style from the supported combinations as shown in the following image.

- Click OK to return to the main Control Panel window with all the graph settings retained.
- Click Run to display the graph(s) and the tabular report in a split window.
- If you select the Show Graph check box and click Run without selecting a controlling graph style, the default style (Vertical Bar) is applied.
- If you click Run without selecting the Show Graph check box, a tabular report appears without a graph.
- If you select at least one measure in the Measures and GraphStyle pane without selecting the Show Graph check box, when you click OK the system automatically selects the Show Graph check box. The tabular report appears with a graph.
- You cannot choose to graph alphanumeric or date fields. If there are no numeric measures, the Show Graph check box and the Graph button are disabled (grayed out).
Controlling the Display of Measures in a Report
While you cannot add new measures to an OLAP report without returning to the original report request, you can adjust the display of the measures in the report in several ways. You can:
- Stack measures in rows.
- Change the order of measure columns.
- Hide and expose measures.
- Add a column of data visualization bar graphs following any numeric measure.
Stacking Measures
When you have more than one measure in an OLAP report, you can stack the measures in separate rows within the same column to reduce the width of the report.
You cannot apply data visualization bar graphs to stacked measures.
Display Stacked Measures
- Open the Control Panel.
- Select the Stack Measures check box to display measures in separate rows under one column.
- Click Run to execute your report.
Tip: To restore the standard display, deselect the Stack Measures check box and rerun the report.
Changing the Order of Measure Columns
You can change the order in which measure columns are presented in the report.
Reposition Measure Columns in an OLAP Report
To reposition a numeric column, drag and drop the field into a new column position.
The cursor changes to a plus (+) sign to indicate acceptable places into which you can drop the field. (Unacceptable positions are indicated by a circle with a slash cross the center.)
Hiding and Displaying Measures
You can hide and expose measures from an OLAP report, the Selections pane, or the Control Panel.
Hide or Expose a Measure From the Report
To hide a measure column, right-click the column title and choose Hide from the menu. The column is automatically removed from the display.
To expose a hidden measure column, right-click a displayed measure and choose Unhide from the menu. A secondary menu lists any hidden measures.
Choose the one you want to re-expose in the report.
Tip: If you want to add a new measure to the report, return to the original request and add the field there.
Hide or Display a Measure From the Selections Pane
- Click the down arrow to the left of the Measures control to display a list of the measures in the report.
- Click the check box next to a measure to display or hide it. The check box toggles through three positions.
Tip: You can use the same check box to display a column of data visualization bar graphs for numeric measures. This setting is represented as a graph in the check box. For details, see Visualizing Trends.
Display or Hide a Measure From the Control Panel
- Open the Control Panel.
- In the Measures box, click the check box next to a measure to display or hide it. The check box toggles through three positions.
-
To hide the measure, click the check box until it is blank.
- To expose a hidden measure, click the check box until you see a check mark.
Tip: You can use the same check box to display a column of data visualization bar graphs for numeric measures. This setting is represented as a graph in the check box. For details, see Visualizing Trends.
-
To hide the measure, click the check box until it is blank.
- Click Run to execute your report.
Adding and Removing Dimensions
Since all of the values in a dimensions hierarchy are available in an OLAP report from Developer Workbench, you can add dimensions to the OLAP report at any time, without returning to the original report request. You can add dimensions from:
Add a Dimension Element From the Control Panel
- Open the Control Panel.
- Select a report layout box (Drill Down or Drill Across) to indicate how you want the new sort dimension to be used in the report.
- Expand a dimension in the Dimensions box at the top of the window, then click the dimension element you want to add to the designated layout box. The new dimension is added to the bottom of the list.
- If you wish to change the position of the new sort field, click the up arrow to reposition it.
- Click Run to execute your report with the new settings.
Delete a Dimension Element From the Report
Right-click the dimension column you wish to remove and choose Delete from the menu.
The report runs automatically.
Delete a Dimension Element From the Control Panel
- Select the element in the Drill Down or Drill Across box. The buttons above the box become active.
- Click Remove
. The element is deleted from the Drill Down or Drill Across box.
- Click Run to see the new report.
Saving OLAP Reports
DB2 Web Query includes several saving features for OLAP reports:
- The dialog for saving reports allows them to be placed in subfolders of the user's choice under Reports; subfolders can also be created from the OLAP tool.
- Users can save their reports with the OLAP functionality removed, so the OLAP tool can serve as a simple report writer tool.
- Field name referencing is uniform throughout the OLAP product. For example, the AS or TITLE phrases will appear in reports generated using the OLAP Selections pane or the OLAP Control Panel (OCP).
When saving OLAP reports, refresh the Domain to see the newly saved reports. Otherwise, the new reports will not be listed in the domain tree.
Saving Options
If you are working in the OLAP Selections pane, you can save your report by using the Save button on the toolbar. You can also access other saving options in the OCP by selecting the Options button.
Save a Report in OLAP
- Required: Click the Save button in the OLAP Selections Pane.
The following image shows the OLAP Selections Pane containing five buttons, OLAP, Run, Reset, Save, and Help.

or
Click the Options button in the OLAP Control Panel (OCP).
The following image shows the OLAP Control Panel where the Options button appears at the bottom of the panel.
You are now presented with several saving options.
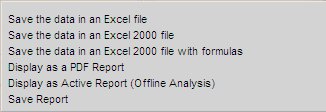
The following image shows the Options menu containing five options, Save the data in an Excel file, Save the data in an Excel 2000 file, Save the data in an Excel 2000 file with formulas, Display as a PDF Report, Display as Active Report (Offline Analysis), and Save Report.
- Click Save Report to open a new dialog box as shown in the following image.
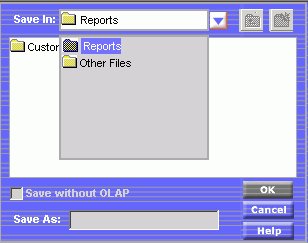
- Click Reports
to enable the New Folder icon in the upper right corner as shown in the following image.
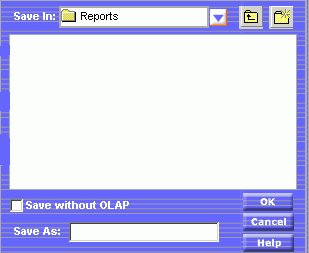
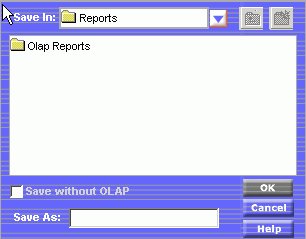
- A pop-up prompts you to create a new folder,
for example, a subfolder called OLAP Reports as shown in the following image.
- Name your report in the Save As box and click OK to return to your report.
Save an OLAP-enabled Report as a Plain Report Without OLAP Functionality
Users can save their reports with the OLAP functionality removed, so the OLAP tool can be used as a simple report writer tool.
- Create a subfolder by following these procedures: Save a Report in OLAP.
- After a subfolder is selected, check the Save without OLAP box.
- Enter a new name for your report in the Save As box and click OK.
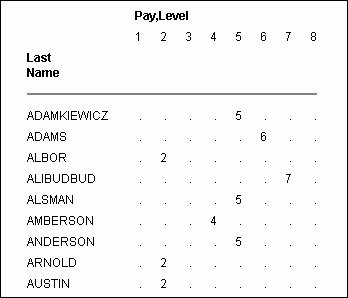
DB2 Web Query generates a new report without OLAP functionality. The following image shows a normal report of employees' pay levels which is sorted by employee's last name.
Uniform Field Name Referencing in OLAP
However the developer designs the report with regard to field referencing will carry through to both the OCP and the OLAP Selections pane. Field referencing does not differ between the report and the OCP and OLAP Selections pane. Field references by AS, TITLE, or Field Name, are uniform in the report output and OLAP controls.
Saving and Displaying OLAP Reports and Graphs in Other Formats
OLAP reports and graphs appear in your browser in HTML format. You can display the report and corresponding graph in PDF and Excel formats.
The following image shows a pop up menu listing the available formats to save and/or display.
- PDF (Adobe® Acrobat's Portable Document Format) is useful when you want a report or graph to maintain its presentation and layout regardless of a user's browser or printer type.
When you choose PDF format, the report appears in Adobe Acrobat Reader; the graph continues to appear above it in a browser window. If you print from Acrobat, only the report will be printed.
- Excel is useful when you want to convert a large database to a spreadsheet or save a report and graph in a commonly used Office tool. Two Excel formats are available:
- Excel 2000 supports most StyleSheet attributes, allowing for full report formatting.
The computer on which the report is being displayed must have Microsoft® Excel 2000 or higher installed.
When you choose Excel 2000, the report and graph are displayed in the same tool where you can manipulate the data using Excel options. From Excel you can print both the report and the graph.
When you save in Excel 2000 format, only explicit drill-downs (based on parameters passed from the base report to the drill-down report) continue to work. Automatic drill downs on Dimensions and Measures are not supported in Excel.
- Excel is a binary display format with limited formatting support. The computer on which the report is being displayed must have Microsoft Excel installed.
Drill-downs of any kind are not supported.
- Excel 2000 supports most StyleSheet attributes, allowing for full report formatting.
The computer on which the report is being displayed must have Microsoft® Excel 2000 or higher installed.
A user can save the HTML output in the Reports folder.
Display an OLAP Report and Graph in PDF Format
- Open the Control Panel.
- Click the Options button at the bottom of the window.
- Select Display as a PDF Report.
The graph appears in the browser above the report, while a second browser opens and launches the report output in Adobe Acrobat as shown in the following image.

Tip: If you wish, you can save and print the PDF report from Adobe Acrobat.
Save an OLAP Report and Graph as an Excel File
- Open the Control Panel.
- Click the Options button at the bottom of the window.
- Select Save the data in an Excel file or Save the data in an Excel 2000 file.
- Follow the instructions to export the data.
Save an OLAP Report and Graph in the Reports Folder
- Open the Control Panel.
- Click the Options button at the bottom of the window.
- Select Save as. A secondary window opens.
- Enter a descriptive name and click OK to save the graph(s) and the tabular report.
There is no limit to the number of characters in a graph legend's label, but long labels may appear truncated.