100 concurrent users using cachespec.xml
In the previous test, we saw a considerable performance improvement brought on by DynaCache. We also saw that the category display page now consumes most of the total time, and the CPU usage on both WebSphere Commerce servers is up. Dynamically caching other pages should help us improve response time and reduce resource usage. In this next test, we use the sample cachespec.xml file provided with the WebSphere Commerce consumer direct starter store, which enables caching of a number of other pages (including the category display page) as well as WebSphere Commerce commands.
Table | -7 and Table | -8, and Figure | -5 summarize the results of the test.
Table 9-7
| CPU usage | Minimum JVM heap usage | Hard disk usage increase | |
|---|---|---|---|
| Commerce server 1 | 18.74% | 450MB | |
| Commerce server 2 | 18.01% | 420MB | |
| Database server | 8.17% | 58MB | |
| Web server | 6.36% |
Resource usage in the test with 100 users and sample cachespec.xml
Table 9-8
| Web action | Average response time (second) | Count | Total time (second) |
|---|---|---|---|
| Overall | 0.238 | 289,004 | 68782.952 |
| Select shipping address | 0.385 | 3,596 | 1384.46 |
| Add shipping address | 0.276 | 2,609 | 720.084 |
| Display category | 0.197 | 130,859 | 25779.223 |
| Log off | 0.292 | 6,644 | 1940.048 |
| Log on | 0.355 | 3,683 | 1307.465 |
| Go to log on page | 0.305 | 3,683 | 1123.315 |
| Add item to cart | 0.82 | 9,097 | 7459.54 |
| View billing address | 0.787 | 7,381 | 5808.847 |
| Process order | 0.86 | 810 | 696.6 |
| View order summary | 1.21 | 1,646 | 1991.66 |
| Add payment info | 0.784 | 811 | 635.824 |
| Display product | 0.129 | 43,591 | 5623.239 |
| View shipping method | 0.467 | 7,372 | 3442.724 |
| Display top category | 0.127 | 43,648 | 5543.296 |
| Visit store front | 0.157 | 16,864 | 2647.648 |
| Register user | 0.433 | 3,355 | 1452.715 |
| Go to register page | 0.332 | 3,355 | 1113.86 |
Response times in the test with 100 users test and sample cachespec.xml
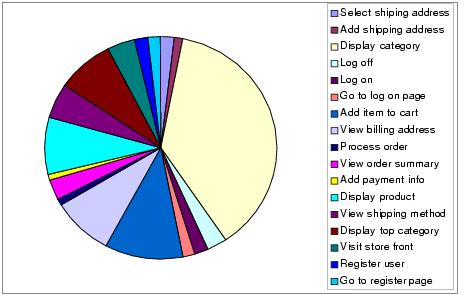
Figure 9-5 Total time for URL actions fin test with 100 users and sample cachespec.xml
We see a significant drop in CPU usage for both the WebSphere Commerce and database servers, as well as an increase in the total number of pages visited in 3 hours, from 210,572 to 289,004. We still see the category display page dominating the total time column of Table | -8. However, this results largely from the sheer number of hits it gets (~50% of total hits); the response time has gone down from 2.496 seconds to 0.197 seconds.