Tactic 4: Identifying by swprofiler
Overview
There are two situations for which you can suspect that unusual large objects exist.
- After tuning Xk and Xp parameters, there are still fragmentation problems. In this situation, the free space before AF has a large value, and stays at a high level, as shown below
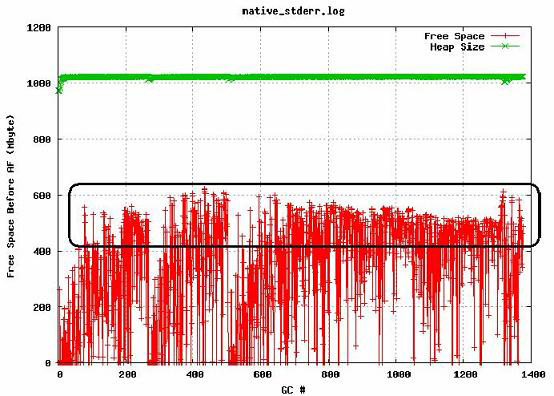
The free space is even larger than 500 MB when AF occurs. In this case, suspect some unusual large objects.
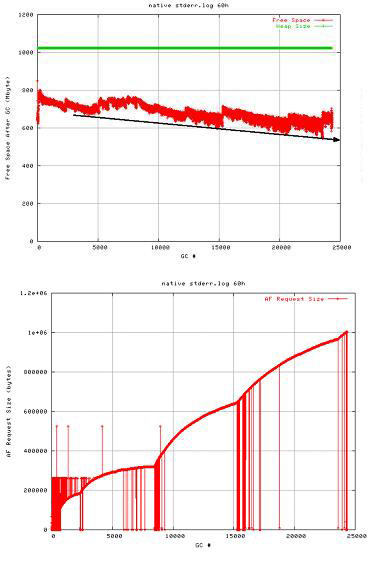
- The free space after GC is declining. The AF request space is not only large, but also growing. In this case, you can also suspect problems associated with memory allocations for large objects.
swprofiler
To identify the large object problem, use swprofiler, which prints stack information of an object by setting the allocation limit and depth.
To use this tool:
- Download the profiler
Note that with the later version of the JDK, a built-in function has been created to replace the use of the swprofile. For details, see Technote "How to identify the Java stack of a thread making an allocation request larger than a certain size."
- Get the proper lib file from the unzipped folder, and copy it to the bin path under the WebSphere Application Server installation folder. For example, copy this file to...
WAS_Home/java/jre/bin
- For an AIX, Linux, Linux on zSeries, or Windows platform, type -Xrunswprof in the Generic JVM arguments field in the WebSphere Application Server administrative console. If your platform is Solaris, this command is -Xrunallocprof.
- Restart WebSphere Application Server.
You see information about the swprofiler in native_stdout.log or native_stderr.log after restarting WebSphere Application Server...
Swprofiler loaded OK Allocation limit: XXXX, Depth: YYY
You can try to configure this allocation limit and depth. After that, when the JVM needs to allocate an object that requires space larger than the allocation limit, the tool records this allocation in the stderr log.
In WebSphere Application Server V6, to set the limit and depth values:
- Open the WebSphere Application Server administrative console, http:// hostname:port/ibm/console, and log in.
- Expand...
Servers | Application servers | server1 | Java and Process Management | Process Definition | Custom Properties
- Click New and add two pairs of properties and values
ALLOC_LIMIT 600000
ALLOC_DEPTH 10 - Save your changes and restart the server.
After setting the allocation limit and depth (10 levels of thread stack in this example), you see the information about the allocation stack printed in the stderr log, as in Example 24-4.
<AF[591]: completed in 106 ms>
Large object allocated: size 22616428
at testalloc in class com/test/OOMTest 21616424
at service in class javax/servlet/http/HttpServlet
The final step is to locate the suspect large object by finding Large objects in native_stderr.log. If your problem is with growing objects, as illustrated in Figure 24-12, find and fix objects with increasing size. After fixing the large object problems, confirm whether the new Free Space after GC, Free Space before AF, and AF Request Size graphs are normal. It is important to know that you cannot remove the fragmentation. You can only reduce or minimize it to a degree.
