Tune the IBM virtual machine for Java
An application server is a Java based server and requires a JVM environment to run and support the enterprise applications that run on it. As part of configuring the application server, we can configure the Java SE Runtime Environment to tune performance and system resource usage. This topic applies to IBM virtual machines for Java.
- Determine the type of JVM on which the application server is running.
-
cd app_server_root/java/bin
java -fullversionIn response to this command, Java writes information about the JVM, including the JVM provider information, into window where we run the command; for example:
- java full version "JRE 1.6.0 IBM Windows 32 build pwi3260sr7-20091217_01 (SR7)"
-
cd profile_root/bin
dspwasinstIf the application server is running on a Sun HotSpot JVM, see the topic Tune Sun HotSpot Java virtual machines (Solaris & HP-UX).
To enable the application server profile to use a different JVM, use the managesdk command.
- Verify that:
- The most recent supported version of the JVM is installed on the system.
- The most recent service update is installed on the system. Almost every new service level includes JVM performance improvements.
- Verify that the most recent service update is installed on the system.
Almost every new service level includes JVM performance improvements.
Each JVM vendor provides detailed information on performance and tuning for their JVM.
There are some general tuning concepts that apply to all JVMs. These general concepts include:
- Compiler tuning. All JVMs use Just-In-Time (JIT) compilers to compile Java byte codes into native instructions during server runtime.
- Java memory or heap tuning.
Tuning the JVM memory management function, or garbage collection, is a good starting point for improving JVM performance.
- Class loading tuning.
- Start up versus runtime performance optimization
Tune the JVM
The following steps do not have to be performed in any specific order.
- Limit the number of dumps that are taken in specific situations.
In certain error conditions, multiple application server threads might fail and the JVM requests a TDUMP for each of those threads. If a significant number of threads fail at the same time, the resulting number of TDUMPs that are taken concurrently might lead to other system problems, such. as a shortage of auxiliary storage. Use the JAVA_DUMP_OPTS environment variable to specify the number of dumps that we want the JVM to produce in certain situations. The value specified for this variable does not affect the number of TDUMPS generated because of com.ibm.jvm.Dump.SystemDump() calls from applications running on the application server.
For example, to configure JVM such that it:
- Limits the number of TDUMPs that are taken to one
- Limits the number of JAVADUMPs taken to a maximum of three
- Does not capture any documentation if an INTERRUPT occurs
Then, set the JAVA_DUMP_OPTS variable to the following value:
- JAVA_DUMP_OPTS=ONANYSIGNAL(JAVADUMP[3],SYSDUMP[1]),ONINTERRUPT(NONE)
- Optimize the startup and runtime performance.
In a development environment, startup performance is more important that runtime performance. IBM virtual machines for Java are optimized for runtime performance, while HotSpot-based JVMs are optimized for startup performance.
The Java Just-in-Time (JIT) compiler impacts whether startup or runtime performance is optimized. The initial optimization level that the compiler uses influences the length of time required to compile a class method, and the length of time required to start the server. For faster startups, reduce the initial optimization level that the compiler uses. However if you reduce the initial optimization level, the runtime performance of the applications might decrease because the class methods are now compiled at a reduced optimization level.
- -Xquickstart
This setting influences how the IBM virtual machine for Java uses a reduced optimization level for class method compiles. A lower optimization level provides for faster server startups, but lowers runtime performance. If not specified, the IBM virtual machine for Java defaults to starting with a high initial optimization level for compiles, which results in faster runtime performance, but slower server starts.
We can set this property on the Java virtual machine panel using the administrative console. For details, read the information about Java virtual machine settings.
Information Value Default High initial compiler optimization level Recommended High initial compiler optimization level Usage Specify -Xquickstart improves server startup time.
(ZOS) To speed up JVM initialization and improve server startup time, specify the following command-line arguments in the General JVM arguments field in the General Properties section of the Configuration Tab.
- -Xquickstart
-Xverify:none - -Xquickstart
- Configure the heap size.
The Java heap parameters influence the behavior of garbage collection. Increasing the heap size supports more object creation. Because a large heap takes longer to fill, the application runs longer before a garbage collection occurs. However, a larger heap also takes longer to compact and causes garbage collection to take longer.
The JVM uses defined thresholds to manage the storage that it is allocated. When the thresholds are reached, the garbage collector is invoked to free up unused storage. Therefore, garbage collection can cause significant degradation of Java performance. Before changing the initial and maximum heap sizes, we should consider the following information:
- In the majority of cases we should set the maximum JVM heap size to a value that is higher than the initial JVM heap size. This setting allows for the JVM to operate efficiently during normal, steady state periods within the confines of the initial heap. This setting also allows the JVM to operate effectively during periods of high transaction volume because the JVM can expand the heap up to the value specified for the maximum JVM heap size. In some rare cases, where absolute optimal performance is required, we might want to specify the same value for both the initial and maximum heap size. This setting eliminates some overhead that occurs when the JVM expands or contracts the size of the JVM heap. Before changing any of the JVM heap sizes, verify that the JVM storage allocation is large enough to accommodate the new heap size.
- Do not make the size of the initial heap so large that while it initially improves performance by delaying garbage collection, when garbage collection does occur, the collection process affects response time because the process has to run longer.
To use the administrative console to configure the heap size:
- In the administrative console, click...
Servers | Server Types | WebSphere application servers | server | Server Infrastructure | Java and process management | Process definition | Java virtual machine
- Specify a new value in either the Initial heap size or the Maximum heap size field.
We can also specify values for both fields if we need to adjust both settings.
For performance analysis, the initial and maximum heap sizes should be equal.
The Initial heap size setting specifies, in megabytes, the amount of storage that is allocated for the JVM heap when the JVM starts. The Maximum heap size setting specifies, in megabytes, the maximum amount of storage that can be allocated to the JVM heap. Both of these settings have a significant effect on performance.
If we are tuning a production system where we do not know the working set size of the enterprise applications running on that system, an appropriate starting value for the initial heap size is 25 percent of the maximum heap size. The JVM then tries to adapt the size of the heap to the working set size of the application.
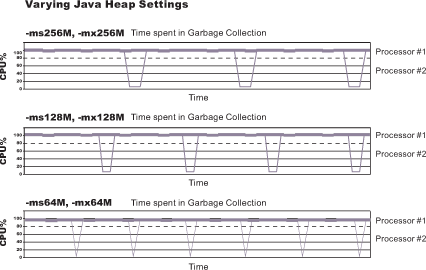
The following illustration represents three CPU profiles, each running a fixed workload with varying Java heap settings. In the middle profile, the initial and maximum heap sizes are set to 128 MB. Four garbage collections occur. The total time in garbage collection is about 15 percent of the total run. When the heap parameters are doubled to 256 MB, as in the top profile, the length of the work time increases between garbage collections. Only three garbage collections occur, but the length of each garbage collection is also increased. In the third profile, the heap size is reduced to 64 MB and exhibits the opposite effect. With a smaller heap size, both the time between garbage collections and the time for each garbage collection are shorter. For all three configurations, the total time in garbage collection is approximately 15 percent. This example illustrates an important concept about the Java heap and its relationship to object utilization. A cost for garbage collection always exists when running enterprise applications.
Run a series of tests that vary the Java heap settings. For example, run experiments with 128 MB, 192 MB, 256 MB, and 320 MB. During each experiment, monitor the total memory usage. If we expand the heap too aggressively, paging can occur.
(Dist) Use the vmstat command or the Windows Performance Monitor to check for paging. If paging occurs, reduce the size of the heap or add more memory to the system.
(iSeries) Use the IBM i WRKSYSSTS command to check for paging. If paging occurs, reduce the size of the heap or add more memory to the system.
(ZOS) If paging occurs, reduce the size of the heap or add more memory to the system.
When all the runs are finished, compare the following statistics:
- Number of garbage collection calls
- Average duration of a single garbage collection call
- Ratio between the length of a single garbage collection call and the average time between calls
If the application is not over utilizing objects and has no memory leaks, the state of steady memory utilization is reached. Garbage collection also occurs less frequently and for short duration.
If the heap free space settles at 85 percent or more, consider decreasing the maximum heap size values because the application server and the application are under-utilizing the memory allocated for heap.
(ZOS) If we have servers configured to run in 64-bit mode, we can specify a JVM maximum heap size for those servers that is significantly larger than the default setting. For example, we can specify an initial maximum heap size of 1844 MB for the controller and the servant if the server is configured to run in 64-bit mode.
- Click Apply.
- Click Save to save the changes to the master configuration.
- Stop and restart the application server.
We can also use the following command-line parameters to adjust these settings. These parameters apply to all supported JVMs and are used to adjust the minimum and maximum heap size for each application server or application server instance.
- -Xms
This parameter controls the initial size of the Java heap. Tuning this parameter reduces the overhead of garbage collection, which improves server response time and throughput. For some applications, the default setting for this option might be too low, which causes a high number of minor garbage collections.
Information Value Default 50 MB Recommended Workload specific, but higher than the default. Usage Specify -Xms256m sets the initial heap size to 256 MB. - -Xmx
This parameter controls the maximum size of the Java heap. Increasing this parameter increases the memory available to the application server, and reduces the frequency of garbage collection. Increasing this setting can improve server response time and throughput. However, increasing this setting also increases the duration of a garbage collection when it does occur. This setting should never be increased higher than the system memory available for the application server instance. Increasing the setting above the available system memory can cause system paging and a significant decrease in performance.
Information Value Default By default, the JVM dynamically calculates the Java heap size based on the available memory in the system. Recommended Workload specific, but higher than the default value, depending on the amount of available physical memory. Usage Specify -Xmx512m sets the maximum heap size to 512 MB. Specify a value for the -Xmx parameter to reduce possible out-of-memory issues.
- -Xlp
Use this parameter with the IBM virtual machine for Java to allocate the heap when using large pages, such as 16 MB pages. Before specifying this parameter, verify that the operating system is configured to support large pages. Using large pages can reduce the CPU overhead needed to keep track of heap memory, and might also allow the creation of a larger heap.
Default 64 KB if we are using Java 8 - (iSeries) (AIX) -Xlp64k
This parameter can be used to allocate the heap using medium size pages, such as 64 KB. Using this virtual memory page size for the memory an application requires can improve the performance and throughput of the application because of hardware efficiencies associated with a larger page size.
(iSeries) (AIX) i5/OS and AIX provide rich support around 64 KB pages because 64 KB pages are intended to be general purpose pages. 64 KB pages are easy to enable, and applications might receive performance benefits when 64 KB pages are used. This setting can be changed without changing the operating system configuration. However, IBM recommends that we run the application servers in a separate storage pool if we use of 64KB pages.
Recommended Use 64 KB page size whenever possible. (iSeries) i5/OS POWER5+ systems, and i5/OS v6, Release 1, support a 64 KB page size.
(AIX) POWER5+ systems, and AIX 5L™ v5.3 with the 5300-04 Recommended Maintenance Package support a 64 KB page size when they are running the 64-bit kernel.
- (iSeries) (AIX) -Xlp4k
This parameter can be used to allocate the heap using 4 KB pages. Using this virtual memory page size for the memory an application requires, instead of 64 KB, might negatively impact performance and throughput of the application because of hardware inefficiencies associated with a smaller page size.
(iSeries) (AIX) The Java heap allocation setting can be changed without changing the operating system configuration. However, IBM recommends that we run the application servers in a separate storage pool if we use of 64KB pages.
Recommended Use -Xlp64k instead of -Xlp4k whenever possible.
- Tune Java memory.
Enterprise applications written in the Java language involve complex object relationships and use large numbers of objects. Although, the Java language automatically manages memory associated with object life cycles, understanding the application usage patterns for objects is important. In particular, verify that the following conditions exist:
- The application is not over utilizing objects
- The application is not leaking objects
- The Java heap parameters are set properly to handle a given object usage pattern
- Check for over-utilization of objects.
We can review the counters for the JVM run time, included in Tivoli Performance Viewer reports, to determine if an application is overusing objects. We have to specify the -XrunpmiJvmtiProfiler command-line option, as well as the JVM module maximum level, to enable the Java virtual machine profiler interface, JVMTI, counters.
The optimal result for the average time between garbage collections is at least five to six times the average duration of a single garbage collection. If we do not achieve this number, the application is spending more than 15 percent of its time in garbage collection.
(ZOS) We can check if the application is overusing objects, by observing the counters for the JVM runtime. We have to specify the -XrunpmiJvmtiProfiler command-line option, as well as the JVM module maximum level in order to enable the Java virtual machine profiler interface, JVMTI, counters. The optimal result for the average time between garbage collections is at least five to six times the average duration of a single garbage collection. If we do not achieve this number, the application is spending more than 15 percent of its time in garbage collection.
If the information indicates a garbage collection bottleneck, there are two ways to clear the bottleneck. The most cost-effective way to optimize the application is to implement object caches and pools. Use a Java profiler to determine which objects to target. If we can not optimize the application, try adding memory, processors and clones. Additional memory allows each clone to maintain a reasonable heap size. Additional processors allow the clones to run in parallel.
- Test for memory leaks.
Memory leaks in the Java language are a dangerous contributor to garbage collection bottlenecks. Memory leaks are more damaging than memory overuse, because a memory leak ultimately leads to system instability. Over time, garbage collection occurs more frequently until the heap is exhausted and the Java code fails with a fatal out-of-memory exception. Memory leaks occur when an unused object has references that are never freed. Memory leaks most commonly occur in collection classes, such as Hashtable because the table always has a reference to the object, even after real references are deleted.
High workload often causes applications to crash immediately after deployment in the production environment. If an application has memory leaks, a high workload can accelerate the magnification of the leakage and cause memory allocation failures to occur.
The goal of memory leak testing is to magnify numbers. Memory leaks are measured in terms of the amount of bytes or kilobytes that cannot be garbage collected. The delicate task is to differentiate these amounts between expected sizes of useful and unusable memory. This task is achieved more easily if the numbers are magnified, resulting in larger gaps and easier identification of inconsistencies. The following list provides insight on how to interpret the results of our memory leak testing:
- Long-running test
Memory leak problems can manifest only after a period of time, therefore, memory leaks are found easily during long-running tests. Short running tests might provide invalid indications of where the memory leaks are occurring. It is sometimes difficult to know when a memory leak is occurring in the Java language, especially when memory usage has seemingly increased either abruptly or monotonically in a given period of time. The reason it is hard to detect a memory leak is that these kinds of increases can be valid or might be the intention of the developer. We can learn how to differentiate the delayed use of objects from completely unused objects by running applications for a longer period of time. Long-running application testing gives you higher confidence for whether the delayed use of objects is actually occurring.
- Repetitive test
In many cases, memory leak problems occur by successive repetitions of the same test case. The goal of memory leak testing is to establish a big gap between unusable memory and used memory in terms of their relative sizes. By repeating the same scenario over and over again, the gap is multiplied in a very progressive way. This testing helps if the number of leaks caused by the execution of a test case is so minimal that it is hardly noticeable in one run.
Use repetitive tests at the system level or module level. The advantage with modular testing is better control. When a module is designed to keep the private module without creating external side effects such as memory usage, testing for memory leaks is easier. First, the memory usage before running the module is recorded. Then, a fixed set of test cases are run repeatedly. At the end of the test run, the current memory usage is recorded and checked for significant changes. Remember, garbage collection must be suggested when recording the actual memory usage by inserting System.gc() in the module where we want garbage collection to occur, or using a profiling tool, to force the event to occur.
- Concurrency test
Some memory leak problems can occur only when there are several threads running in the application. Unfortunately, synchronization points are very susceptible to memory leaks because of the added complication in the program logic. Careless programming can lead to kept or not-released references. The incident of memory leaks is often facilitated or accelerated by increased concurrency in the system. The most common way to increase concurrency is to increase the number of clients in the test driver.
Consider the following points when choosing which test cases to use for memory leak testing:
- A good test case exercises areas of the application where objects are created. Most of the time, knowledge of the application is required. A description of the scenario can suggest creation of data spaces, such as adding a new record, creating an HTTP session, performing a transaction and searching a record.
- Look at areas where collections of objects are used. Typically, memory leaks are composed of objects within the same class. Also, collection classes such as Vector and Hashtable are common places where references to objects are implicitly stored by calling corresponding insertion methods. For example, the get method of a Hashtable object does not remove its reference to the retrieved object.
Use the Tivoli Performance Viewer to help find memory leaks.
For optimal results, repeat experiments with increasing duration, such as 1,000, 2,000, and 4,000 page requests. The Tivoli Performance Viewer graph of used memory should have a jagged shape. Each drop on the graph corresponds to a garbage collection. There is a memory leak if one of the following conditions is appears in the graph:
- The amount of memory used immediately after each garbage collection increases significantly. When this condition occurs, the jagged pattern looks more like a staircase.
- The jagged pattern has an irregular shape.
- The gap between the number of objects allocated and the number of objects freed increases over time.
Heap consumption that indicates a possible leak during periods when the application server is consistently near 100 percent CPU utilization, but disappears when the workload becomes lighter or near-idle, is an indication of heap fragmentation. Heap fragmentation can occur when the JVM can free sufficient objects to satisfy memory allocation requests during garbage collection cycles, but the JVM does not have the time to compact small free memory areas in the heap to larger contiguous spaces.
Another form of heap fragmentation occurs when objects that are less than 512 bytes are freed. The objects are freed, but the storage is not recovered, resulting in memory fragmentation until a heap compaction occurs.
Heap fragmentation can be reduced by forcing compactions to occur. However, there is a performance penalty for forcing compactions. Use the Java -X command to see the list of memory options.
- Long-running test
- Tune garbage collection
Examining Java garbage collection gives insight to how the application is utilizing memory. Garbage collection is a Java strength. By taking the burden of memory management away from the application writer, Java applications are more robust than applications written in languages that do not provide garbage collection. This robustness applies as long as the application is not abusing objects. Garbage collection typically consumes from 5 to 20 percent of total run time of a properly functioning application. If not managed, garbage collection is one of the biggest bottlenecks for an application.
Monitor garbage collection while a fixed workload is running, provides you with insight as to whether the application is over using objects. Garbage collection can even detect the presence of memory leaks.
Use JVM settings to configure the type and behavior of garbage collection. When the JVM cannot allocate an object from the current heap because of lack of contiguous space, the garbage collector is invoked to reclaim memory from Java objects that are no longer being used. Each JVM vendor provides unique garbage collector policies and tuning parameters.
Use the Verbose garbage collection setting in the administrative console to enable garbage collection monitoring. The output from this setting includes class garbage collection statistics. The format of the generated report is not standardized between different JVMs or release levels.
To adjust the JVM garbage collection settings:
- In the administrative console, click...
- Servers | Server Types | WebSphere application servers | server | Server Infrastructure section | Java and process management | Process definition | Java virtual machine
- Enter the -X option we want to change in the Generic JVM arguments field.
- Under additional properties, click Environment entries.
- Add or update the environment entry for IBM_JAVA_OPTIONS as follows.
- If we see an existing environment entry named IBM_JAVA_OPTIONS, edit it to append the -X Java option we want to add to the existing value.
- Otherwise, click New to create a new environment entry.
Fill in the following values in their respective fields of the form:
Information Value Name: IBM_JAVA_OPTIONS Value: The -X Java option we want to add Description: A description of that option
(ZOS) This procedure updates the was.env file in the WebSphereApplication Server configuration directory. The change will apply the settings to all servant, control, and adjunct regions.
- Click Apply.
- Click Save to save the changes to the master configuration.
- Stop and restart the application server.
The following list describes the -X options for the different JVM garbage collectors.
- The IBM virtual machine for Java garbage collector.
- A complete guide to the IBM implementation of the Java garbage collector is provided in the IBM SDK, v8 User Guide.
Use the Java -X option to view a list of memory options.
- -Xgcpolicy
The IBM virtual machine for Java provides four policies for garbage collection. Each policy provides unique benefits.
While each policy provides unique benefits, for WAS v8.0 and later, gencon is the default garbage collection policy. Previous versions of the application server specify that optthruput is the default garbage collection policy.
- gencon is the default policy. This policy works with the generational garbage collector. The generational scheme attempts to achieve high throughput along with reduced garbage collection pause times. To accomplish this goal, the heap is split into new and old segments. Long lived objects are promoted to the old space while short-lived objects are garbage collected quickly in the new space. The gencon policy provides significant benefits for many applications. However, it is not suited for all applications, and is typically more difficult to tune.
- optthruput provides high throughput but with longer garbage collection pause times. During a garbage collection, all application threads are stopped for mark, sweep and compaction, when compaction is needed. The gencon policy is sufficient for most applications.
- optavgpause is the policy that reduces garbage collection pause time by performing the mark and sweep phases of garbage collection while an application is running. This policy causes a small performance impact to overall throughput.
- subpool is a policy that increases performance on multiprocessor systems, that commonly use more then 8 processors. This policy is only available on IBM System i System p and System z processors. The subpool policy is similar to the gencon policy except that the heap is divided into subpools that provide improved scalability for object allocation.
Information Value Default gencon Recommended gencon Usage Specify Xgcpolicy:gencon sets the garbage collection policy to gencon. Set gcpolicy to gencon disables concurrent mark. We should get optimal throughput results when using the gencon policy unless we are experiencing erratic application response times, which is an indication that we might have pause time problems
Set gcpolicy to optavgpause enables concurrent mark with its default values. This setting alleviates erratic application response times that normal garbage collection causes. However, this option might decrease overall throughput.
- -Xnoclassgc
By default, the JVM unloads a class from memory whenever there are no live instances of that class left. The overhead of loading and unloading the same class multiple times, can decrease performance.
Use the -Xnoclassgc argument to disable class garbage collection. However, the performance impact of class garbage collection is typically minimal, and turning off class garbage collection in a Java EE based system, with its heavy use of application class loaders, might effectively create a memory leak of class data, and cause the JVM to throw an Out-of-Memory Exception.
If we use this option, whenever you redeploy an application, we should always restart the application server to clear the classes and static data from the pervious version of the application.
Information Value Default Class garbage collection is enabled. Recommended Do not disable class garbage collection. Usage Specify Xnoclassgc to disable class garbage collection.
- -Xgcpolicy
- In the administrative console, click...
- Enable localhost name caching By default in the IBM SDK
for Java, the static method
java/net/InetAddress.getLocalHost does not cache its result. This method is used throughout WAS, but particularly in administrative agents such as the deployment manager and node agent. If the localhost address of a process will not change while it is running, then it is advised to use a built-in
cache for the localhost lookup by setting the com.ibm.cacheLocalHost
system property to the value true. Refer to the Java virtual machine custom properties topic in the information center for instructions on setting JVM custom properties on the various types of processes.
The address for servers configured using DHCP change over time. Do not set this property unless we are using statically assigned IP addresses for the server.
Information Value Default com.ibm.cacheLocalHost = false Recommended com.ibm.cacheLocalHost = true (see description) Usage Specify -Dcom.ibm.cacheLocalHost=true enables the getLocalHost cache - Enable class sharing in a cache.
The share classes option lets you share classes in a cache. Sharing classes in a cache can improve startup time and reduce memory footprint. Processes, such as application servers, node agents, and deployment managers, can use the share classes option.
This option is enabled by default in the application server. To clear the cache, either call the app_server_root/bin/clearClassCache utility or stop the application server and then restart the application server.
(ZOS) (Dist) If we use this option, we should clear the cache when the process is not in use. To clear the cache, either call the app_server_root/bin/clearClassCache.bat/sh utility or stop the process and then restart the process.
When using clearclasscache, to clear the entire cache we must stop all of the attached JVMs.
To disable the share classes option for a process, specify the generic JVM argument -Xshareclasses:none for that process:
- In the administrative console, click...
Servers > Server Types > WebSphere application servers > server.
- In the Server Infrastructure section, click Java and process management > Process definition > Java virtual machine
- In the Server Infrastructure section, click Java and process management > Process definition
- Select either Control or Servant, and then select Java virtual machine.
- Enter -Xshareclasses:none in the Generic JVM arguments field.
- Click OK.
- Click Save to save the changes to the master configuration.
- Stop and restart the application server.
Information Value Default The Share classes in a cache option are enabled. Recommended Leave the share classes in a cache option enabled. Usage Specify -Xshareclasses:none disables the share classes in a cache option. - In the administrative console, click...
- Enable compressed references on 64-bit
environments.
(ZOS) (Dist) We can enable compressed references on 64-bit environments, such as AIX 64, Linux PPC 64, zLinux 64, and Microsoft Windows AMD64, Linux AMD64.
(iSeries) We can also enable compressed references on IBM i 64-bit environments, such as IBM i Version 6.1.
The compressed references option of the IBM implementation of the 64-bit Java SE Runtime Environment (JRE) v6.0 lets you limit all of the memory references to 32-bit size. Typically, the 64-bit JVMs use more heap space than the 32-bit JVMs because they use 64-bit wide memory references to address memory. The heap that is addressable by the 64-bit reference is orders of magnitude larger than the 32-bit heap, but in the real world, a heap that requires all 64-bits for addressing is typically not required. Compressing the references reduces the size of the addresses and makes more efficient use of the heap. Compressing these references also improves the processor cache and bus utilization, thereby improving performance.
.
The compressed references feature is not supported on:
- HP-UX 64-bit JVM
- iSeries Classic 64-bit JVM
(ZOS) To enable a 64-bit JVM to run in the compressed references mode, we need to specify a new environment variable in WebSphereApplication Server configuration. In the administrative console:
- Click: Servers > Server Types > WebSphere application servers > server.
- Click the Configuration tab. Under Server Infrastructure, click Java and process management > ProcessDefinition > servant.
- Under additional properties, click Environment entries.
Add or update the environment entry for IBM_JAVA_OPTIONS as follows:
- If we see an existing environment entry named IBM_JAVA_OPTIONS, edit it to append the Java option -Xcompressedrefs to the existing value.
- Otherwise, click New to create a new environment entry. Fill in following values in their
respective fields of the form:
Information Value Name: IBM_JAVA_OPTIONS Value: -Xcompressedrefs Description: Enable 64-bit compressed references mode
(ZOS) This procedure updates the was.env file in the WebSphereApplication Server configuration directory. The change will apply the settings to all servant, control, and adjunct regions.
When we supply Xcompressedrefs as a generic JVM argument, WebSphereApplication Server will fail to start because of an unsupported Java option error. If the application requires more than a 30 GB Java heap, then 64-bit default mode should be use.
WAS v9 automatically enables pointer compression on the supported platforms by default if the heap size (controlled by the -Xmx parameter) is set under a certain heap size (around 25 GB depending on platform), else it will default to non-compressed references. The user can override these defaults using the following command line options.
(ZOS) Note: WAS for z/OS does not automatically enable pointer compression. Users are recommended to manually enable pointer compression using the command-line options.
For Java 8 SR2 FP10, or for z/OS Java 8 SR3, the -Xcompressedrefs option is enabled by default up to 57GB and can be used with higher values depending on the platform.
The following command-line options control compressed references feature:
- -Xcompressedrefs
- This command-line option enables the compressed references feature. When the JVM is launched with this command line option it would use 32-bit wide memory references to address the heap. This feature can be used up to a certain heap size (around 29GB depending on the platform), controlled by -Xmx parameter.
- -Xnocompressedrefs
- This command-line options explicitly disable the compressed references feature. When the JVM is launches with this command line option it will use full 64-bit wide memory references to address the heap. This option can be used by the user to override the default enablement of pointer compression, if needed.
- Tune the configuration update process for a large cell configuration.
In a large cell configuration, we might need to determine whether configuration update performance or consistency checking is more important. The deployment manager maintains a master configuration repository for the entire cell. By default, when the configuration changes, the product compares the configuration in the workspace with the master repository to maintain workspace consistency. However, the consistency verification process can cause an increase in the amount of time to save a configuration change or to deploy a large number of applications. The following factors influence how much time is required:
- The more application servers or clusters defined in a cell, the longer it takes to save a configuration change.
- The more applications deployed in a cell, the longer it takes to save a configuration change.
If the amount of time required to change a configuration change is unsatisfactory, we can add the config_consistency_check custom property to the JVM settings and set the value of this property to false.
- In the administrative console, click...
- System administration > Deployment manager > Server Infrastructure > Java and Process Management > Process Definition > Additional Properties > Java Virtual Machine > Custom Properties
> New
- Enter config_consistency_check in the Name field and false in the Value field.
- Click OK and then save these changes to the master configuration.
- Restart the server.
The config_consistency_check custom property affects the dmgr process only. It does not affect other processes including the node agent and application server processes. The consistency check is not performed on these processes. However, within the SystemOut.log files for these processes, we might see a note that the consistency check is disabled. For these non-dmgr processes, we can ignore this message.
If we are using the wsadmin command wsadmin -conntype none in local mode, set the config_consistency_check property to false before issuing this command.
IBM recommends using the High Performance Extensible Logging (HPEL) log and trace infrastructure . We view HPEL log and trace information using the logViewer .
What to do next
Continue to gather and analyze data as we make tuning changes until we are satisfied with how the JVM is performing.