High Performance Extensible Logging (HPEL)
Overview
High Performance Extensible Logging (HPEL) is a log and trace facility provided as a part of WebSphere Application Server. The basic log and trace facility is enabled by default. To use HPEL enable it.
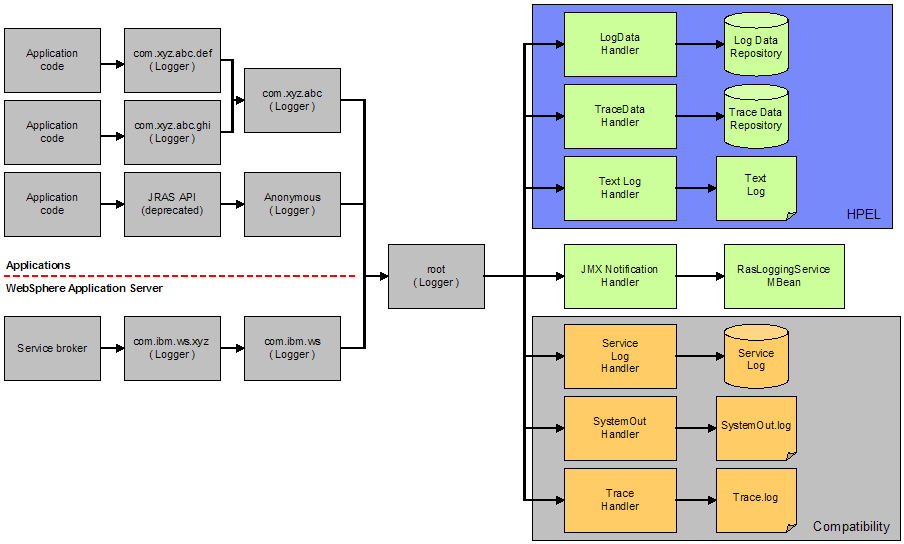
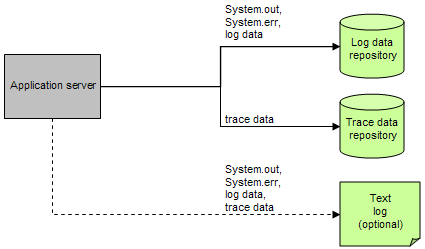
HPEL provides a log data repository, a trace data repository, and a text log file.

- HPEL log data repository
-
Storage facility for log records. Log data is typically intended to be reviewed by administrators. This includes any information applications or the server write to System.out, System.err, or java.util.logging at level Detail or higher (including Detail, Config, Info, Audit, Warning, Severe, Fatal, and any custom levels at level Detail or higher).
- HPEL trace data repository
-
Storage facility for trace records. Trace data is typically intended for use by application programmers or by the WAS support team. This includes any information applications or the server write to java.util.logging at levels below level Detail (including Fine, Finer, Finest, and any custom levels below level Detail).
Log and trace content written to the deprecated JRAS logging API is also included in the log and trace data repositories. Some logging APIs, such as Jakarta Commons Logging can also be configured to route their log and trace data to java.util.logging, and would have their output stored in the log data or trace data repository as well.
- HPEL text log
-
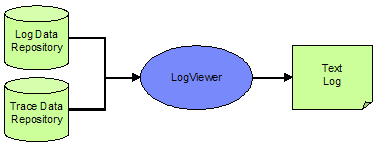
Plain text file for log and trace records. The text log file is provided for convenience, primarily so that log content can be read without having to run the logViewer command-line tool to convert the log data repository content to plain text.
The text log file does not contain any content that is not also stored in either the log data repository or trace data repository. We can disable the text log to enhance server performance. The text log can be configured to record trace content for debugging convenience.
(ZOS) The text log file only contains log entries generated by the controller process and not those from servant or adjunct processes. As such, application log records are not written to the text log on z/OS. To view log or trace data for all application server processes, use the logViewer command-line tool or the HPEL log viewing tool in the administrative console.
Writing trace to the text log is expensive from a performance perspective.
Log and trace performance
HPEL outperforms the existing basic log and trace facility. One result is that the application server can run with trace enabled while causing less impact to performance than tracing the same components using basic logging. Another result is that applications that frequently write to the logs might run faster with HPEL. A number of factors contribute to the overall performance of HPEL logging and tracing.
- Log and trace events are each stored in only one place
-
Log events, System.out, and System.err are stored in the log data repository. Trace events are stored in the trace data repository. If the text log file is disabled, HPEL might only write log and trace content to these repositories. Storing each type of event in one place ensures that performance is not wasted on redundant data storage.
Log events, and optionally trace events, are written to the text log file when it is enabled. Since this data is always also stored in the log data and trace data repositories, the text log file content is redundant. The text log is convenient for users who do not want to run the logViewer command-line tool to see their logs and trace; but we can disable the text log if this convenience is not needed.

- Log and trace repositories are not shared across processes
-
Synchronizing activities between processes causes a degradation in performance to all processes involved. With HPEL, each server process has its own log data repository, trace data repository, and text log file. Since these files are not shared across processes, the server runtime environment does not need to synchronize with other processes when writing to these destinations.
- Data is not formatted unless it is needed
-
Formatting data for a user to read uses processor time. Rather than format log event and trace event data at run time, HPEL log and trace data is stored more rapidly in a proprietary binary representation. This improves the performance of the log and trace facility. By deferring log and trace formatting until the logViewer is run, sections of the log or trace that are never viewed are never formatted.
We can enable the text log file, which stores the log data and trace data in an already readable text format.
Disable the text log when performance of the server is a key concern, or if the text log is not wanted.bprac
- Log and trace data is buffered before being written to disk
-
Writing large blocks of data to a disk is more efficient than writing the same amount of data in small blocks. HPEL provides buffer log and trace data before writing it to disk. By default, log and trace data is stored in an 8 KB buffer before being written to disk. If the buffer is filled within 10 seconds, the buffer is written to disk. If the buffer is not filled within that time it is automatically written to disk to ensure that the logs have the most current information.
The size of the buffer can be controlled by setting the HPEL.BUFFER.SIZE system property. The frequency that the buffer writes to disk can be controlled by setting the HPEL.FLUSH.PERIOD.SECS system property.
Administration of log and trace
Administrators can configure how much disk space to dedicate to logs or trace, or how long to retain log and trace records, and leave the management of log and trace content up to the server. As another example all log, trace, System.out, and System.err content can be accessed using one easy-to-use command (logViewer), avoiding any possible confusion over which file to access for certain content.
- Reading from the log data and trace data repositories
-
The log data and trace data repositories are stored in a WAS proprietary format and cannot be read using text file editors such as Notepad or VI. We can copy the log data and trace data repositories in to a plain text format using the logViewer command.

- HPEL logViewer command
-
The HPEL logViewer is a command-line tool provided for HPEL users to work with the log data and trace data repositories. The logViewer provides filtering and formatting options that make finding important content in the log data and trace data repositories easy. For example, a user might filter any errors or warnings, then filter all log and trace entries that occurred within 10 seconds of a key error message on the same thread.
- Filtering using log and trace record extension content
-
Use the logViewer command-line tool to filter records based on the content of log and trace record extensions. The application server automatically creates an appName extension for each log and trace record related to a Java EE application, indicating the name of that application. The application server also automatically creates a requestID extension for each log and trace record created during the processing of certain types of requests (for example HTTP or JMS requests), indicating the unique ID of that request.
The requestID extension is added only to log and trace records when Cross-Component Trace is enabled. HPEL also provides the ability for developers to add custom extensions to log and trace records using a log record context API (com.ibm.websphere.logging.hpel.LogRecordContext).
- HPEL in the administrative console
-
The administrative console contains pages that enable HPEL administrators to:
- Configure the HPEL log data repository.
- Configure the HPEL trace data repository.
- Configure the HPEL text log file.
- View the contents of the HPEL log and trace data repositories.
- View and set the log detail levels for logging and tracing.
To use these capabilities, in the administrative console, click Troubleshooting > Logs and Trace link.
Development resources
Log and trace content can be easily filtered to show only the records that are of interest. Use the command line (see the description of the HPEL logViewer command), or developers can create powerful log handling programs using the HPEL API.
- Scripts and Java programs read from the log data and trace data repositories
-
Developers and scripters have a number of options for how to read the log data and trace data repositories:
- Locally or remotely from a wsadmin script, using the HPELControlService JMX Bean
- Locally or remotely from a Java program, using the HPELControlService JMX MBean
- Locally from a Java program, using the com.ibm.websphere.logging.hpel API

- HPEL-related JMX MBeans
-
A MBean interface has been provided to make it easy to access HPEL repository content remotely. For example, a developer might write a JMX client program to read log content from across their WAS cell. This interface is part of the HPELControlService MBean. Refer to the MBean interface documentation for details on the HPEL remote log reading interface.
JMX MBean Description HPELControlService Provide operations related to configuring the log or trace detail level of the server, viewing the log component registry, and querying the log and trace repositories HPELLogDataService Provide operations related to configuring the log data repository of the server HPELTraceDataService Provide operations related to configuring the trace data repository of the server HPELTextLogService Provide operations related to configuring the text log file of the server RasLoggingService Only used for JMX Notification of log events When using HPEL for log and trace rather than basic logging, the log and trace JMX MBean, TraceService, is not used.
- HPEL API
-
An API has been provided to make it easy for developers to develop tools to consume content from the HPEL log and trace repositories. For example, a developer might write a Java program to search the log and trace content to find any messages with message IDs that match a known list of important message IDs. This API is in the com.ibm.websphere.logging.hpel package. Refer to the API documentation for details on the HPEL log reading API.
- Log and trace record extensibility
-
Developers can use HPEL to add custom extensions to log and trace records through a log record context API (com.ibm.websphere.logging.hpel.LogRecordContext). When HPEL stores log and trace records, it includes any extensions present in the log record context on the same thread. For example, a developer might write a servlet filter to add important HTTP request parameters to the log record context. While that servlet runs, HPEL adds those extensions to any log and trace records created on the same thread.
As with other log and trace record fields, developers can access the record extensions using the HPEL API. This is useful when writing tools to read from log and trace repositories. Developers can also make use of the log record context API to access extensions in custom log handlers, filters, and formatters at run time.
Subtopics