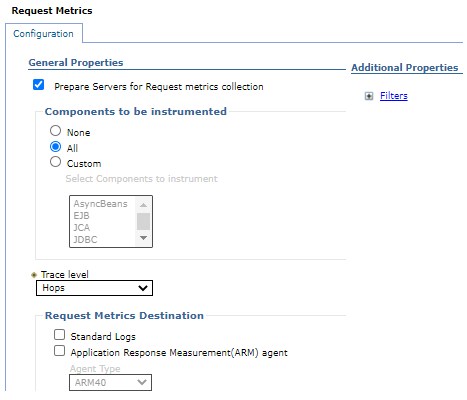
Request metrics
Use this page to enable request metrics, select the components instrumented by request metrics, set trace levels, enable standard logs, enable Application Response Measurement (ARM), specify the type of ARM agent, and specify the ARM transaction factory implementation class name.
From the admin console, click...
-
Monitor and Tuning > Request Metrics

Prepare Servers for request metrics collection
Turns on the request metrics feature.
When unchecked, the request metrics function is disabled. To enable request metrics, check the box, save the change, and restart the server. When it is checked, the server is ready to enable request metrics and we will not need to restart the server. Depending on what option is selected under Components to be instrumented, request metrics instrumentation will be enabled/disabled in various components.
This selection process differs from the Enable Request Metrics check box in WebSphere Application Server v6.0.x. You now have the option of selecting All, None, or Custom. If we select Custom, specify which components we would like to enable.
Enable request metrics
Turn on the request metrics feature. When disabled, the request metrics function is disabled.
Components to be instrumented
Selects the components instrumented by request metrics.
When None is selected, no request metrics instrumentation will be enabled. When All is selected, request metrics instrumentation will be enabled in all the components listed under Custom. When Custom is selected, request metrics instrumentation will be enabled in the selected components.
An edge transaction, which is defined as the first transaction that enters the application server without a parent correlator, will always be instrumented even if the corresponding component is disabled for instrumentation.
Trace level
Specifies how much trace data to accumulate for a given transaction. Note that Trace level and Components to be instrumented work together to control whether or not a request will be instrumented.
Including one of the following values:
- None
- No instrumentation.
- Hops
- Generates instrumentation information on process boundaries only. When this setting is selected, we see the data at the application server level, not the level of individual components such asweenterprise beans or servlets.
- Performance_debug
- Generates the data at Hops level and the first level of the intra-process servlet and EJB call (for example, when an inbound servlet forwards to a servlet and an inbound EJB calls another EJB). Other intra-process calls like naming and service integration bus (SIB) are not enabled at this level.
- Debug
- Provides detailed instrumentation data, including response times for all intra-process
calls.
Requests to servlet filters will only be instrumented at this level.
Standard logs
Enables the request metrics logging feature.
Select this check box to trigger the generation of request metrics logs in the SystemOut.log file.
Since enabling the request metrics logging feature will increase processor usage, IBM recommends using this feature together with filters so that only selected requests are instrumented.
Application Response Measurement (ARM) agent
Enables request metrics to call an underlying Application Response Measurement (ARM) agent.
Before enabling ARM, we need to install an ARM agent and configure it to the appropriate classpath and path, following the instructions of the ARM provider.
Specify ARM agent
Type of ARM agent to use.
The ARM 4.0 agent and Tivoli ARM 2.0 agent are supported.
ARM transaction factory implementation class name
The ARM transaction factory implementation class name in the package supplied by your provider. This field is required when ARM 4.0 agent is selected, but it is not required when Tivoli ARM agent is selected.
In this field, type the name of the ARM transaction factory implementation class that is present in the ARM library. Be sure to follow the instructions of the ARM provider and understand the name of the ARM transaction factory class for the installed ARM agent.
Filters
When filtering is enabled, only requests matching the specified filter will generate request metrics data. Filters exist for source IP address, URI name, EJB method name, JMS parameters, and the WebServices parameters.