Get performance data from request metrics
This topic describes how to enable request metrics.
Request metrics is a tool that enables us to track individual transactions, recording the processing time in each of the major WebSphere Application Server components.
We can enable request metrics from the following locations:
- The administrative console. To enable request metrics in the administrative console, refer to the instructions under the Steps for this task section that follows.
- Command line. Java Management Extensions (JMX) interfaces are exposed for enabling request metrics through external tools. For more details on the exposed interfaces, refer to the request metrics API documentation.
To enable request metrics in the administrative console:
Tasks
- Open the administrative console and click..
-
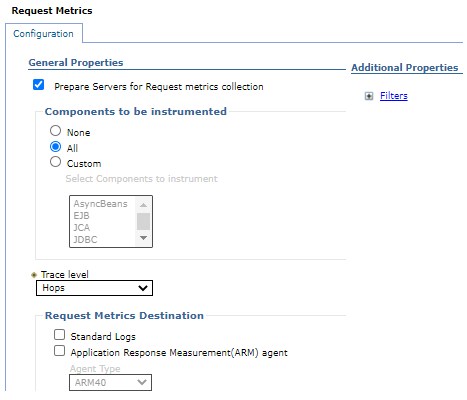
Monitor and Tuning > Request Metrics

- Verify that Prepare servers for request metrics collection check box is selected. If Prepare servers for request metrics collection check box is not selected, we will have to select it, save the change, and restart the server.
- Select All, None, or Custom under Components to be instrumented to specify the request metrics components. If we select Custom, be sure to select the components we would like to enable.
- Specify the components instrumented by request metrics.
- Specify how much data to collect.
- Enable and disable logging.
- Enable Application Response Measurement (ARM) Agent.
- Specify which ARM type to use.
- Specify the name of the ARM transaction factory implementation class.
- Isolate performance for specific types of requests.
- Click Apply or OK.
- Click Save.
The request metrics is enabled.
What to do next
To ensure that the web server plug-in recognizes the changes we made for the request metrics configuration, follow the steps in Regenerating the web server plug-in configuration file, if logging time spent in the web server.
Subtopics
- Request metrics
- Application Response Measurement
- Isolating performance for specific types of requests
- Specify how much data to collect
- Request metrics trace filters
- Regenerating the web server plug-in configuration file
- Enable and disable logging
- (iSeries) Prepare a server to use ARM