Configure TPV settings
Overview
You can configure user and logging settings of the Tivoli Performance Viewer (TPV). Configuring the TPV settings affects the performance of your appserver.
TPV monitors the performance activity of all servers on a node.
The data can also be viewed from the deployment manager.
You can configure the activity monitoring of TPV on a per-user basis. Any changes made to TPV settings are only for the server being monitored and only affect the user viewing the data.
You can change the user and log TPV settings in the console.
Procedure
- Configure the TPV user settings.
- Click...
Monitoring and Tuning | Performance Viewer | Current Activity | server | Settings | User

...in the console navigation tree. To see the User link on the Tivoli Performance Viewer page, expand the Settings node of the TPV navigation tree on the left side of the page. After clicking User, the TPV user settings are displayed on the right side of the page.
- Change the values as needed for the user settings. The settings are described briefly below and in more detail in the Tivoli Performance Viewer settings.
Refresh Rate Specifies how frequently TPV collects performance data for a server from the Performance Monitoring Infrastructure (PMI) service provided by that server. The default is 30 seconds. To collect performance data for the server more frequently, set the refresh rate to a smaller number. To collect performance data less frequently, set the refresh rate to a larger number. The allowed range is 5 to 500 seconds.
Buffer Size Specifies the number of entries to be stored for a server. Data displayed in TPV is stored in a short in-memory buffer. After the buffer is full, each time a new entry is retrieved the oldest entry is discarded. The default buffer size is 40 entries. Supported values are 10, 20, 30, 40, 50, 60, 70, 80, 90 and 100. The larger the buffer size, the more memory is consumed. Thus, specify a buffer size that allows you capture enough monitoring data for analysis without wasting memory storing unneeded data. View Data As Specifies how counter values are displayed. Viewing options include the following: - Raw Value
- Displays the absolute value. If the counter represents load data, such as the average number of connections in a database pool, then TPV displays the current value followed by the average. For example, 18 (avg:5).
- Change in Value
- Displays the change in the current value from the previous value.
- Rate of Change
- Displays the ratio change/(T1 - T2), where change is the change in the current value from the previous value, T1 is the time when the current value was retrieved, and T2 is the time when the previous value was retrieved.
The refresh rate and buffer size settings combine to control how much temporal history you have for the appserver. The default values for Refresh Rate (30 seconds) and Buffer Size (40 entries) provide you with a 20-minute history of the appserver’s performance. Changing one of these parameters affects the length of the temporal history.
The values you set for Refresh Rate and Buffer Size depend on your use of TPV. To diagnose a known problem on a test machine, you might poll data more frequently while having a decreased buffer size. To monitor a production server, you might poll data less frequently and specify a buffer size depending on how much history you want. However, TPV is not intended to be a full-time monitoring solution.
- Click Apply.
- Click...
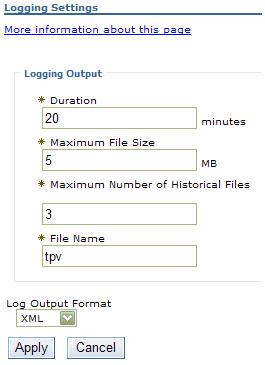
- Configure the TPV log settings. The log settings control what happens when Start Logging is clicked in, for example, a summary report on the performance of a servlet, enterprise bean (EJB), EJB method, connection pool or thread pool.
- Click...
Monitoring and Tuning | Performance Viewer | Current Activity | server | Settings | Log

...in the console navigation tree. To see the Log link on the Tivoli Performance Viewer page, expand the Settings node of the TPV navigation tree on the left side of the page. After clicking Log, the TPV log settings are displayed on the right side of the page.
- Change the values as needed for the log settings. The settings are described below and in the Tivoli Performance Viewer settings.
Duration Length of time, in minutes, that logging continues, unless Stop Logging is clicked first. TPV is not intended as a full-time logging solution. Maximum File Size Specifies the maximum size, in megabytes, of a single file. Note that TPV automatically zips log files to save space and this parameter controls the pre-zipped file size and not the post-zipped, which is smaller. Maximum Number of Historical Files Specifies the number of files TPV writes before stopping. If TPV reaches the maximum file size before the logging duration ends, it continues logging in another file, up to the maximum. If TPV reaches the maximum number of historical files before the logging duration ends, TPV deletes the oldest historical file and continues logging in a new file. The total amount of data that is stored is constrained by the Maximum File Size and Maximum Number of Historical Files parameters. File Name Specifies the name of the log file. The server name and the time at which the log is started is appended to the log name to help users identify a log file. Log Output Format Specifies whether TPV writes log files as XML or in a binary format. Binary format is recommended as it provides a smaller log file when uncompressed. - Click Apply.
- Click...
View current performance activity
Monitor performance with Tivoli Performance Viewer (TPV)
Related Reference
View Data with the Tivoli Performance ViewerSelecting a server and changing monitoring status