View Data with the Tivoli Performance Viewer
To...
- view performance data for a server
- change user and log settings
- view summary reports
- view information on specific performance modules
...go to...
Monitoring and Tuning | Performance Viewer | Current Activity | server
Options
- Refresh
- Rebuild the navigation tree. Use when available Performance Monitoring (PMI) Infrastructure data has changed, and the tree does not reflect those changes.
- View Module(s)
- Click after one or more performance modules are selected in the tree to display the information for these modules in the data viewing panel.
The Data Monitoring panel enables the selection of multiple counters and displays the resulting performance data for the associated resources. It consists of two panels:
- View Counter panel
- Counter Selection panel. If necessary, you can change the scaling factors by editing the default values in the scale field.
- View Counter panel
- Deselect all items
-
Select Deselect all items to quickly deselect all modules that are selected in the navigation tree.
- Navigation tree
- Use the navigation tree to view advisor output, configure TPV, and select PMI modules for viewing.
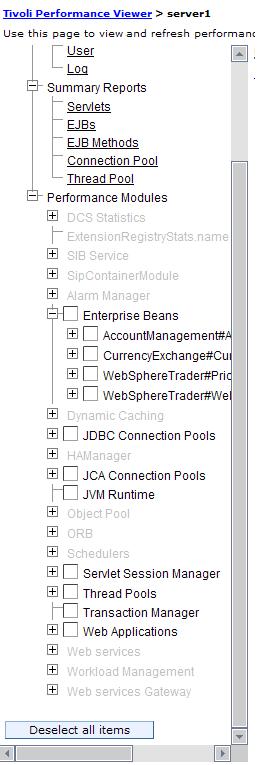
- Click the Advisor node to have the advisor display the data in the viewing panel.
- Expand the Settings node to select and configure either the User or Log settings.
- Expand the Performance Modules node to view one or more PMI modules.
- Click the Advisor node to have the advisor display the data in the viewing panel.
- Advisor
- Click Advisor to examine various data while your application is running. The Performance Advisor provides advice to help tune systems for optimal performance using the PMI data collected.
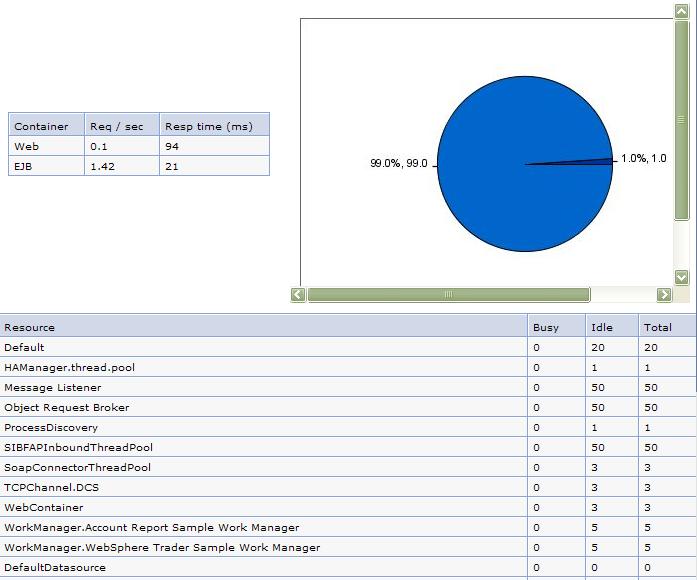
The first table represents the number of requests per second and the response time in milliseconds for the Web container.
The pie graph displays the CPU activity as a percentage of busy and idle.
The third table displays average thread activity for the different resources, for example, Default, Object Request Broker, and Web container. Activity is expressed as the number of threads or connections busy and idle.
To view detailed information about the advice, select the message you want to view. This view provides additional information about the advice message, severity, description, user action, and detail.
- User settings
- Change the values as needed for the following user settings:
Refresh Rate Specifies how frequently TPV collects performance data for a server from the PMI service provided by that server. The default is 30 seconds. To collect performance data for the server more frequently, set the refresh rate to a smaller number. To collect performance data less frequently, set the refresh rate to a larger number. The allowed range is 5 to 500 seconds. Buffer Size Specifies the amount of data to be stored for a server. Data displayed in TPV is stored in a short in-memory buffer. After the buffer is full, each time a new entry is retrieved the oldest entry is discarded. The default buffer size is 40. Allowed values are 10, 20, 30, 40, 50, 60, 70, 80, 90 and 100. The larger the buffer size, the more memory is consumed. Thus, specify a buffer size that allows you capture enough monitoring data for analysis without wasting memory storing unneeded data. View Data As Specifies how counter values are displayed. Viewing options include the following: - Raw Value
- Displays the absolute value. If the counter represents load data, for example, the average number of connections in a database pool, then TPV displays the current value.
- Change in Value
- Displays the change in the current value from the previous value.
- Rate of Change
- Displays the ratio change/(T1 - T2), where change is the change in the current value from the previous value, T1 is the time when the current value was retrieved, and T2 is the time when the previous value was retrieved.
- Log settings
- The log settings control what happens when Start Logging is clicked in, for example, a summary report on the performance of a servlet, EJB, EJB method, connection pool or thread pool.
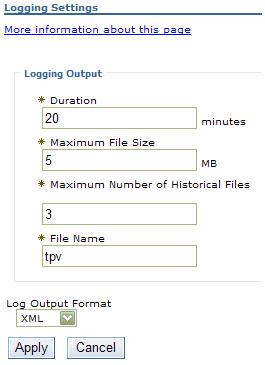
Change the value as needed for the following log settings:
Duration Length of time, in minutes, that logging continues, unless Stop Logging is clicked first. TPV is not intended as a full-time logging solution. Maximum File Size Specifies the maximum size, in megabytes, of a single file. Note that TPV automatically zips log files to save space and this parameter controls the pre-zipped file size and not the post-zipped, which is smaller. Maximum Number of Historical Files Specifies the number of files TPV writes before stopping. If TPV reaches the maximum file size before the logging duration ends, it continues logging in another file, up to the maximum. If TPV reaches the maximum number of historical files before the logging duration ends, TPV deletes the oldest historical file and continues logging in a new file. The total amount of data that is stored is constrained by the Maximum File Size and Maximum Number of Historical Files parameters. File Name Specifies the name of the log file. The server name and the time at which the log is started is appended to the log name to help users identify a log file. Log Output Format Specifies whether TPV writes log files as XML or in a binary format. Binary format is recommended as it provides a smaller log file when not compressed. - View summary reports
- Summary reports are available for each appserver.
Before viewing reports, make sure data counters are enabled and monitoring levels are set properly.
The standard monitoring level enables all reports except the report on EJB methods. To enable an EJB methods report, adjust the PMI level to include EJB method data.
Tivoli Performance Viewer provides the following summary reports for each appserver:
- Servlets
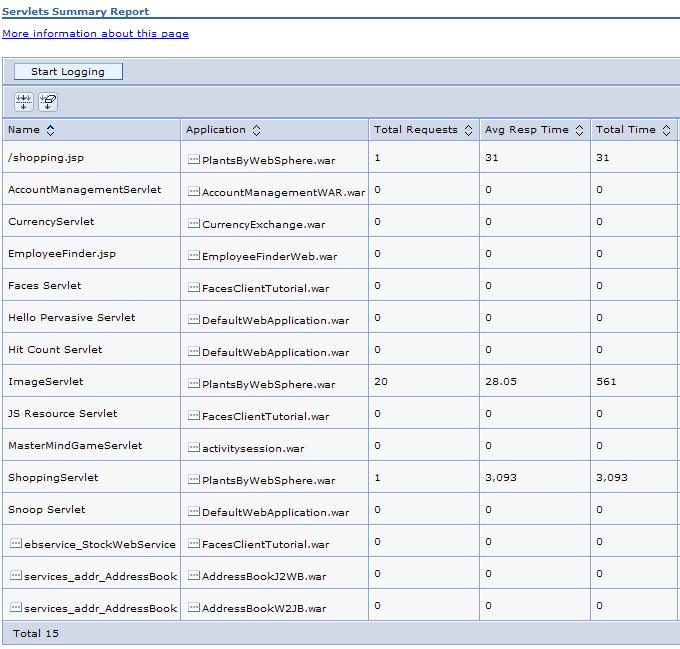
- The servlet summary lists all servlets running in the current appserver. Use the servlet summary view to quickly find the most time intensive servlets and the applications that use them, and to determine which servlets are invoked most often. You can sort the summary table by any of the columns.
Tips
- Sort by Avg Response Time to find the slowest servlet or JavaServer page .
- Sort by Total Requests to find the servlet or JSP used the most.
- Sort by Total Time to find the servlet or JSP with the highest response times.
- Sort by Avg Response Time to find the slowest servlet or JavaServer page .
- Enterprise JavaBeans
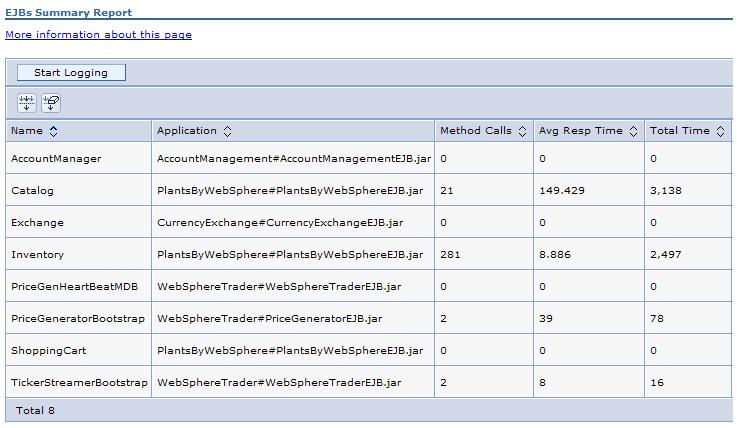
- The EJB summary lists all enterprise beans running in the server, the amount of time spent in their methods, the number of EJB invocations, and the total time spent in each enterprise bean.
total_time = number_of_invocations * time_in_methods
Sort the various columns to find the most expensive enterprise bean. Also, if the PMI counters are enabled for individual EJB methods, select the check box next to the EJB name see statistics for each of the methods.
Tips
- Sort by Avg Response Time to find the slowest enterprise beam.
- Sort by Method Calls to find the enterprise bean used the most.
- Sort by Total Time to find the enterprise bean with the slowest response time.
- Sort by Avg Response Time to find the slowest enterprise beam.
- EJB Methods
- The EJB method summary shows statistics for each EJB method. Use the EJB method summary to find the most costly methods of your enterprise beans.
Tips
- Sort by Avg Response Time to find the slowest EJB method.
- Sort by Method Calls to find the EJB method used the most.
- Sort by Total Time to find the EJB method with the slowest response time.
- Sort by Avg Response Time to find the slowest EJB method.
- Connection pools
-
The connection pool summary lists all data source connections that are defined in the appserver and shows their usage over time.

When the application is experiencing normal to heavy usage, the pools used by that application should be nearly fully utilized. Low utilization means that resources are being wasted by maintaining connections or threads that are never used. Consider the order in which work progresses through the various pools. If the resources near the end of the pipeline are under utilized, it might mean that resources near the front are constrained or that more resources than necessary are allocated near the end of the pipeline.
- Thread pools
- The thread pool summary shows the usage of all thread pools in the appserver over time.
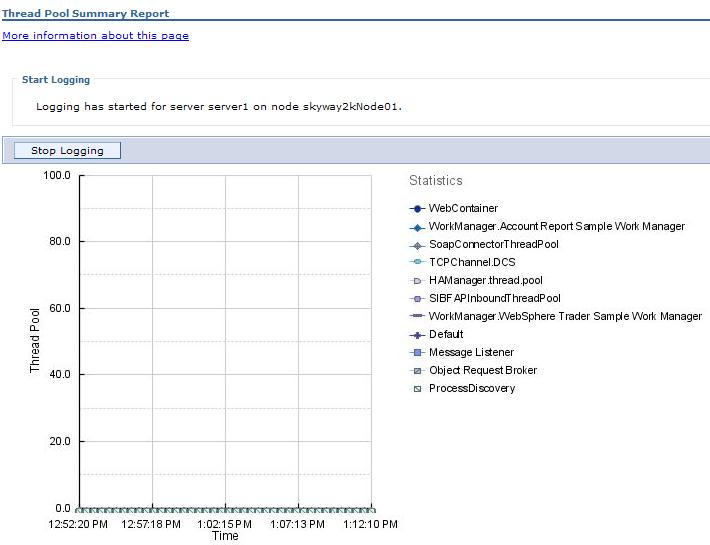
When the application is experiencing normal to heavy usage, the pools used by that application should be nearly fully utilized. Low utilization means that resources are being wasted by maintaining connections or threads that are never used. Consider the order in which work progresses through the various pools. If the resources near the end of the pipeline are under utilized, it might mean that resources near the front are constrained or that more resources than necessary are allocated near the end of the pipeline.
- Performance module
- View performance modules that provide graphics and charts of various performance data on system resources such as CPU utilization, on WAS pools and queues such as database connection pools, and on customer application data such as servlet response time. In addition to providing a viewer for performance data, TPV enables you to view data for other products or customer applications that have implemented custom PMI.

Each performance module has several counters associated with it. These counters are displayed in a table underneath the data chart or table. Selected counters are displayed in the chart or table. You can add or remove counters from the chart or table by selecting or deselecting the check box next to them. By default, the first three counters for each module are shown.
Tivoli Performance Viewer displays interactive graphics using the Scalable Vector Graphics (SVG) format or non-interactive graphics using the JPG format. The SVG format is recommended because it provides a better user experience and is more processor and memory efficient for the appserver.
In the performance module, you view current activity. This is a real time operation where the state of various system resources and their usage is displayed. Unless logging is turned on, data generated in this scenario will not be saved and is unavailable for subsequent viewing and analysis. To monitor behavior and system resources, click Start Logging. The user can replay and analyze the file at a later time.
Start Logging/Stop Logging
Use this to start or stop logging performance data. Once you start monitoring for your server, you will be able to view real time operation in the TPV panels.
Reset to Zero
This sets a new baseline using the current counter readings at the instant the button is clicked. Future data points are plotted on the graph relative to their position at the time Reset to Zero is clicked. Data points gathered prior to the time Reset to Zero is clicked are not displayed, although they are still held in the TPV buffer. If Undo Reset to Zero is clicked again, TPV displays all data currently in the buffer from their original baseline, not from the Reset to Zero point.
View Table/View Graph
To view the data in a table, click View Table on the counter selection table. To toggle back to a chart, click View Graph.
Show Legend/Hide Legend
To view the legend for a chart, click Show Legend. To hide the legend, click Hide Legend.
Clear Buffer
To clear values from the table or chart, click Clear Buffer beneath the chart or table. This removes all PMI data.
- Unable to view Scalable Vector Graphics on Internet Explorer
- If you encounter problems while viewing SVG with your Internet Explorer browser, visit the Adobe SVG website at http://www.adobe.com/svg/main.html to test your Adobe SVG Viewer. You can also download the most recent version of the Adobe SVG Viewer, view the release notes, and report any bugs with the Adobe SVG Viewer from this Web site.
Related tasks
View current performance activityMonitor performance with Tivoli Performance Viewer (TPV)
Monitor overall system health