System event logging
- Overview
- Message logging
- Trace logging
- Use separate log files for the portal
- Change the log file name and location
- Change the language used in the log file
- Reference: Log file format
Overview
The system event logging facility of IBM WebSphere Portal enables the recording of information about the operation of the portal. Event logs provide administrators with information on important or abnormal events, especially errors that occur during the operation of the portal. In addition, event logs gather debugging information that helps IBM support to resolve problems with the operation of the portal.
WebSphere Portal provides two types of logging:
- Logging of messages
- Logging of debugging messages called traces
Message logging
WebSphere Portal provides the logging of messages that report errors and status information.
The following types of messages are provided:
- Informational
- A condition worth noting but does not require the user to perform an action.
- Warning
- An abnormal condition has been detected. The user may have to take action. However, WebSphere Portal code is able to handle the condition without failing.
- Error
- A serious failure in the execution of the application that requires further action.
Trace logging
WebSphere Portal provides the logging of debugging messages called traces. These traces are useful for fixing problems. However, to save system resources, they are switched off by default.
Traces can be set for different durations:
- Temporary
- Traces can be set for a temporary period by using the administration portlet Enable Tracing or the IBM WAS Administrative Console. To set traces by using the portlet...
- Log in to the portal as administrator.
- From the Main Menu click...
Administration | Portal Analysis | Enable Tracing
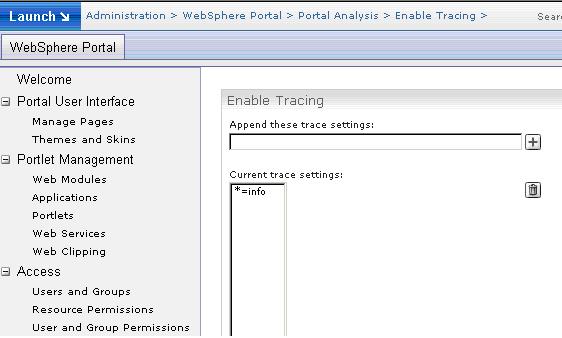
The Enable Tracing portlet appears.
- Type the required trace string into the field Append these trace settings:. For example, this can be...
com.ibm.wps.command.credentialvault.*=finest
- Click the Add icon. Enable Tracing updates the field Current trace settings:
Restarting the portal will remove traces that were set by using the Enable Tracing Administration portlet. To disable tracing, do either of the following:
- Select the current trace settings under...
Current trace settings:...and click the Remove icon. By the example given above, the current setting can be...
com.ibm.wps.command.credentialvault.*=finest
- Type the trace string *=info into the field Append these trace settings: and click the Add icon. This trace string overwrites all settings listed under Current trace settings: and resets it to the default.
- Extended
- To enable trace settings for a longer period of time, that is, for more than one session, switch them on in the WAS configuration. Proceed by the following steps:
- Access the WAS Administrative Console by using this URL:
http://hostname:port/ibm/console
- Go to...
Server | Application servers | application_server | Troubleshooting | Change Log Detail Levels
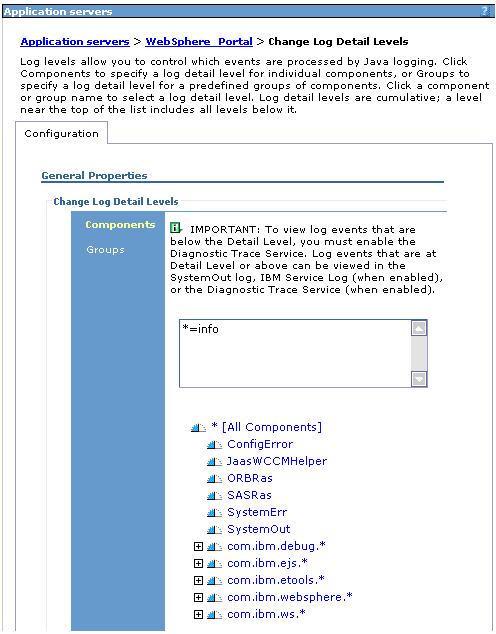
- Specify the required trace settings. For example, this can be...
com.ibm.wps.command.credentialvault.*=finest
- Save the updates.
- Restart the portal.
- To disable tracing, specify tracestring: *=info and restart the portal.
Use separate log files for the portal
WebSphere Portal supports the redirection of trace and message logging into separate log files.
The redirection is disabled by default. If enabled, the portal creates a log file and logs traces and messages to this new file, and no longer to the log files of WAS.
To enable redirection into separate log files set...
useAppServerLog = false...in...
portal_server_root/shared/app/config/log.properties
Change the log file name and location
When you configure WebSphere Portal to write its trace and message logging to a separate log file, a new file is created...
portal_server_root/log/wps_date.log
The date is replaced by the date on which the log is created. This information is automatically inserted in the log file name. This file is updated when an error occurs or if trace logs are created.
To change the name and location of this file, set...
logFileName...in...
portal_server_root/shared/app/config/log.properties
The specified log file name can contain one of two tokens that are automatically replaced with the corresponding values when starting WebSphere Portal:
$APPSERVER_NAME Name of the application server. Use this token for vertical clusters to enforce that the different application servers write into different files or directories if they share the same file system. $CREATE_TIME The date and time at which the file was created.
We can specify the location of the log file either using a relative or absolute path.
A value such as...
logfilename=log/$APPSERVER_NAME/Portal_$CREATE_TIME.log...causes the log file to be created in a directory that is relative to the WebSphere Portal installation directory. In this case, on a machine that is named PORTAL1, the log file would be created in...
portal_server_root/log/PORTAL1/Portal_2003.05.16-13.36.14.log
The value...
log/wps_$CREATE_TIME.log...is the default location for the log file.
A value such as...
logfilename=c:/temp/wps_$CREATE_TIME.log...causes the log file to be created in the absolute location specified.
If you change the location of the log file, restart WebSphere Portal in order to use the new location.
Change the language used in the log file
By default, information in the log file is written in the language that was used for the WebSphere Portal installation. However, because WebSphere Portal supports a number of languages, we can choose to have the log file information written in a language other than that used during installation.
To change the language used for the log file, edit...
portal_server_root/shared/app/config/log.properties
...and add the following line...
locale=xx...where xx is the two-letter abbreviation for the locale. For a list of the locale abbreviations used with WebSphere Portal, refer to For example, to have log information generated in English, you would add the following line:
locale=en
Reference: Log file format
If the logs are written to the log file of WebSphere Portal and not redirected to the logging facility WAS, the log file consists of a sequence log records that are separated by blank lines.
The log records have the following format:
timestamp classification classname method threadID
     messagecode: logmessage
Where:
timestamp Time (to the millisecond) When the log record was created. classification One of the following letters:
E error messages W warning messages I informational messages l traces (low details) m traces (medium details) h traces (high details) classname Java class containing the code that triggered the log event. method Name of the Java method containing the code that triggered the log event. messagecode Unique identifier for this message, to uniquely identify the specific message and refer to it when consulting documentation or portal support. The message code is only available for error, warning, or informational messages, and not for traces. It consists of:
- Four-character identifier for the portal component that defines the message.
- Four-digit number identifying the message in the component.
- One-letter classification code, which can be E, W or I, as defined above.
logmessage Actual log message describing the logged event. Error, warning, and informational messages are translated into the system locale for the portal. Trace messages are not translated. threadID Identification of the thread that triggered the log event.
- Traces are written only if the specific tracing facility is enabled; all other messages are written unconditionally.
- The system locale for the portal is part of the general internationalization features of WebSphere Portal and can be configured via LocalizerService. For more information see the information center topic Portal configuration.
The following is an example of a log record:
2003.05.16 13:36:14.449 W com.ibm.wps.services.datastore.DataStoreServiceImpl init 0000003a DSTO0063W: The transaction isolation level is not set to READ_COMMITTED.

The current value is TRANSACTION_REPEATABLE_READ.
Related information
- Portal configuration
- Administering
- WebSphere Portal logs
- Designing
- Develop portlets
- Troubleshooting
- Directory structure
Parent Topic
Logging and tracing