Types of event
WebSphere MQ instrumentation events come in the following types:
- Queue manager events
- These events are related to the definitions of resources within queue managers. For example, an application tries to put a message to a queue that does not exist.
- Channel and bridge events
- These events are reported by channels as a result of conditions detected during their operation. For example, when a channel instance is stopped.
- Performance events
- These events are notifications that a threshold condition has been reached by a resource. For example, a queue depth limit has been reached.
- Configuration events
- These events are notifications that some action has been performed on
an object. They are generated automatically when an object is created, changed,
or deleted, or when they are explicitly requested for. For example, when a
namelist is created.
Configuration events are available with WebSphere MQ for z/OS only.
- Command events
- These events are notifications that a WebSphere MQ command has been performed
successfully.
Command events are available with WebSphere MQ for z/OS only.
- Logger events
- These events are notifications that the queue manager has started
writing to a new log extent. Logger events are only available on queue managers
that use linear logging.
Logger events are not available with WebSphere MQ for z/OS.
For each queue manager, each category of event has its own event queue. All events in that category result in an event message being put onto the same queue.
| This event queue: | Contains messages from: |
| SYSTEM.ADMIN.QMGR.EVENT | Queue manager events |
| SYSTEM.ADMIN.CHANNEL.EVENT | Channel events |
| SYSTEM.ADMIN.PERFM.EVENT | Performance events |
| SYSTEM.ADMIN.CONFIG.EVENT | Configuration events |
| SYSTEM.ADMIN.COMMAND.EVENT | Command events |
| SYSTEM.ADMIN.LOGGER.EVENT | Logger events |
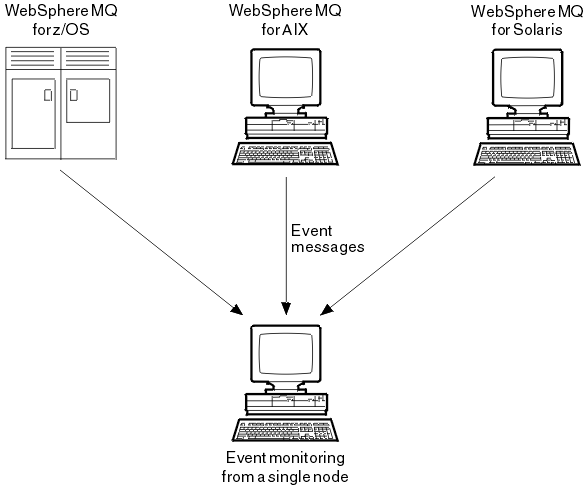
By incorporating instrumentation events into your own system management application, we can monitor the activities across many queue managers, across many different nodes, for multiple WebSphere MQ applications. In particular, you can monitor all the nodes in your system from a single node (for those nodes that support WebSphere MQ events) as shown in Figure 2.
Instrumentation events can be reported through a user-written reporting mechanism to an administration application that can present the events to an operator.
Instrumentation events also enable applications acting as agents for other administration networks, for example NetView, to monitor reports and create the appropriate alerts.
|
|