|
|
| Troubleshooting the dynamic cache service
In case you are experiencing problems related to the WebSphere Dynamic Cache service, follow these steps to resolve your problem:
|
| 1.
| Use the Cache monitor to test.
|
| 2.
| Verify cachespec.xml file.
|
| 3.
| Review the JVM logs for your appserver. Messages prefaced with DYNA result from dynamic cache service operations.
|
|
a.
View the JVM logs for your appserver. Each server has its own JVM log file. For example, if your server is named Member_1, the JVM log is located in the subdirectory <install_root>/logs/Member_1/.
Alternatively, you can use the Administrative Console to review the JVM logs, click Troubleshooting -> Logs and Trace -> <server_name> -> JVM Logs -> Runtime tab -> View.
|
|
b.
Find any messages prefaced with DYNA in the JVM logs, and write down the message IDs. A sample message having the message ID DYNA0030E follows:
DYNA0030E: "property" element is missing required attribute "name".
|
|
c.
Find the message for each message ID in the WAS InfoCenter. In the InfoCenter navigation tree, click <product_name> -> Reference -> Messages -> DYNA to view dynamic cache service messages.
|
|
d.
Try the solutions stated under User Action in the DYNA messages.
|
| 4.
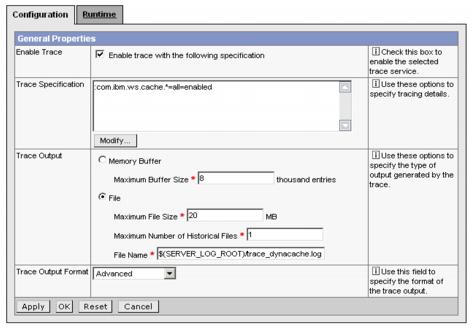
| Enable tracing on the appserver for com.ibm.ws.cache.*. To enable it, click Troubleshooting -> Logs and Trace -> <server_name> -> Diagnostic Trace -> Configuration tab. You can then configure the tracing options as shown in Figure 14-27.
If you experience problems with cache replication, then you need to enable the trace for com.ibm.ws.drs.*.
You need to restart the server and monitor the trace file.

Figure 14-27 Dynamic cache tracing configuration
|
|
Prev | Home | Next
WebSphere is a trademark of the IBM Corporation in the United States, other countries, or both. IBM is a trademark of the IBM Corporation in the United States, other countries, or both. |
