ThreadAnalyzer usage example
This section explains how you can use ThreadAnalyzer to determine the reason for a performance problem. The example assumes a Web application is running with the file serving servlet enabled. For each request to the Web container, a 100 KB file is served. The expected transaction rate is about 10 requests/second. However, the observed rate is only about two requests/second. Why is the performance so bad? How can you diagnose this problem?
Use ThreadAnalyzer to capture several successive thread dumps from the JVM over a short time period, in order to observe any patterns in thread activity. Remember, the thread dumps are captured using the Ctrl+G keyboard shortcut or the menu option Get Thread Dump. Each dump is then parsed and sorted into views that are accessible through the expandable tree in the left-hand pane. The collection of dumps can also be saved in ThreadAnalyzer projects for later review.
After capturing a thread dump, ThreadAnalyzer's analysis graph shows all of the work being done by the servlet engine as shown in Figure 16-30.

Figure 16-30 ThreadAnalyzer's analysis graph
The 26% of the graph represents the servlet threads that are responding to requests. All servlet threads appear to be busy, yet how can you reconcile this with the observed transaction rate of only two requests/second? You need to know what method(s) these threads were executing at the time the dump was captured. To investigate further, look at the Servlet thread pool analysis view as detailed in Figure 16-31.
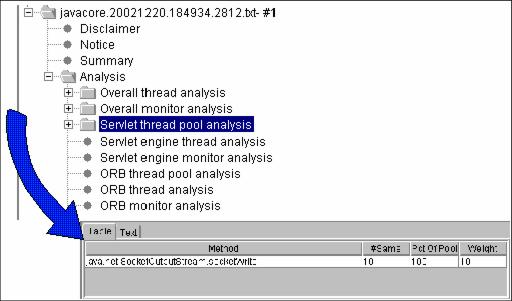
Figure 16-31 Servlet thread pool analysis view
This view shows 100% of servlet threads in the socketWrite call. Expanding the tree node reveals the list of servlet threads. Selecting a thread displays its stack in the right-hand pane as shown in Example 16-8.
Example 16-8 Thread stack

java.net.SocketOutputStream.socketWrite
java.net.SocketOutputStream.write
com.ibm.ws.io.Stream.write
com.ibm.ws.io.WriteStream.flushMyBuf
com.ibm.ws.io.WriteStream.write
com.ibm.ws.http.ResponseStream.writeChunk
com.ibm.ws.http.ResponseStream.write
com.ibm.ws.io.WriteStream.flushMyBuf
com.ibm.ws.io.WriteStream.write
com.ibm.ws.webcontainer.http.HttpConnection.write
com.ibm.ws.webcontainer.srp.SRPConnection.write
com.ibm.ws.webcontainer.srt.SRTOutputStream.write
com.ibm.ws.webcontainer.srt.BufferedServletOutputStream.writeOut
com.ibm.ws.webcontainer.srt.BufferedServletOutputStream.write
com.ibm.ws.webcontainer.servlet.MyMainServlet.doGet
javax.servlet.http.HttpServlet.service

Read the stack from bottom to top to see that an instance of HttpServlet named MyMainServlet has been invoked. In its doGet method, the servlet performs a write operation to a BufferedServletOutputStream. The remaining calls up the stack are all internal details of opening an HttpConnection. The top of the stack shows the thread in the socketWrite call at the time the dump was captured.
The content of what is being written to the socket is not as important as the observation that the servlet is sending a response back to the client. In isolation, one thread caught in a socketWrite would not be any cause for concern. However ThreadAnalyzer's summary view reports that 100% of the servlet threads are in this same call. Examining consecutive thread dumps reveals a similar pattern of activity. What does this tell you?
This is unusual, since under normal activity you would expect to see threads in a variety of method calls. Seeing so many threads in the socketWrite method consistently over a short time period indicates that the socketWrite call is requiring a longer time period to complete, relative to other method calls. You can now rule out the appserver as the source of the bottleneck, and focus on the network as the source of the problem. After assigning a network engineer to examine the network path from the application server to the client, it turns out that the server's network adapter had been inadvertently set to half-duplex instead of full. Setting the network adapter to full-duplex cleared the bottleneck.
In summary, ThreadAnalyzer facilitates easier problem determination through the use of thread dumps. By quickly pinpointing areas of thread contention, problem turnaround times can be improved, resulting in reduced support costs as well as overall increased customer satisfaction.
WebSphere is a trademark of the IBM Corporation in the United States, other countries, or both.
IBM is a trademark of the IBM Corporation in the United States, other countries, or both.