The Monitoring - Tuning - Testing cycle
Perform an initial load test to get a baseline that you can refer to later to, with the Performance Advisor facility enabled. Use the number of users at your saturation point as the load parameter in all future load tests. Check the monitors in TPV according to the top-ten hotlist and the Performance Advisors. After you have implemented an advisor's recommendation, perform another test cycle to find out if you have gained throughput (because of a decreased average response time) or freed resources (for example, memory by reducing thread pools) which you could then possibly spend on other components that need more memory resources. Repeat this procedure to find an optimum configuration for your system and application. Keep in mind that performance tuning is an iterative process, so do not rely on results from a single run.
Here is a short overview of the steps necessary to perform a load test for tuning purposes with Tivoli Performance Advisor as described above:
1. Enable the JVMPI facility for the appserver.
2. Enable the PMI service in the appserver and Node Agent (if using a WebSphere Network Deployment environment), and restart both.
3. Start Tivoli Performance Viewer and set monitoring levels to Standard.
Note Some JVM rules need instrumentation level set to max. TPA will print a message if it needs a higher monitoring level. |
4. Simulate your representative production level load using a stress test tool. Make sure that there are no errors or exceptions during the load test. Record throughput and average response time statistics to plot a curve at the end of all testing iterations.
5. Check Tivoli Performance Advisor and apply advice and follow your own intuition. Restart components or services if necessary. Reset all components (for example, the database) to the initial state.
6. Retest (go back to step 4).
Data capture best practices
To get accurate results, mind the following best practices for data capturing: Measure during steady-state of the load test
Do not include ramp-up/ramp-down times in your performance data measurements and analysis (see Figure 19-4). Measure during the steady-state when the maximum of users are concurrently performing requests. Monitor machine logs and resources
Monitor important log files for exceptions or errors. Be sure that there are no exceptions or deadlocks in the database. Keep an eye on system resources like memory, paging activity, CPU, disk IO, network utilization, socket states, etc., for bottlenecks.
Important log files are SystemOut.log and SystemErr.log. Monitor these logs to make sure your application runs without errors. SystemErr.log should typically remain free of entries. Errors logged there must be solved before you can capture meaningful performance data. Likewise, any sort of exception in SystemOut.log during the performance run should be solved before another run, because exception handling and the I/O necessary to write stacks to the log are expensive operations that impact performance.
For a Network Deployment cluster, you don't need to repeat all the monitoring steps for each cluster member if they are all set up identically; monitoring one or two representative cluster members should be sufficient. What is essential however, is to check the CPU statistics for each node to make sure that all cluster member processes are using similar amounts of CPU and there are no extra processes consuming CPU on any nodes that can interfere with the appserver CPU efficiency. Test on quiet systems
Avoid testing during database backups or maintenance cycles. Use isolated networks
Whenever possible, load driving machines should be sharing the same network switch/router as your Web appservers, to rule out additional network latency and network delays. Performance tuning is an iterative process
10-15 test runs are quite usual during tuning phase. Perform long lasting runs to detect resource leaks, for example, memory leaks, where the load tested application runs out of heap space only after a given time.
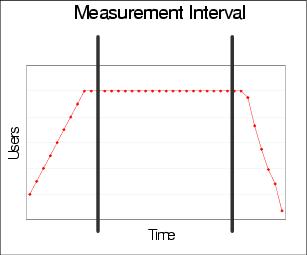
Figure 19-4 Measurement interval: concurrently active users versus elapsed time
WebSphere is a trademark of the IBM Corporation in the United States, other countries, or both.
IBM is a trademark of the IBM Corporation in the United States, other countries, or both.
Tivoli is a trademark of the IBM Corporation in the United States, other countries, or both.