Performance Monitoring Infrastructure
Performance Monitoring Infrastructure (PMI) APIs capture performance data for...
- system resources
- WAS queues
- application code
...with minimal performance impact.
PMI uses a client-server architecture. The server collects performance data in memory within the WAS. This data consists of counters such as servlet response time and data connection pool usage. A client can then retrieve that data using a Web client, a Java client, or a Java Management Extension (JMX) client. A client is an application that retrieves performance data from one or more servers and processes the data. Clients can include:
- Graphical user interfaces (GUIs) that display performance data in real time
- Applications that monitor performance data and trigger different events according to the current values of the data
- Any other application that needs to receive and process performance data
The PMI components and infrastructure have been extended and updated in WAS V5.0 to support the new management structure and to comply with the Performance Data Framework of the J2EE Management Specification.
PMI is composed of components for collecting performance data on the appserver side and components for communicating between runtime components and between the clients and servers. The primary PMI components and related Management Beans (MBeans) are illustrated in Figure 16-1.
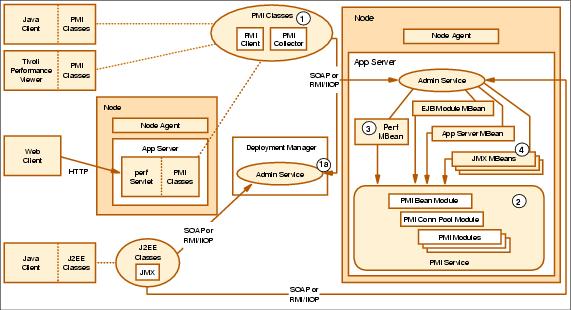
Figure 16-1 Performance monitoring components
The J2EE classes and PMI classes can use either the RMI over IIOP or SOAP protocol to communicate with the Administrative service. In a single-server environment the classes connect to the Administrative service of each individual appserver in order to collect performance data. In a Network Deployment environment, the client can choose to connect to the Deployment Manager first to retrieve a list of nodes, servers and MBeans in the cell. Performance data retrieval is subsequently performed in the same way for the two environments.
Each piece of performance data has two components: a static component and a dynamic component. The dynamic component consists of a name and an ID to identify the data, as well as other descriptive attributes that assist the client in processing and displaying the data. The dynamic component consists of information that changes over time, such as the current value of a counter and the time stamp associated with that value.
The PMI client package is part of the PMI application programming interface (API). This can be used to develop your own performance monitoring client. If you are interested in developing your own PMI clients, see Developing your own monitoring application.
WebSphere is a trademark of the IBM Corporation in the United States, other countries, or both.
IBM is a trademark of the IBM Corporation in the United States, other countries, or both.