| Instance Statistics Table
The Instance Statistics Table (see Figure 17-17) allows you to view data about particular instances of classes. The Instance Statistics Table contains the following information:
|
|
|
| Collected (not displayed by default)
|
|
|
|
| Base Time (not displayed by default)
|
|
|
|
| Inherited Base Time (not displayed by default)
|
|
|
|
| Cumulative Time (not displayed by default)
|
|
|
|
| Inherited Cumulative Time (not displayed by default)
|
|
|
|
| Calls (not displayed by default)
|
|
|
|
| Inherited Calls (not displayed by default)
|
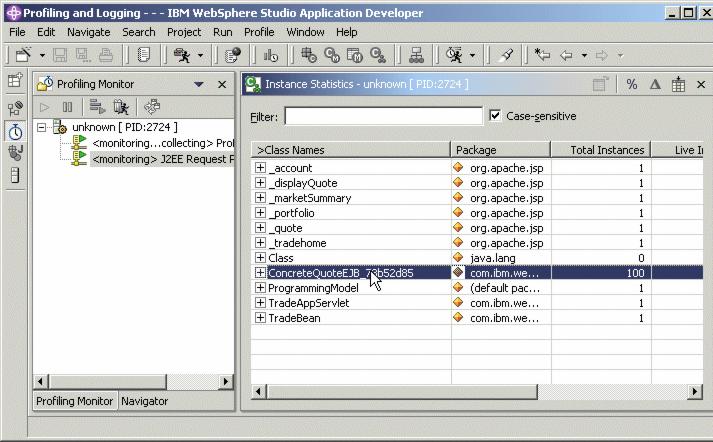
Figure 17-17 Instance Statistics Table
In this view, the Collected column displays the number of instances of the selected package, class, or method, that were removed during garbage collection.
From this table, it is possible to drill down to individual instances of particular classes by clicking the + symbol displayed on the left of the Class Name. By drilling down to individual instances, problems that may not be apparent just by looking at average or total values may be identified.
For example, particular instances of classes may be abnormally large. If this occurs, more details can be found by looking at the object references for the instance. To display this, right-click the instance and select Show Object References from the menu.
In general, determining why an object (including referenced objects) in Java requires a large amount of memory can be difficult, because the size of the object itself may be small, but there may be a set of references that eventually lead to a large object. This is a powerful tool to aid in identifying the root cause of excessive memory usage. As discussed in 18.2, Memory, minimizing memory usage is one of the key mechanisms for improving the performance of a Java application.
|