Execution Flow View
The Execution Flow View visually displays the method calls performed by the application being profiled. In order to reduce the amount of information being displayed to a manageable level, we recommend that you use the J2EE Request Profiler Agent for capturing data to be viewed in the Execution Flow View. The Execution Flow View is another way of determining which methods are executed most frequently, and hence are good candidates for optimization. An example of the Execution Flow View is provided in Figure 17-19.
The information that is displayed pictorially in the Execution Flow View can also be displayed in a hierarchical tabular form as shown in Figure 17-20. In some cases it may be easier to navigate through the data in this view, because it is possible to expand and collapse particular parts of the execution sequence. From this view, you can right-click a particular method invocation to display the Method Invocation View for that method.
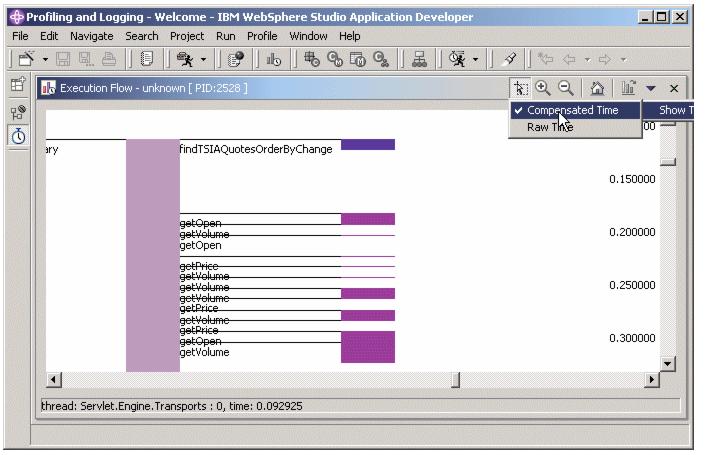
Figure 17-19 Execution Flow View

Figure 17-20 Execution Flow Table
WebSphere is a trademark of the IBM Corporation in the United States, other countries, or both.
IBM is a trademark of the IBM Corporation in the United States, other countries, or both.